Prácticas de restauración y manejo sostenible en los páramos de La Esperanza (Ecuador)

Description

Location

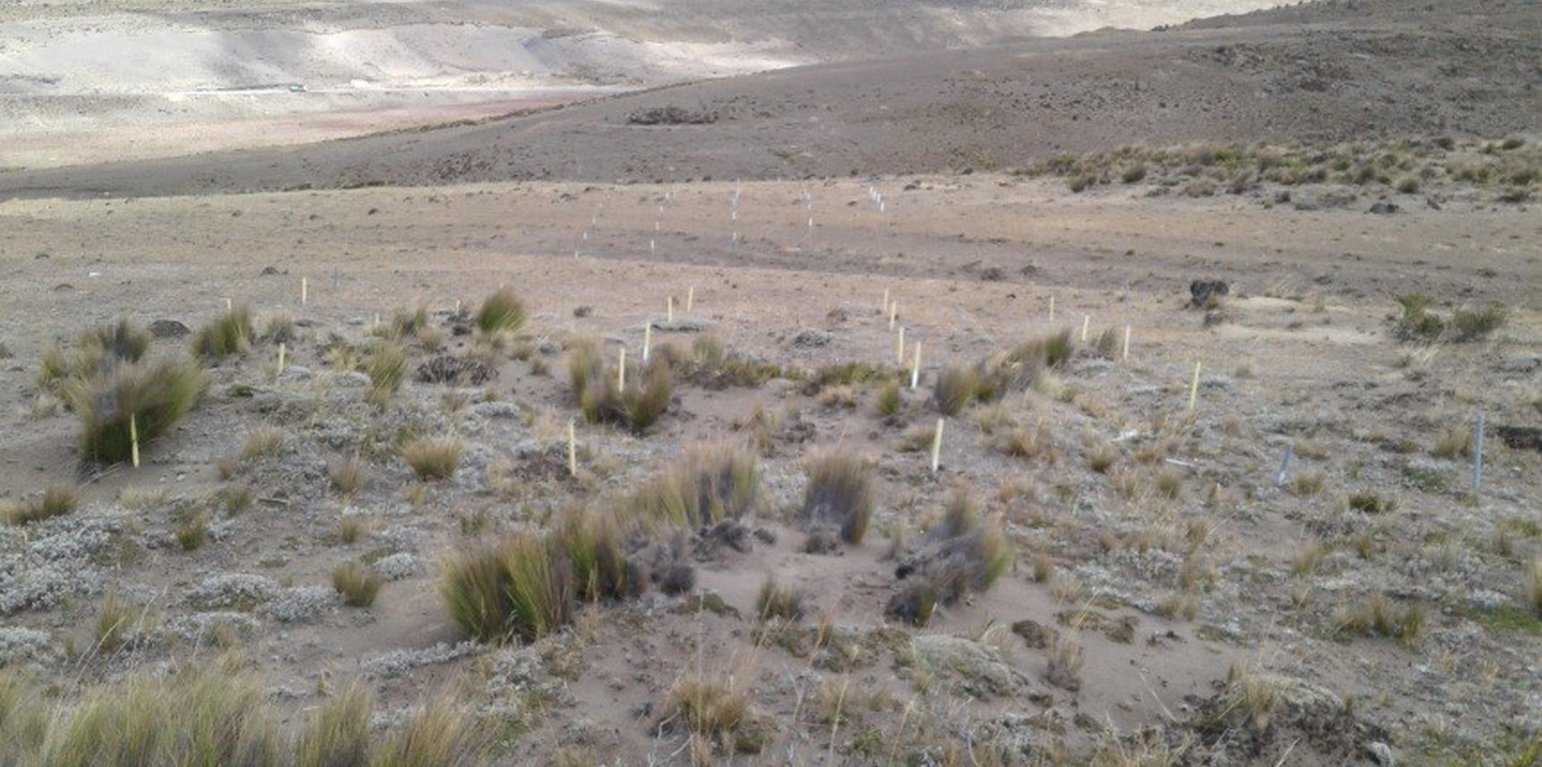
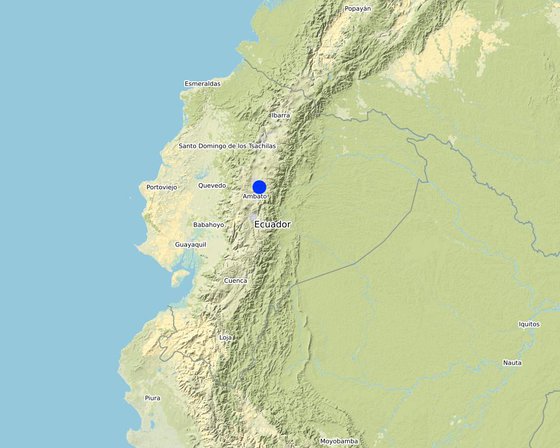
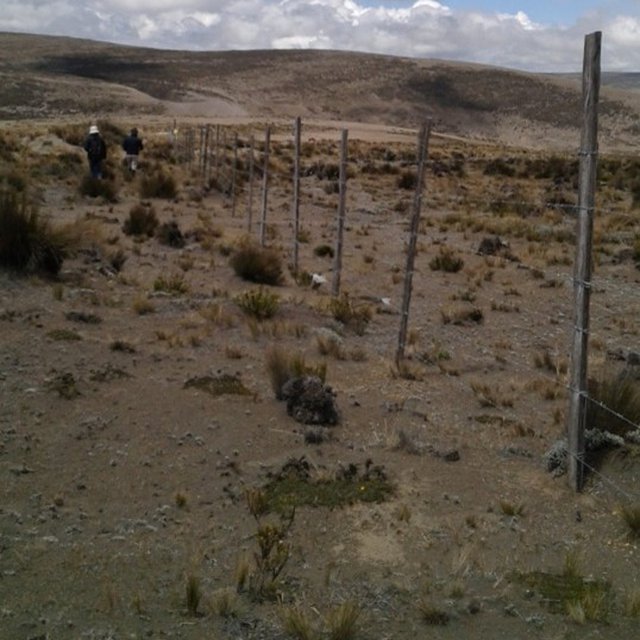
Location: Asociación La Esperanza - Sector Las Dogas, Tungurahua, Ecuador

No. of Technology sites analysed: single site

Geo-reference of selected sites
  • -78.53702, -1.06319

Spread of the Technology: evenly spread over an area (approx. 0.1-1 km2)

Date of implementation: less than 10 years ago (recently)

Type of introduction
(Carol Tapia)
(Carol Tapia)

Classification of the Technology

Main purpose
  • improve production
  • reduce, prevent, restore land degradation
  • conserve ecosystem
  • protect a watershed/ downstream areas – in combination with other Technologies
  • preserve/ improve biodiversity
  • reduce risk of disasters
  • adapt to climate change/ extremes and its impacts
  • mitigate climate change and its impacts
  • create beneficial economic impact
  • create beneficial social impact
Land use

  • Cropland - Annual cropping
    Main crops (cash and food crops):
  • Grazing land - Extensive grazing land: Nomadism
    Intensive grazing/ fodder production: Improved pastures
    Main animal species and products:
Water supply
  • rainfed
  • mixed rainfed-irrigated
  • full irrigation

Number of growing seasons per year: 1
Land use before implementation of the Technology: n.a.
Livestock density: n.a.
Purpose related to land degradation
  • prevent land degradation
  • reduce land degradation
  • restore/ rehabilitate severely degraded land
  • adapt to land degradation
  • not applicable
Degradation addressed
  • soil erosion by wind - Ed: deflation and deposition
  • physical soil deterioration - Pu: loss of bio-productive function due to other activities
  • biological degradation - Bc: reduction of vegetation cover
  • water degradation - Ha: aridification
SLM group
  • windbreak/ shelterbelt
  • area closure (stop use, support restoration)
  • water harvesting
SLM measures
  • vegetative measures - V1: Tree and shrub cover

Technical drawing

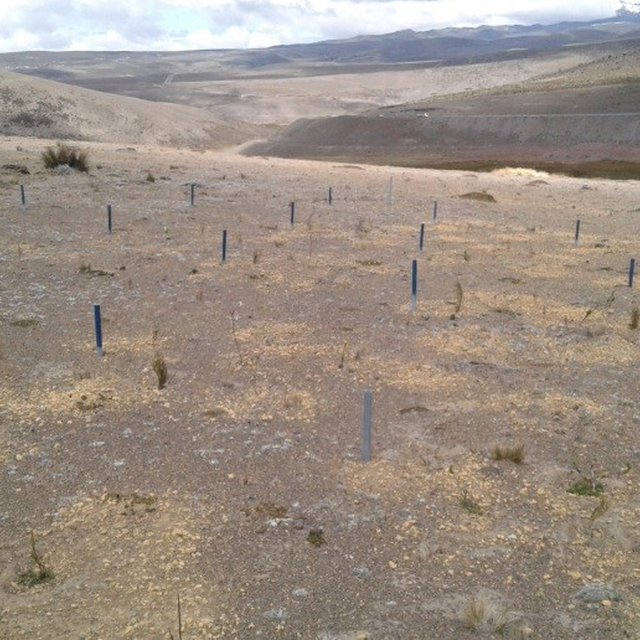
Technical specifications
Author: Carol Tapia

Establishment and maintenance: activities, inputs and costs

Calculation of inputs and costs
  • Costs are calculated: per Technology unit
  • Currency used for cost calculation: US Dollars
  • Exchange rate (to USD): 1 USD = n.a
  • Average wage cost of hired labour per day: 10-20 USD
Most important factors affecting the costs
n.a.
Establishment activities
  1. (Timing/ frequency: None)
  2. (Timing/ frequency: None)
Establishment inputs and costs
Specify input Unit Quantity Costs per Unit (US Dollars) Total costs per input (US Dollars) % of costs borne by land users
Labour
78.0 20.0 1560.0 100.0
296.0 20.0 5920.0 100.0
Equipment
10.0 40.0 400.0
34.0 941.18 32000.12
Plant material
3690.0 0.25 922.5
Fertilizers and biocides
5.0 200.0 1000.0
3.0 50.0 150.0
Construction material
23.0 14.0 322.0
Other
120.0 5.0 600.0
6.0 40.0 240.0
Total costs for establishment of the Technology 43'114.62
Maintenance activities
  1. (Timing/ frequency: Mensual, Semestral, Anual)
Maintenance inputs and costs
Specify input Unit Quantity Costs per Unit (US Dollars) Total costs per input (US Dollars) % of costs borne by land users
Labour
3.0 1200.0 3600.0
Total costs for maintenance of the Technology 3'600.0

Natural environment

Average annual rainfall
  • < 250 mm
  • 251-500 mm
  • 501-750 mm
  • 751-1,000 mm
  • 1,001-1,500 mm
  • 1,501-2,000 mm
  • 2,001-3,000 mm
  • 3,001-4,000 mm
  • > 4,000 mm
Agro-climatic zone
  • humid
  • sub-humid
  • semi-arid
  • arid
Specifications on climate
Average annual rainfall in mm: 1028.0
Slope
  • flat (0-2%)
  • gentle (3-5%)
  • moderate (6-10%)
  • rolling (11-15%)
  • hilly (16-30%)
  • steep (31-60%)
  • very steep (>60%)
Landforms
  • plateau/plains
  • ridges
  • mountain slopes
  • hill slopes
  • footslopes
  • valley floors
Altitude
  • 0-100 m a.s.l.
  • 101-500 m a.s.l.
  • 501-1,000 m a.s.l.
  • 1,001-1,500 m a.s.l.
  • 1,501-2,000 m a.s.l.
  • 2,001-2,500 m a.s.l.
  • 2,501-3,000 m a.s.l.
  • 3,001-4,000 m a.s.l.
  • > 4,000 m a.s.l.
Technology is applied in
  • convex situations
  • concave situations
  • not relevant
Soil depth
  • very shallow (0-20 cm)
  • shallow (21-50 cm)
  • moderately deep (51-80 cm)
  • deep (81-120 cm)
  • very deep (> 120 cm)
Soil texture (topsoil)
  • coarse/ light (sandy)
  • medium (loamy, silty)
  • fine/ heavy (clay)
Soil texture (> 20 cm below surface)
  • coarse/ light (sandy)
  • medium (loamy, silty)
  • fine/ heavy (clay)
Topsoil organic matter content
  • high (>3%)
  • medium (1-3%)
  • low (<1%)
Groundwater table
  • on surface
  • < 5 m
  • 5-50 m
  • > 50 m
Availability of surface water
  • excess
  • good
  • medium
  • poor/ none
Water quality (untreated)
  • good drinking water
  • poor drinking water (treatment required)
  • for agricultural use only (irrigation)
  • unusable
Is salinity a problem?
  • Ja
  • Nee

Occurrence of flooding
  • Ja
  • Nee
Species diversity
  • high
  • medium
  • low
Habitat diversity
  • high
  • medium
  • low

Characteristics of land users applying the Technology

Market orientation
  • subsistence (self-supply)
  • mixed (subsistence/ commercial
  • commercial/ market
Off-farm income
  • less than 10% of all income
  • 10-50% of all income
  • > 50% of all income
Relative level of wealth
  • very poor
  • poor
  • average
  • rich
  • very rich
Level of mechanization
  • manual work
  • animal traction
  • mechanized/ motorized
Sedentary or nomadic
  • Sedentary
  • Semi-nomadic
  • Nomadic
Individuals or groups
  • individual/ household
  • groups/ community
  • cooperative
  • employee (company, government)
Gender
  • women
  • men
Age
  • children
  • youth
  • middle-aged
  • elderly
Area used per household
  • < 0.5 ha
  • 0.5-1 ha
  • 1-2 ha
  • 2-5 ha
  • 5-15 ha
  • 15-50 ha
  • 50-100 ha
  • 100-500 ha
  • 500-1,000 ha
  • 1,000-10,000 ha
  • > 10,000 ha
Scale
  • small-scale
  • medium-scale
  • large-scale
Land ownership
  • state
  • company
  • communal/ village
  • group
  • individual, not titled
  • individual, titled
Land use rights
  • open access (unorganized)
  • communal (organized)
  • leased
  • individual
Water use rights
  • open access (unorganized)
  • communal (organized)
  • leased
  • individual
Access to services and infrastructure
health

poor
x
good
education

poor
x
good
technical assistance

poor
x
good
employment (e.g. off-farm)

poor
x
good
markets

poor
x
good
energy

poor
x
good
roads and transport

poor
x
good
drinking water and sanitation

poor
x
good
financial services

poor
x
good

Impacts

Socio-economic impacts
Socio-cultural impacts
community institutions
weakened
x
strengthened

SLM/ land degradation knowledge
reduced
x
improved

conflict mitigation
worsened
x
improved

Ecological impacts
soil cover
reduced
x
improved

vegetation cover
decreased
x
increased

Off-site impacts
buffering/ filtering capacity (by soil, vegetation, wetlands)
reduced
x
improved

Cost-benefit analysis

Benefits compared with establishment costs
Short-term returns
very negative
x
very positive

Long-term returns
very negative
x
very positive

Benefits compared with maintenance costs
Short-term returns
very negative
x
very positive

Long-term returns
very negative
x
very positive

Climate change

Gradual climate change
annual temperature increase

not well at all
very well
Answer: not known
seasonal rainfall increase

not well at all
x
very well
Season: wet/ rainy season
Climate-related extremes (disasters)
local rainstorm

not well at all
x
very well
local hailstorm

not well at all
x
very well
local windstorm

not well at all
x
very well
cold wave

not well at all
x
very well
drought

not well at all
x
very well

Adoption and adaptation

Percentage of land users in the area who have adopted the Technology
  • single cases/ experimental
  • 1-10%
  • 10-50%
  • more than 50%
Of all those who have adopted the Technology, how many have done so without receiving material incentives?
  • 0-10%
  • 10-50%
  • 50-90%
  • 90-100%
Number of households and/ or area covered
250
Has the Technology been modified recently to adapt to changing conditions?
  • Ja
  • Nee
To which changing conditions?
  • climatic change/ extremes
  • changing markets
  • labour availability (e.g. due to migration)

Conclusions and lessons learnt

Strengths: land user's view
  • None
  • None
Strengths: compiler’s or other key resource person’s view
  • None
  • None
  • None
  • None
Weaknesses/ disadvantages/ risks: land user's viewhow to overcome
  • None
  • None
Weaknesses/ disadvantages/ risks: compiler’s or other key resource person’s viewhow to overcome
  • None
  • None

References

Compiler
  • Raul Galeas
Editors
Reviewer
  • Tatenda Lemann
  • Johanna Jacobi
Date of documentation: Sept. 10, 2018
Last update: Julie 23, 2021
Resource persons
Full description in the WOCAT database
Linked SLM data
Documentation was faciliated by
Institution Project
Links to relevant information which is available online
This work is licensed under Creative Commons Attribution-NonCommercial-ShareaAlike 4.0 International