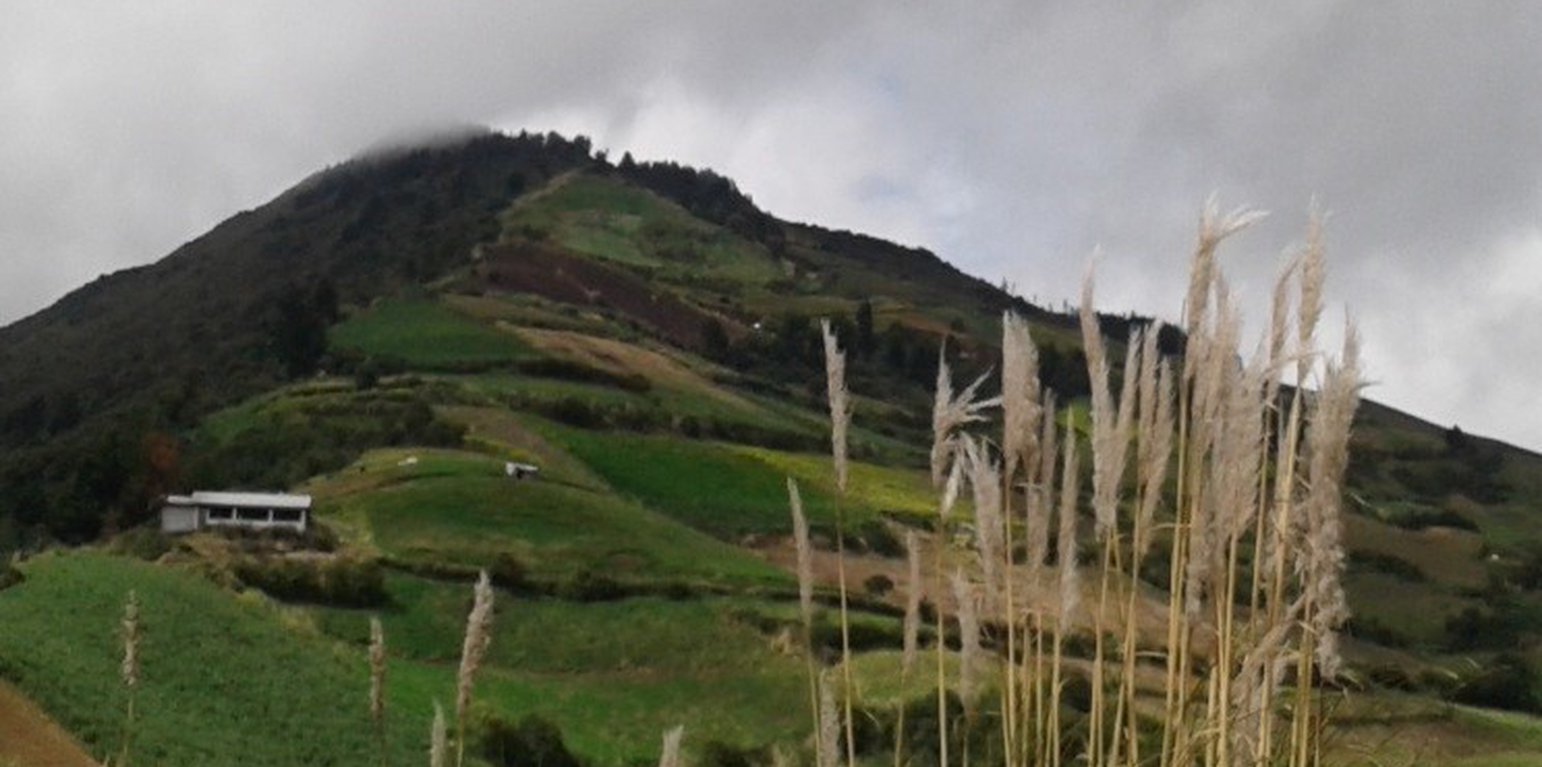
Protección de fuentes de agua en la comunidad de Llimpes
(Ecuador)
Comunidad Llimpes, Parroquia La Matriz, Cantón Quero, Provincia de Tungurahua
Location
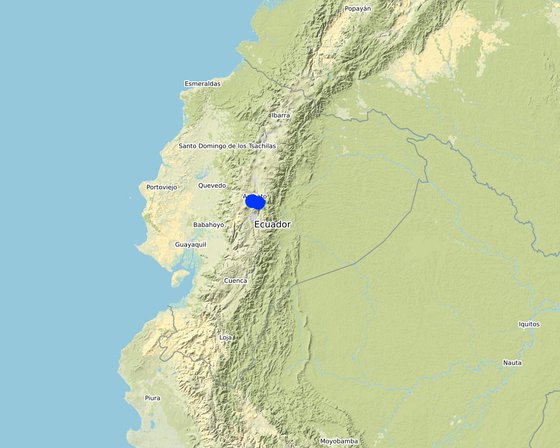
Location: Cantón Tisaleo, Comunidad de Santa Lucía Arriba Cantón Quero y Pelileo. Comunidad Puñachizag, Tungurahua, Ecuador
No. of Technology sites analysed: 2-10 sites
Geo-reference of selected sites
-
-78.68099, -1.34498
-
-78.56936, -1.37741
Spread of the Technology: evenly spread over an area (approx. 0.1-1 km2)
Date of implementation: less than 10 years ago (recently)
Type of introduction
-
through land users' innovation
-
as part of a traditional system (> 50 years)
-
during experiments/ research
-
through projects/ external interventions
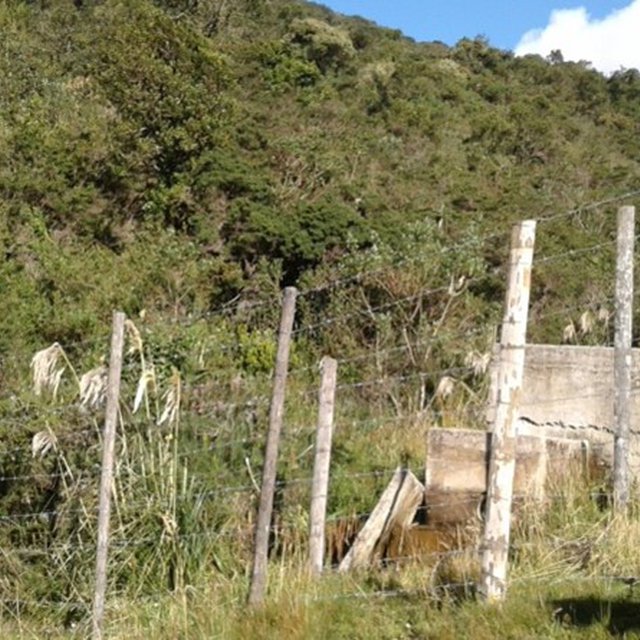
(Carol Tapia)
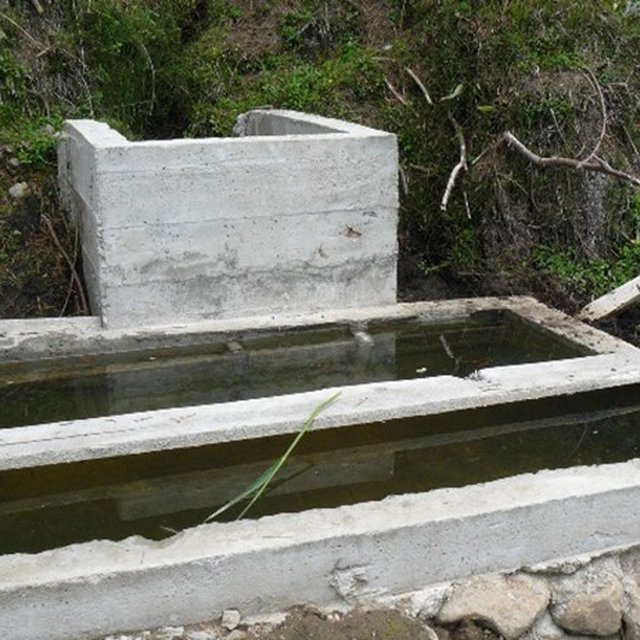
(Carol Tapia)
Classification of the Technology
Main purpose
-
improve production
-
reduce, prevent, restore land degradation
-
conserve ecosystem
-
protect a watershed/ downstream areas – in combination with other Technologies
-
preserve/ improve biodiversity
-
reduce risk of disasters
-
adapt to climate change/ extremes and its impacts
-
mitigate climate change and its impacts
-
create beneficial economic impact
-
create beneficial social impact
Land use
-
Forest/ woodlands - Tree plantation, afforestation: Monoculture exotic variety
Products and services: Timber, Nature conservation/ protection
-
Mixed (crops/ grazing/ trees), incl. agroforestry - Agro-pastoralism
Water supply
-
rainfed
-
mixed rainfed-irrigated
-
full irrigation
Number of growing seasons per year:
2
Land use before implementation of the Technology:
n.a.
Livestock density:
n.a.
Purpose related to land degradation
-
prevent land degradation
-
reduce land degradation
-
restore/ rehabilitate severely degraded land
-
adapt to land degradation
-
not applicable
Degradation addressed
-
physical soil deterioration - Pc: compaction, Pu: loss of bio-productive function due to other activities
-
biological degradation - Bc: reduction of vegetation cover, Bq: quantity/ biomass decline, Bl: loss of soil life
-
water degradation - Ha: aridification, Hs: change in quantity of surface water, Hg: change in groundwater/aquifer level, Hp: decline of surface water quality, Hq: decline of groundwater quality, Hw: reduction of the buffering capacity of wetland areas
SLM group
-
area closure (stop use, support restoration)
-
improved ground/ vegetation cover
-
surface water management (spring, river, lakes, sea)
SLM measures
-
vegetative measures - V1: Tree and shrub cover
-
structural measures - S7: Water harvesting/ supply/ irrigation equipment
-
management measures - M1: Change of land use type
| | | | | | | | | | | |
|
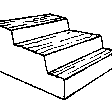
Technical drawing
Technical specifications
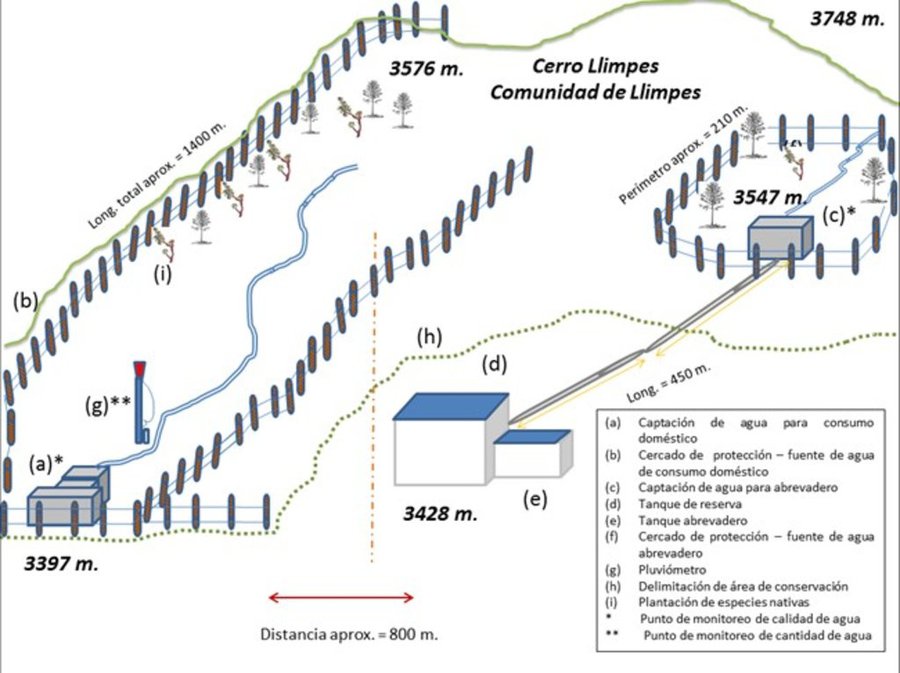
Author: Carol Tapia
|
Establishment and maintenance: activities, inputs and costs
Calculation of inputs and costs
- Costs are calculated: per Technology unit
- Currency used for cost calculation: US Dollars
- Exchange rate (to USD): 1 USD = n.a
- Average wage cost of hired labour per day: 10-20
Most important factors affecting the costs
n.a.
Establishment activities
-
(Timing/ frequency: None)
-
(Timing/ frequency: None)
-
(Timing/ frequency: None)
-
(Timing/ frequency: None)
-
(Timing/ frequency: None)
Establishment inputs and costs
| Specify input |
Unit |
Quantity |
Costs per Unit (US Dollars) |
Total costs per input (US Dollars) |
% of costs borne by land users |
|
Labour
|
|
1 |
1.0 |
200.0 |
200.0 |
100.0 |
|
1 |
1.0 |
3092.25 |
3092.25 |
100.0 |
|
1 |
1.0 |
75.0 |
75.0 |
100.0 |
|
1 |
1.0 |
500.0 |
500.0 |
100.0 |
|
Plant material
|
|
1 |
1.0 |
207.29 |
207.29 |
|
|
Construction material
|
|
1 |
1.0 |
942.6 |
942.6 |
|
|
1 |
1.0 |
7744.81 |
7744.81 |
|
|
1 |
1.0 |
4585.0 |
4585.0 |
|
| Total costs for establishment of the Technology |
17'346.95 |
|
Maintenance activities
-
(Timing/ frequency: None)
-
(Timing/ frequency: None)
-
(Timing/ frequency: None)
-
(Timing/ frequency: None)
Maintenance inputs and costs
| Specify input |
Unit |
Quantity |
Costs per Unit (US Dollars) |
Total costs per input (US Dollars) |
% of costs borne by land users |
|
Labour
|
|
|
144.0 |
15.0 |
2160.0 |
100.0 |
|
|
12.0 |
15.0 |
180.0 |
100.0 |
|
|
12.0 |
15.0 |
180.0 |
100.0 |
|
|
30.0 |
2.082 |
62.46 |
100.0 |
|
Equipment
|
|
|
12.0 |
63.84 |
766.08 |
100.0 |
|
|
10.0 |
12.0 |
120.0 |
100.0 |
|
Other
|
|
|
420.0 |
15.0 |
6300.0 |
100.0 |
| Total costs for maintenance of the Technology |
9'768.54 |
|
Natural environment
Average annual rainfall
-
< 250 mm
-
251-500 mm
-
501-750 mm
-
751-1,000 mm
-
1,001-1,500 mm
-
1,501-2,000 mm
-
2,001-3,000 mm
-
3,001-4,000 mm
-
> 4,000 mm
Agro-climatic zone
-
humid
-
sub-humid
-
semi-arid
-
arid
Specifications on climate
Average annual rainfall in mm: 615.0
Slope
-
flat (0-2%)
-
gentle (3-5%)
-
moderate (6-10%)
-
rolling (11-15%)
-
hilly (16-30%)
-
steep (31-60%)
-
very steep (>60%)
Landforms
-
plateau/plains
-
ridges
-
mountain slopes
-
hill slopes
-
footslopes
-
valley floors
Altitude
-
0-100 m a.s.l.
-
101-500 m a.s.l.
-
501-1,000 m a.s.l.
-
1,001-1,500 m a.s.l.
-
1,501-2,000 m a.s.l.
-
2,001-2,500 m a.s.l.
-
2,501-3,000 m a.s.l.
-
3,001-4,000 m a.s.l.
-
> 4,000 m a.s.l.
Technology is applied in
-
convex situations
-
concave situations
-
not relevant
Soil depth
-
very shallow (0-20 cm)
-
shallow (21-50 cm)
-
moderately deep (51-80 cm)
-
deep (81-120 cm)
-
very deep (> 120 cm)
Soil texture (topsoil)
-
coarse/ light (sandy)
-
medium (loamy, silty)
-
fine/ heavy (clay)
Soil texture (> 20 cm below surface)
-
coarse/ light (sandy)
-
medium (loamy, silty)
-
fine/ heavy (clay)
Topsoil organic matter content
-
high (>3%)
-
medium (1-3%)
-
low (<1%)
Groundwater table
-
on surface
-
< 5 m
-
5-50 m
-
> 50 m
Availability of surface water
-
excess
-
good
-
medium
-
poor/ none
Water quality (untreated)
-
good drinking water
-
poor drinking water (treatment required)
-
for agricultural use only (irrigation)
-
unusable
Is salinity a problem?
Occurrence of flooding
Characteristics of land users applying the Technology
Market orientation
-
subsistence (self-supply)
-
mixed (subsistence/ commercial
-
commercial/ market
Off-farm income
-
less than 10% of all income
-
10-50% of all income
-
> 50% of all income
Relative level of wealth
-
very poor
-
poor
-
average
-
rich
-
very rich
Level of mechanization
-
manual work
-
animal traction
-
mechanized/ motorized
Sedentary or nomadic
-
Sedentary
-
Semi-nomadic
-
Nomadic
Individuals or groups
-
individual/ household
-
groups/ community
-
cooperative
-
employee (company, government)
Age
-
children
-
youth
-
middle-aged
-
elderly
Area used per household
-
< 0.5 ha
-
0.5-1 ha
-
1-2 ha
-
2-5 ha
-
5-15 ha
-
15-50 ha
-
50-100 ha
-
100-500 ha
-
500-1,000 ha
-
1,000-10,000 ha
-
> 10,000 ha
Scale
-
small-scale
-
medium-scale
-
large-scale
Land ownership
-
state
-
company
-
communal/ village
-
group
-
individual, not titled
-
individual, titled
Land use rights
-
open access (unorganized)
-
communal (organized)
-
leased
-
individual
Water use rights
-
open access (unorganized)
-
communal (organized)
-
leased
-
individual
Access to services and infrastructure
employment (e.g. off-farm)
drinking water and sanitation
Impacts
Socio-economic impacts
drinking water availability
water availability for livestock
water quality for livestock
Socio-cultural impacts
SLM/ land degradation knowledge
Ecological impacts
beneficial species (predators, earthworms, pollinators)
emission of carbon and greenhouse gases
Off-site impacts
water availability (groundwater, springs)
reliable and stable stream flows in dry season (incl. low flows)
Cost-benefit analysis
Benefits compared with establishment costs
Short-term returns
very negative
very positive
Long-term returns
very negative
very positive
Benefits compared with maintenance costs
Short-term returns
very negative
very positive
Long-term returns
very negative
very positive
Climate change
Gradual climate change
annual temperature increase
not well at all
very well
seasonal rainfall increase
not well at all
very well
Climate-related extremes (disasters)
not well at all
very well
not well at all
very well
Adoption and adaptation
Percentage of land users in the area who have adopted the Technology
-
single cases/ experimental
-
1-10%
-
10-50%
-
more than 50%
Of all those who have adopted the Technology, how many have done so without receiving material incentives?
-
0-10%
-
10-50%
-
50-90%
-
90-100%
Number of households and/ or area covered
425
Has the Technology been modified recently to adapt to changing conditions?
To which changing conditions?
-
climatic change/ extremes
-
changing markets
-
labour availability (e.g. due to migration)
-
.
Conclusions and lessons learnt
Strengths: land user's view
Strengths: compiler’s or other key resource person’s view
-
None
-
None
-
None
-
None
-
None
-
None
Weaknesses/ disadvantages/ risks: land user's viewhow to overcome
Weaknesses/ disadvantages/ risks: compiler’s or other key resource person’s viewhow to overcome
References
Reviewer
-
Tatenda Lemann
-
Johanna Jacobi
Date of documentation: Sept. 10, 2018
Last update: Julie 23, 2021
Resource persons
-
Raúl Galeas (raul12hc@gmail.com) - SLM specialist
Full description in the WOCAT database
Documentation was faciliated by
Key references
-
"La páramos del Ecuador". Mena Vásconez Patricio y Medina Galo. 2001. Abya-Yala / Proyecto Páramo, Quito.: https://www.portalces.org/sites/default/files/references/044_Mena%20et%20al.%20(Eds.).%20%202001.Paramos%20Ecuador%20PORTADA%2B_%2BHOJA%2BTECNICA%2BY%2BPRESENTACION.pdf
-
"La biodiversidad en el Ecuador". Bravo Velásquez Elizabeth. 2014. Universidad Politécnica Salesiana. Cuenca-Ecuador.: https://dspace.ups.edu.ec/handle/123456789/6788
-
Informe de protección de fuentes de agua y construcción de abrevadero, en la comunidad Llimpes, en la parroquia La Matriz, en el cantón Quero.2017. Guevara, Rocío. Fondo de Páramos Tungurahua y Lucha contra la Pobreza.: En los archivos del Fondo de Páramos Tungurahua y Lucha contra la Pobreza en el GAD de la provincia de Tungurahua.
-
Informe y base de datos de Shaushi y Llimpes, que incluye la línea base llena y estructurada de acuerdo a los lineamientos de CONDESAN. Calle Juan. 2017. CONDESAN.: En los archivos del Consorcio para el Desarrollo Sostenible de la Ecorregión Andina CONDESAN.
-
Manual de monitoreo hídrico participativo. Calles Juan. 2016. CONDESAN.: En los archivos del Consorcio para el Desarrollo Sostenible de la Ecorregión Andina CONDESAN.
-
Reporte de Pobreza y Desigualdad. Diciembre 2016. INEC. Dirección responsable de la información estadística y contenidos: Dirección de Innovación en Métricas y Metodologías.: https://www.ecuadorencifras.gob.ec/documentos/web-inec/POBREZA/2016/Diciembre_2016/Reporte%20pobreza%20y%20desigualdad-dic16.pdf
-
Recomendaciones para la siembra de especies nativas en áreas de interés para la protección de fuentes hídricas en las comunidades Llimpes y Puñachizag, cantón Quero, del Frente Sur Occidental. CONDESAN. 2016.: En los archivos del Consorcio para el Desarrollo Sostenible de la Ecorregión Andina CONDESAN.
-
Ubicación del Nuevo Relleno Sanitario en base a criterios ambientales, socioeconómicos y técnicos, y propuesta de Plan de Reciclaje en la ciudad de Quero, Cantón Quero Provincia del Tungurahua. Cubillo Paulina. 2005. Escuela Politécnica del Ejército.: http://repositorio.espe.edu.ec/handle/21000/722
-
Introducción a la Hidrogeología del Ecuador (Segunda Versión). Burbano Napoléon, Becerra Simón, Pasquel Efrén. 2014. INAMHI: http://www.serviciometeorologico.gob.ec/Publicaciones/Hidrologia/HIDROGEOLOGIA_2%20EDICION_2014.pdf
Links to relevant information which is available online