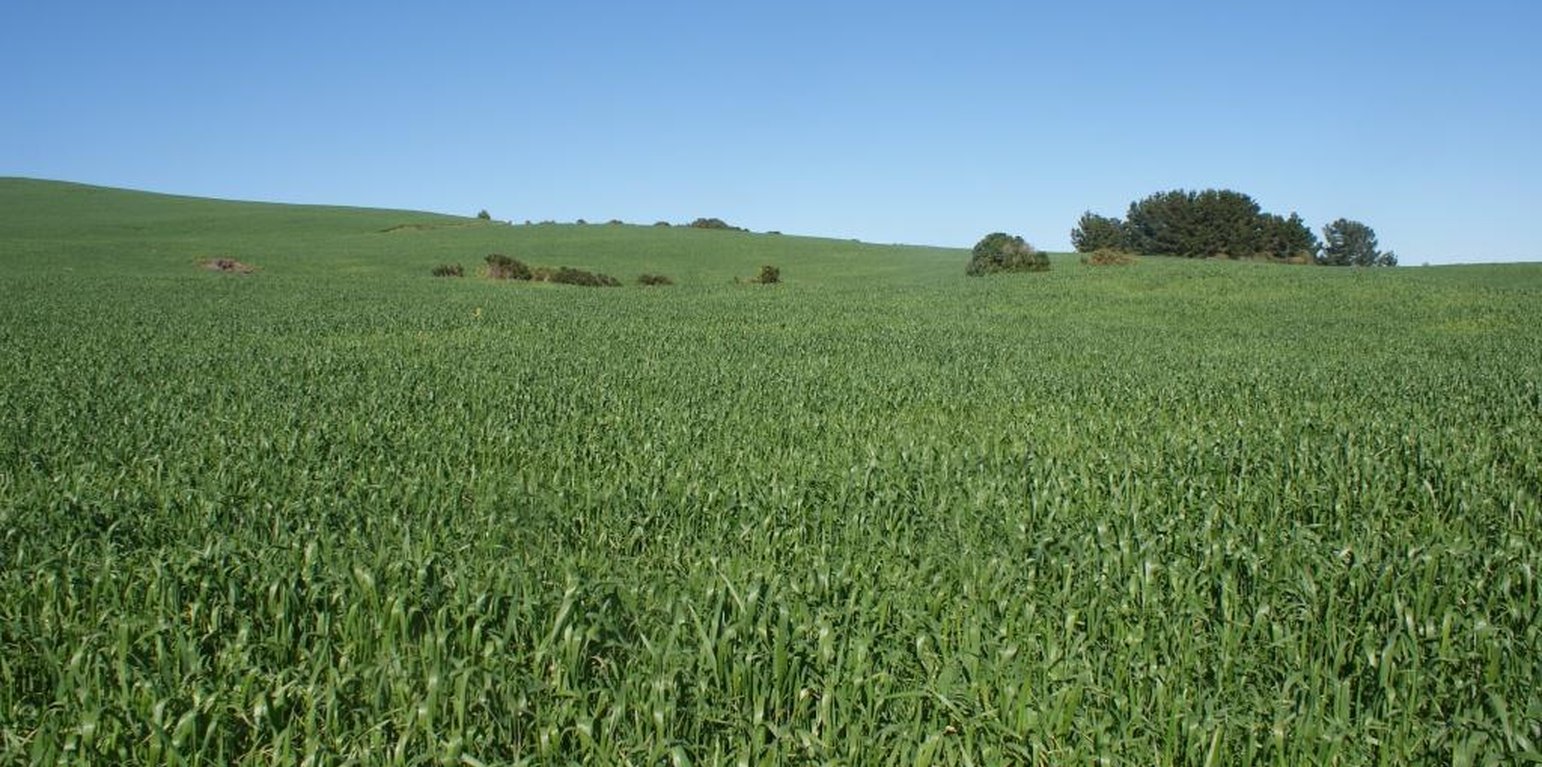
Wheat sown with no tillage (Carlos Ovalle)

No tillage preceded by subsoiling (Chile)

Cero labranza con subsolado

Description

No tillage preceded by subsoiling consists in the use of a subsoiler at a 50 cm depth every 5 years before performing no tillage agriculture.

In the “secano interior” of the Mediterranean climate area of central Chile, water erosion and inappropriate agricultural systems along hillslopes are the major causes of soil degradation.
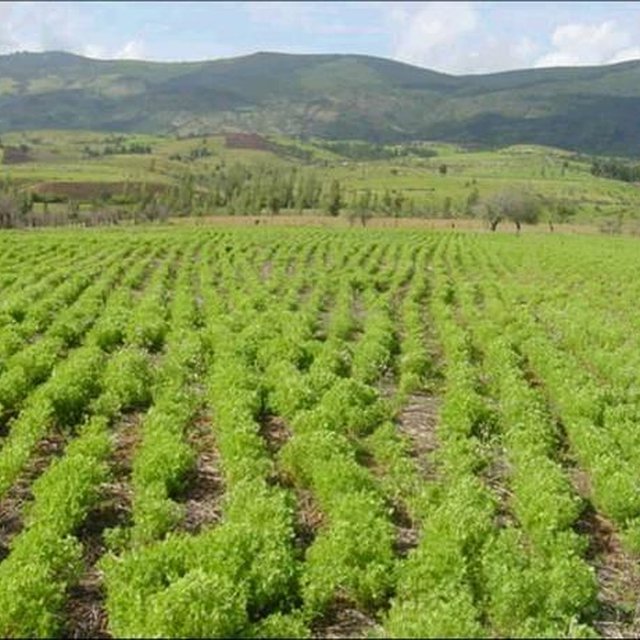
Subsoil tillage is performed with a three-pointed 50-cm chisel plough (see photo), without turning the soil. Subsoiling is needed every five years to break the hard pan after soil compaction. Then crops are directly seeded without any tillage and with stubble left on the field.

Purpose of the Technology: Subsoiling before zero tillage agriculture mitigates water erosion compared to the traditional tillage. In heavy rainfall events, zero tillage reduced soil loss by more than 72% compared to conventional tillage. In addition, the runoff coefficient during the rainy period was 70% lower with zero tillage These results show the importance of conservation tillage and crop stubble management for decreasing erosion, especially in years when extreme rainfall events lead to a high potential for soil erosion. In relation to soil compaction, comparing the resistance to penetration in the soil profile, the traditional tillage system showed a strongly compacted layer at a depth of 10 cm (>1300 kPa), which increased to over 2000 kPa at depths of 15-20 cm. In contrast, no tillage preceded by subsoiling showed less compaction, beyond 20 cm below the threshold of 2000 kPa, defined by several authors as the critical threshold for radicular growth. Moreover, cereal production showed higher biomass and grain yield. It is concluded that subsoiling before no tillage agriculture with stubble retained on the surface was the best option to mitigate soil erosion.

Establishment / maintenance activities and inputs: The main disadvantage of the system is that the farmer requires more capital to lease machinery, which in the traditional system is done with animal traction, and the horses or oxen are from their own property. However, the improved yield covers the machinery lease costs. Additionally, the system pushes small farmers into co-operatives, because it is not possible for everyone to own the equipment. To resolve this problem the project promoted the creation of small enterprises (of 10 people) to jointly purchase no-tillage machinery.

Natural / human environment: The area has a subhumid Mediterranean climate with an average annual precipitation of 695 mm (80% concentrated in winter), with five months of drought. Soils are Alfisols of the Cauquenes type, classified as Ultic Palexeralfs. The soil is made up of materials of granite origin with moderate acidic conditions and low organic carbon. Soil clay content is 15% between 0 and 18 cm depth, below this depth it is higher than 44%. Topography is a hillside with 10 to 20 % slope and the main traditional crop rotation is oat-wheat or wheat-natural pasture.

Location

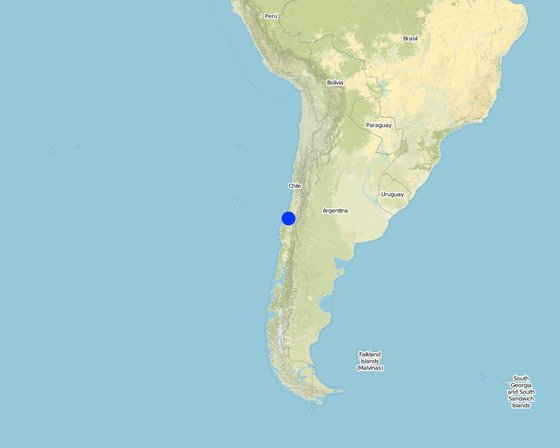
Location: Cauquenes, Bíobio and Maule region, Chile

No. of Technology sites analysed:

Geo-reference of selected sites
  • -72.35, -35.967

Spread of the Technology: evenly spread over an area (10.0 km²)

In a permanently protected area?:

Date of implementation: less than 10 years ago (recently)

Type of introduction
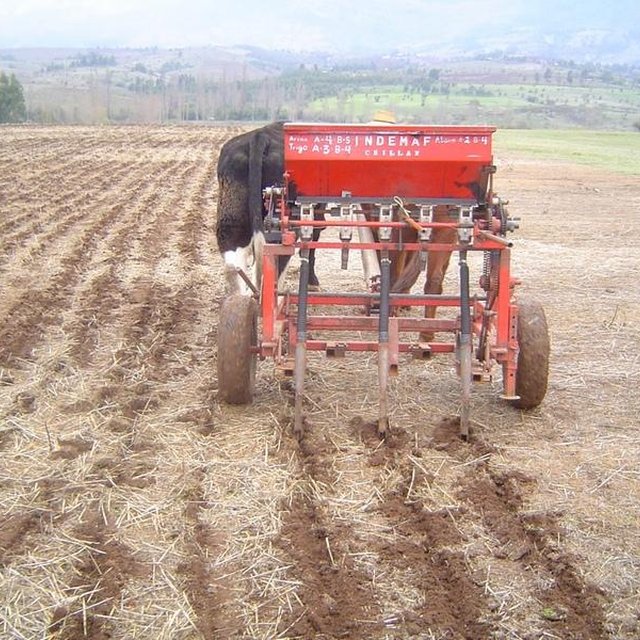
No tillage agriculture (Carlos Ruiz)
Crop rotation lentil-wheat in no tillage

Classification of the Technology

Main purpose
  • improve production
  • reduce, prevent, restore land degradation
  • conserve ecosystem
  • protect a watershed/ downstream areas – in combination with other Technologies
  • preserve/ improve biodiversity
  • reduce risk of disasters
  • adapt to climate change/ extremes and its impacts
  • mitigate climate change and its impacts
  • create beneficial economic impact
  • create beneficial social impact
Land use
Land use mixed within the same land unit: Ja - Agro-silvopastoralism

  • Cropland
    • Annual cropping: legumes and pulses - other, wheat, lentils
    • Perennial (non-woody) cropping
    • Tree and shrub cropping: grapes
    Number of growing seasons per year: 1
    Is crop rotation practiced? Ja
  • Grazing land
      Animal type: sheep
    Water supply
    • rainfed
    • mixed rainfed-irrigated
    • full irrigation

    Purpose related to land degradation
    • prevent land degradation
    • reduce land degradation
    • restore/ rehabilitate severely degraded land
    • adapt to land degradation
    • not applicable
    Degradation addressed
    • physical soil deterioration - Pc: compaction
    SLM group
    • minimal soil disturbance
    SLM measures
    • agronomic measures - A4: Subsurface treatment

    Technical drawing

    Technical specifications

    Establishment and maintenance: activities, inputs and costs

    Calculation of inputs and costs
    • Costs are calculated:
    • Currency used for cost calculation: USD
    • Exchange rate (to USD): 1 USD = n.a
    • Average wage cost of hired labour per day: n.a
    Most important factors affecting the costs
    Availability of machinery is the most determining factor affecting the costs.
    Establishment activities
    1. No tillage machinery (Timing/ frequency: None)
    2. Subsoiling every 5 years (Timing/ frequency: None)
    Establishment inputs and costs
    Specify input Unit Quantity Costs per Unit (USD) Total costs per input (USD) % of costs borne by land users
    Labour
    Subsoiling unit 1.0 50.0 50.0 100.0
    Equipment
    Renting seeder machine unit 1.0 60.0 60.0
    Renting subsoiling machine unit 1.0 70.0 70.0
    Total costs for establishment of the Technology 180.0
    Total costs for establishment of the Technology in USD 180.0
    Maintenance activities
    1. Herbicide application (Timing/ frequency: None)
    2. Seeding (Timing/ frequency: None)
    3. Fertilization (Timing/ frequency: None)
    Maintenance inputs and costs
    Specify input Unit Quantity Costs per Unit (USD) Total costs per input (USD) % of costs borne by land users
    Labour
    Herbicide application unit 1.0 20.0 20.0
    Equipment
    Renting seeder machine unit 1.0 60.0 60.0
    Plant material
    Seeds unit 1.0 50.0 50.0
    Fertilizers and biocides
    Fertilizer unit 1.0 174.0 174.0
    Herbicide unit 1.0 20.0 20.0
    Total costs for maintenance of the Technology 324.0
    Total costs for maintenance of the Technology in USD 324.0

    Natural environment

    Average annual rainfall
    • < 250 mm
    • 251-500 mm
    • 501-750 mm
    • 751-1,000 mm
    • 1,001-1,500 mm
    • 1,501-2,000 mm
    • 2,001-3,000 mm
    • 3,001-4,000 mm
    • > 4,000 mm
    Agro-climatic zone
    • humid
    • sub-humid
    • semi-arid
    • arid
    Specifications on climate
    80% rainfall between May - August
    Thermal climate class: temperate
    Slope
    • flat (0-2%)
    • gentle (3-5%)
    • moderate (6-10%)
    • rolling (11-15%)
    • hilly (16-30%)
    • steep (31-60%)
    • very steep (>60%)
    Landforms
    • plateau/plains
    • ridges
    • mountain slopes
    • hill slopes
    • footslopes
    • valley floors
    Altitude
    • 0-100 m a.s.l.
    • 101-500 m a.s.l.
    • 501-1,000 m a.s.l.
    • 1,001-1,500 m a.s.l.
    • 1,501-2,000 m a.s.l.
    • 2,001-2,500 m a.s.l.
    • 2,501-3,000 m a.s.l.
    • 3,001-4,000 m a.s.l.
    • > 4,000 m a.s.l.
    Technology is applied in
    • convex situations
    • concave situations
    • not relevant
    Soil depth
    • very shallow (0-20 cm)
    • shallow (21-50 cm)
    • moderately deep (51-80 cm)
    • deep (81-120 cm)
    • very deep (> 120 cm)
    Soil texture (topsoil)
    • coarse/ light (sandy)
    • medium (loamy, silty)
    • fine/ heavy (clay)
    Soil texture (> 20 cm below surface)
    • coarse/ light (sandy)
    • medium (loamy, silty)
    • fine/ heavy (clay)
    Topsoil organic matter content
    • high (>3%)
    • medium (1-3%)
    • low (<1%)
    Groundwater table
    • on surface
    • < 5 m
    • 5-50 m
    • > 50 m
    Availability of surface water
    • excess
    • good
    • medium
    • poor/ none
    Water quality (untreated)
    • good drinking water
    • poor drinking water (treatment required)
    • for agricultural use only (irrigation)
    • unusable
    Water quality refers to:
    Is salinity a problem?
    • Ja
    • Nee

    Occurrence of flooding
    • Ja
    • Nee
    Species diversity
    • high
    • medium
    • low
    Habitat diversity
    • high
    • medium
    • low

    Characteristics of land users applying the Technology

    Market orientation
    • subsistence (self-supply)
    • mixed (subsistence/ commercial)
    • commercial/ market
    Off-farm income
    • less than 10% of all income
    • 10-50% of all income
    • > 50% of all income
    Relative level of wealth
    • very poor
    • poor
    • average
    • rich
    • very rich
    Level of mechanization
    • manual work
    • animal traction
    • mechanized/ motorized
    Sedentary or nomadic
    • Sedentary
    • Semi-nomadic
    • Nomadic
    Individuals or groups
    • individual/ household
    • groups/ community
    • cooperative
    • employee (company, government)
    Gender
    • women
    • men
    Age
    • children
    • youth
    • middle-aged
    • elderly
    Area used per household
    • < 0.5 ha
    • 0.5-1 ha
    • 1-2 ha
    • 2-5 ha
    • 5-15 ha
    • 15-50 ha
    • 50-100 ha
    • 100-500 ha
    • 500-1,000 ha
    • 1,000-10,000 ha
    • > 10,000 ha
    Scale
    • small-scale
    • medium-scale
    • large-scale
    Land ownership
    • state
    • company
    • communal/ village
    • group
    • individual, not titled
    • individual, titled
    Land use rights
    • open access (unorganized)
    • communal (organized)
    • leased
    • individual
    Water use rights
    • open access (unorganized)
    • communal (organized)
    • leased
    • individual
    Access to services and infrastructure
    health

    poor
    x
    good
    education

    poor
    x
    good
    technical assistance

    poor
    x
    good
    employment (e.g. off-farm)

    poor
    x
    good
    energy

    poor
    x
    good
    roads and transport

    poor
    x
    good
    drinking water and sanitation

    poor
    x
    good
    financial services

    poor
    x
    good

    Impacts

    Socio-economic impacts
    Crop production
    decreased
    x
    increased

    risk of production failure
    increased
    x
    decreased

    land management
    hindered
    x
    simplified

    expenses on agricultural inputs
    increased
    x
    decreased

    farm income
    decreased
    x
    increased

    workload
    increased
    x
    decreased

    Socio-cultural impacts
    food security/ self-sufficiency
    reduced
    x
    improved

    community institutions
    weakened
    x
    strengthened

    SLM/ land degradation knowledge
    reduced
    x
    improved

    livelihood and human well-being
    reduced
    x
    improved


    mproved tillage improves crop yields and thus household income increases

    Ecological impacts
    surface runoff
    increased
    x
    decreased

    soil cover
    reduced
    x
    improved

    soil loss
    increased
    x
    decreased

    soil crusting/ sealing
    increased
    x
    reduced

    soil compaction
    increased
    x
    reduced

    nutrient cycling/ recharge
    decreased
    x
    increased

    soil organic matter/ below ground C
    decreased
    x
    increased

    biomass/ above ground C
    decreased
    x
    increased

    Off-site impacts
    water availability (groundwater, springs)
    decreased
    x
    increased

    Cost-benefit analysis

    Benefits compared with establishment costs
    Short-term returns
    very negative
    x
    very positive

    Long-term returns
    very negative
    x
    very positive

    Benefits compared with maintenance costs
    Short-term returns
    very negative
    x
    very positive

    Long-term returns
    very negative
    x
    very positive

    Climate change

    Gradual climate change
    annual temperature increase

    not well at all
    x
    very well
    Climate-related extremes (disasters)
    local rainstorm

    not well at all
    x
    very well
    drought

    not well at all
    x
    very well

    Adoption and adaptation

    Percentage of land users in the area who have adopted the Technology
    • single cases/ experimental
    • 1-10%
    • 11-50%
    • > 50%
    Of all those who have adopted the Technology, how many have done so without receiving material incentives?
    • 0-10%
    • 11-50%
    • 51-90%
    • 91-100%
    Number of households and/ or area covered
    100 households
    Has the Technology been modified recently to adapt to changing conditions?
    • Ja
    • Nee
    To which changing conditions?
    • climatic change/ extremes
    • changing markets
    • labour availability (e.g. due to migration)

    Conclusions and lessons learnt

    Strengths: land user's view
    Strengths: compiler’s or other key resource person’s view
    • No tillage preceded by subsoiling as part of the incentive programme for the recovery of degraded soils managed by the Agriculture and Livestock Service (SAG)

      How can they be sustained / enhanced? Adjusting incentives according to timing of the expenses and investments and also conditioning incentives to the adoption of the technologies
    Weaknesses/ disadvantages/ risks: land user's viewhow to overcome
    Weaknesses/ disadvantages/ risks: compiler’s or other key resource person’s viewhow to overcome
    • The availability of machines is the main obstacle for adopting zero tillage and subsoiling To create and promote small companies of agricultural machinery, managed by farmers themselves. Two examples already exist in the counties of San Carlos and Ninhue.

    References

    Compiler
    • Carlos Ovalle
    Editors
    Reviewer
    • Deborah Niggli
    • Alexandra Gavilano
    Date of documentation: Nov. 22, 2010
    Last update: Sept. 9, 2019
    Resource persons
    Full description in the WOCAT database
    Linked SLM data
    Documentation was faciliated by
    Institution Project
    Key references
    • www.inia.cl/link.cgi/GEAM:
    • www.inia.cl/proyectocadepa:
    • - Del Pozo, A., Del Canto, P. 1999. Areas agroclimaticas y sistemas productivos en la VII y VIII Región. (INIA): adelpozo@utalca.cl
    • - Stolpe, Neal. 2006. Descripciones de los principales suelos de la VIII R de Chile. Depto. De Suelos y Rec. Naturales. Universidad de Concepción.: nstolpe@udec.cl
    This work is licensed under Creative Commons Attribution-NonCommercial-ShareaAlike 4.0 International