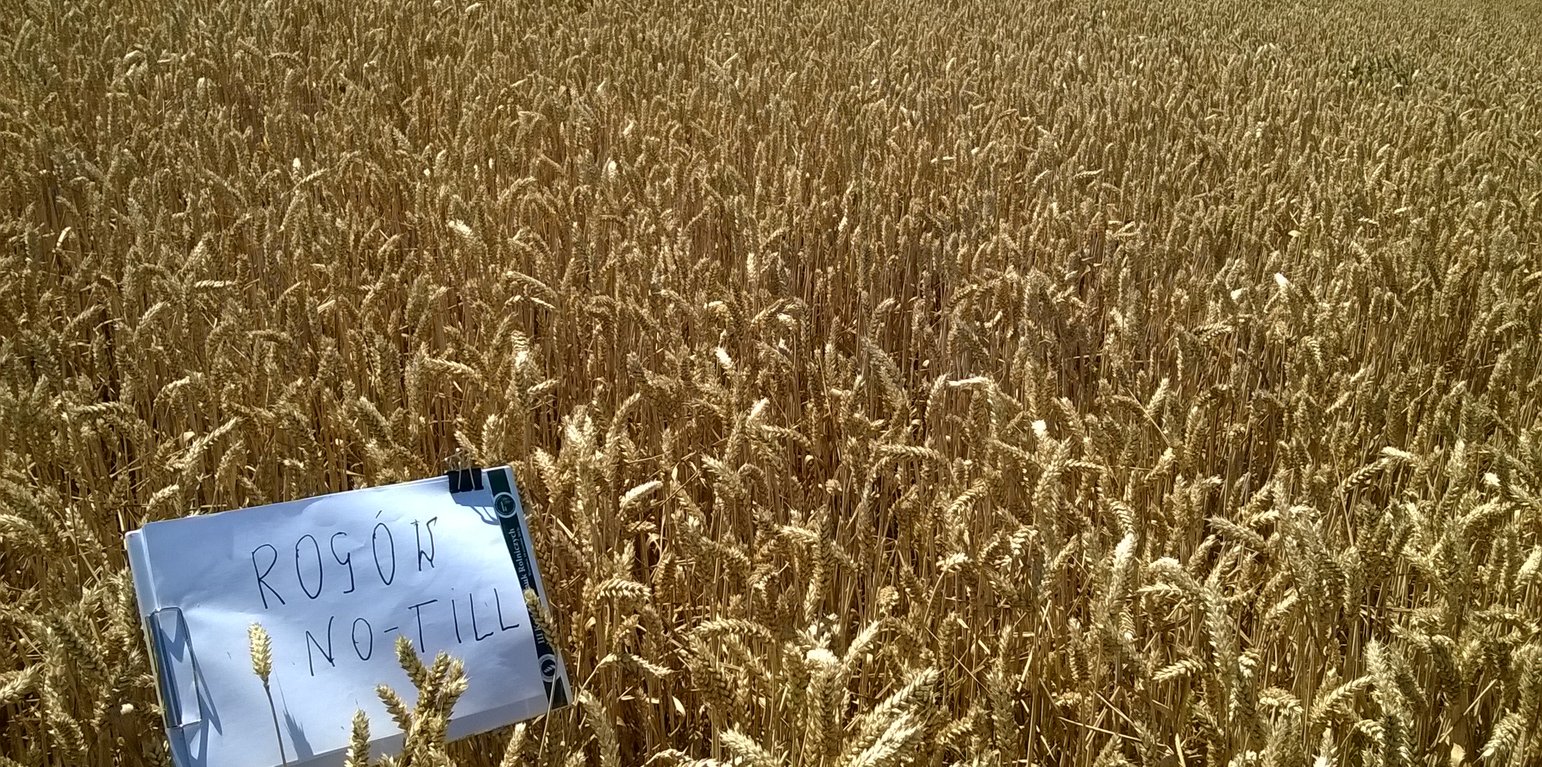
Cereals growth on the field with no-tillage (Magdalena Frąc)

No-till (Poland)

No-till

Description

No-till is a system where crops are planted into the soil without primary tillage.

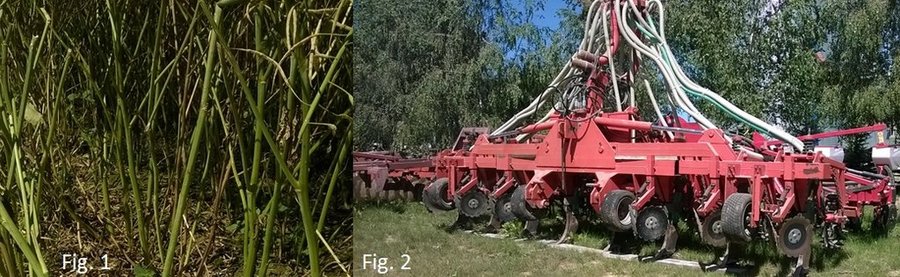
The technology is used in Rogów (N 50.80018 E 23.44883), in Zamosc Region in Poland under cereals or oil crops. The technology is used on about 700 ha area. The case study is embedded in a typical agricultural region on rather fertile soils formed from loess. The altitude at the study site is 238 m.a.s.l., average temperature 17.6°C and precipitation 563 mm. The farmer uses direct sowing technique and the following machines: stubble cultivator, seed drill with disc coulters and combine harvesters. The crop rotation includes the following crops: wheat/maize/wheat/rape. No-till, as well as minimum and reduced tillage, provides the opportunity to reduce energy requirements, increase soil organic matter content and protects the soil against erosion, runoff and compaction. No-till may often increase crop yields. The costs reduction for fuel making this technology more attractive commercially. No-till reduces CO2 emission from fuel during machinery usage. The presence of crop residues on the surface of soil layer can cause plant diseases. It is necessary to use some low amount of herbicides and fungicides in no-till.

Location

Location: Rogów, Poland

No. of Technology sites analysed: single site

Geo-reference of selected sites
  • 23.4884, 50.79988

Spread of the Technology: evenly spread over an area (approx. 0.1-1 km2)

In a permanently protected area?:

Date of implementation: 10-50 years ago

Type of introduction
Cereales growth in no-till field (Magdalena Frąc)

Classification of the Technology

Main purpose
  • improve production
  • reduce, prevent, restore land degradation
  • conserve ecosystem
  • protect a watershed/ downstream areas – in combination with other Technologies
  • preserve/ improve biodiversity
  • reduce risk of disasters
  • adapt to climate change/ extremes and its impacts
  • mitigate climate change and its impacts
  • create beneficial economic impact
  • create beneficial social impact
Land use

  • Cropland
    • Annual cropping
    Number of growing seasons per year: 1

Water supply
  • rainfed
  • mixed rainfed-irrigated
  • full irrigation

Purpose related to land degradation
  • prevent land degradation
  • reduce land degradation
  • restore/ rehabilitate severely degraded land
  • adapt to land degradation
  • not applicable
Degradation addressed
  • soil erosion by water - Wt: loss of topsoil/ surface erosion
SLM group
  • minimal soil disturbance
SLM measures
  • agronomic measures - A1: Vegetation/ soil cover, A3: Soil surface treatment (A 3.1: No tillage)

Technical drawing

Technical specifications
Fig. 1. Crop residues on no-till field under rape
Fig. 2. Seed drill with disc coulters (seeds are introduced into the soil pneumatically)
Author: Magdalena Frąc

Establishment and maintenance: activities, inputs and costs

Calculation of inputs and costs
  • Costs are calculated: per Technology area (size and area unit: 1 ha)
  • Currency used for cost calculation: PLN
  • Exchange rate (to USD): 1 USD = 0.28 PLN
  • Average wage cost of hired labour per day: 50-100 PLN
Most important factors affecting the costs
Cost of machinery appropriate to no-till and costs to meet bill of machinery contractor
Establishment activities
n.a.
Maintenance activities
  1. Rill opening of soil (Timing/ frequency: Spring or autumn depending on the crop type)
  2. Direct sowing and fertilizing applied at once through direct sowing machine (Timing/ frequency: Spring or autumn depending on the crop type)
Total maintenance costs (estimation)
360.0

Natural environment

Average annual rainfall
  • < 250 mm
  • 251-500 mm
  • 501-750 mm
  • 751-1,000 mm
  • 1,001-1,500 mm
  • 1,501-2,000 mm
  • 2,001-3,000 mm
  • 3,001-4,000 mm
  • > 4,000 mm
Agro-climatic zone
  • humid
  • sub-humid
  • semi-arid
  • arid
Specifications on climate
n.a.
Slope
  • flat (0-2%)
  • gentle (3-5%)
  • moderate (6-10%)
  • rolling (11-15%)
  • hilly (16-30%)
  • steep (31-60%)
  • very steep (>60%)
Landforms
  • plateau/plains
  • ridges
  • mountain slopes
  • hill slopes
  • footslopes
  • valley floors
Altitude
  • 0-100 m a.s.l.
  • 101-500 m a.s.l.
  • 501-1,000 m a.s.l.
  • 1,001-1,500 m a.s.l.
  • 1,501-2,000 m a.s.l.
  • 2,001-2,500 m a.s.l.
  • 2,501-3,000 m a.s.l.
  • 3,001-4,000 m a.s.l.
  • > 4,000 m a.s.l.
Technology is applied in
  • convex situations
  • concave situations
  • not relevant
Soil depth
  • very shallow (0-20 cm)
  • shallow (21-50 cm)
  • moderately deep (51-80 cm)
  • deep (81-120 cm)
  • very deep (> 120 cm)
Soil texture (topsoil)
  • coarse/ light (sandy)
  • medium (loamy, silty)
  • fine/ heavy (clay)
Soil texture (> 20 cm below surface)
  • coarse/ light (sandy)
  • medium (loamy, silty)
  • fine/ heavy (clay)
Topsoil organic matter content
  • high (>3%)
  • medium (1-3%)
  • low (<1%)
Groundwater table
  • on surface
  • < 5 m
  • 5-50 m
  • > 50 m
Availability of surface water
  • excess
  • good
  • medium
  • poor/ none
Water quality (untreated)
  • good drinking water
  • poor drinking water (treatment required)
  • for agricultural use only (irrigation)
  • unusable
Water quality refers to:
Is salinity a problem?
  • Ja
  • Nee

Occurrence of flooding
  • Ja
  • Nee
Species diversity
  • high
  • medium
  • low
Habitat diversity
  • high
  • medium
  • low

Characteristics of land users applying the Technology

Market orientation
  • subsistence (self-supply)
  • mixed (subsistence/ commercial)
  • commercial/ market
Off-farm income
  • less than 10% of all income
  • 10-50% of all income
  • > 50% of all income
Relative level of wealth
  • very poor
  • poor
  • average
  • rich
  • very rich
Level of mechanization
  • manual work
  • animal traction
  • mechanized/ motorized
Sedentary or nomadic
  • Sedentary
  • Semi-nomadic
  • Nomadic
Individuals or groups
  • individual/ household
  • groups/ community
  • cooperative
  • employee (company, government)
Gender
  • women
  • men
Age
  • children
  • youth
  • middle-aged
  • elderly
Area used per household
  • < 0.5 ha
  • 0.5-1 ha
  • 1-2 ha
  • 2-5 ha
  • 5-15 ha
  • 15-50 ha
  • 50-100 ha
  • 100-500 ha
  • 500-1,000 ha
  • 1,000-10,000 ha
  • > 10,000 ha
Scale
  • small-scale
  • medium-scale
  • large-scale
Land ownership
  • state
  • company
  • communal/ village
  • group
  • individual, not titled
  • individual, titled
  • family
Land use rights
  • open access (unorganized)
  • communal (organized)
  • leased
  • individual
Water use rights
  • open access (unorganized)
  • communal (organized)
  • leased
  • individual
Access to services and infrastructure
health

poor
good
education

poor
good
technical assistance

poor
good
employment (e.g. off-farm)

poor
good
markets

poor
good
energy

poor
good
roads and transport

poor
good
drinking water and sanitation

poor
good
financial services

poor
good

Impacts

Socio-economic impacts
Crop production
decreased
increased


The farmer observed increase of crop productivity in Mg per ha for the following plants: wheat, rape and maize. Grain yield of wheat under no-till vary from 8.8 to 11 t/ha. The yields are greater than those from average yield under conventional plough system.

crop quality
decreased
increased


The no-till technology increases crop quality by improving soil water retention.

risk of production failure
increased
decreased


The no-till technology decreases the risk of production failure due to greater yield stability.

land management
hindered
simplified


The no-till technology simplified land management by less intense machinery traffic on the field.

expenses on agricultural inputs
increased
decreased


The expenses on agricultural inputs in no-till technology are reduced due to lower fuel costs.

workload
increased
decreased


The workload in no-till technology decreases by lower number of agricultural practices.

Socio-cultural impacts
food security/ self-sufficiency
reduced
improved


The no-till technology improves the food security by increased yield stability.

SLM/ land degradation knowledge
reduced
improved


Land degradation knowledge is improved by the promotion of the no-till technology.

Ecological impacts
water quantity
decreased
increased


The water quantity increases in no-till technology due to less evaporation caused by crop residues on the surface of the soil.

water quality
decreased
increased


The water quality increases in no-till technology due to protection of soil against erosion and runoff.

harvesting/ collection of water (runoff, dew, snow, etc)
reduced
improved


The water collection in no-till technology is improved due to better infiltration of rainfall water through earthworms macropores open at the soil surface.

surface runoff
increased
decreased


The surface runoff in no-till technology decreased due to presence of crop residues on the field surface and open earthworms macropores increasing infiltration of rainfall water.

evaporation
increased
decreased


The no-till technology decreases evaporation due to crop residues on the soil surface.

soil moisture
decreased
increased


The no-till technology increases soil moisture by reduced evaporation due to crop residues on the soil surface and increasing soil organic matter content.

soil cover
reduced
improved


The no-till technology increases soil cover due to crop residues on the soil surface.

soil loss
increased
decreased


The no-till technology decreases soil loss due to reduced soil erosion and runoff.

soil accumulation
decreased
increased


The no-till technology increases soil accumulation due to increase of soil organic matter content.

soil crusting/ sealing
increased
reduced


The no-till technology reduces soil crusting and sealing by the presence of crop residuses and greater soil aggregates stability.

soil compaction
increased
reduced


The no-till technology reduces soil compaction due to greater bearing capacity of soil and due to less traffic on the soil.

nutrient cycling/ recharge
decreased
increased


The no-till technology increases nutrient cycling / recharge due to reduced surface runoff and associated nutrient losses and greated biodiversity.

soil organic matter/ below ground C
decreased
increased


The no-till technology increases soil soil organic matter content due to crop residues on the soil and less mineralization of organic matter.

acidity
increased
reduced

Quantity before SLM: 5.8
Quantity after SLM: 6.9
We observed increase of pH value (6.9) in no-till coil compared to conventionally tilled soil (5.8) that can be related with greater soil organic matter content in no-till soil.

vegetation cover
decreased
increased

biomass/ above ground C
decreased
increased


The farmer observed increase of crop productivity.

beneficial species (predators, earthworms, pollinators)
decreased
increased


We observed greater quantity of earthworms under no-till compared to the conventional tilled soil.

pest/ disease control
decreased
increased


Pest/disease control increased in no-till technology due to proper application of pesticides.

landslides/ debris flows
increased
decreased


The no-till technology decreases landslides/ debris flows by protection of soil against erosion and greater water storage. However, no landslides were not observed in the area.

emission of carbon and greenhouse gases
increased
decreased


The no-till technology desreases emission of carbon and greenhouse gases due to reduction of CO2 and other greenhouse gases realising by mechanical soil loosening.

Off-site impacts

Cost-benefit analysis

Benefits compared with establishment costs
Short-term returns
very negative
very positive

Long-term returns
very negative
very positive

Benefits compared with maintenance costs
Short-term returns
very negative
very positive

Long-term returns
very negative
very positive

Climate change

-

Adoption and adaptation

Percentage of land users in the area who have adopted the Technology
  • single cases/ experimental
  • 1-10%
  • 11-50%
  • > 50%
Of all those who have adopted the Technology, how many have done so without receiving material incentives?
  • 0-10%
  • 11-50%
  • 51-90%
  • 91-100%
Number of households and/ or area covered
The farmer covered about 700 ha by no-till technology.
Has the Technology been modified recently to adapt to changing conditions?
  • Ja
  • Nee
To which changing conditions?
  • climatic change/ extremes
  • changing markets
  • labour availability (e.g. due to migration)

Conclusions and lessons learnt

Strengths: land user's view
  • The increase of crop yield and production.
  • Prevention and reduction of erosion is widely observed under no-till.
  • Soil organic matter content increase is observed.
Strengths: compiler’s or other key resource person’s view
  • Soil structure improvement.
  • Decrease of environmental damage associated with soil inversion by ploughing.
Weaknesses/ disadvantages/ risks: land user's viewhow to overcome
  • Weed expansion Herbicides application
Weaknesses/ disadvantages/ risks: compiler’s or other key resource person’s viewhow to overcome
  • Plant diseases Fungicides application

References

Compiler
  • Magdalena Frac
Editors
Reviewer
  • Ursula Gaemperli
  • Gudrun Schwilch
  • Alexandra Gavilano
Date of documentation: Junie 29, 2017
Last update: Junie 14, 2019
Resource persons
Full description in the WOCAT database
Linked SLM data
Documentation was faciliated by
Institution Project
This work is licensed under Creative Commons Attribution-NonCommercial-ShareaAlike 4.0 International