Grass strips (South Africa)

Description

Combination of field demarcation and erosion protection by grass strips

Grass strips are left uncultivated to demarcate field boundaries. The width of the grass strips varies widely depending on the availability of land (distance from the village). No establishment is required. The group of fields is fenced off with wire fences (in close vicinity to town) or natural fencing using aloes and dead branches from thorn trees (for gap filling). The fence protects the crops and grass strip during summer. In winter the fields and grass strips are grazed.

Location

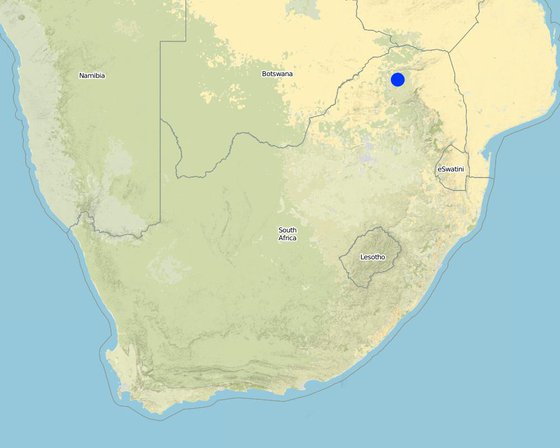
Location: Nebo and Central district, Limpopo Province, South Africa

No. of Technology sites analysed:

Geo-reference of selected sites
  • 29.30481, -23.39334

Spread of the Technology: evenly spread over an area (0.3 km²)

In a permanently protected area?:

Date of implementation: more than 50 years ago (traditional)

Type of introduction

Classification of the Technology

Main purpose
  • improve production
  • reduce, prevent, restore land degradation
  • conserve ecosystem
  • protect a watershed/ downstream areas – in combination with other Technologies
  • preserve/ improve biodiversity
  • reduce risk of disasters
  • adapt to climate change/ extremes and its impacts
  • mitigate climate change and its impacts
  • create beneficial economic impact
  • create beneficial social impact
Land use

  • Cropland
    • Annual cropping: cereals - maize, cereals - sorghum, fodder crops - grasses
    Number of growing seasons per year: 1
Water supply
  • rainfed
  • mixed rainfed-irrigated
  • full irrigation

Purpose related to land degradation
  • prevent land degradation
  • reduce land degradation
  • restore/ rehabilitate severely degraded land
  • adapt to land degradation
  • not applicable
Degradation addressed
  • soil erosion by water - Wt: loss of topsoil/ surface erosion, Wg: gully erosion/ gullying
  • chemical soil deterioration - Cn: fertility decline and reduced organic matter content (not caused by erosion)
  • water degradation - Ha: aridification
SLM group
  • area closure (stop use, support restoration)
  • improved ground/ vegetation cover
SLM measures
  • agronomic measures
  • vegetative measures - V2: Grasses and perennial herbaceous plants
  • management measures - M2: Change of management/ intensity level

Technical drawing

Technical specifications

Establishment and maintenance: activities, inputs and costs

Calculation of inputs and costs
  • Costs are calculated:
  • Currency used for cost calculation: USD
  • Exchange rate (to USD): 1 USD = n.a
  • Average wage cost of hired labour per day: 6.00
Most important factors affecting the costs
Materials Land preparation
Establishment activities
  1. Not required (Timing/ frequency: None)
  2. Fencing (Timing/ frequency: At establishment)
  3. Cultivation between grass strips (Timing/ frequency: Before planting (after first rains))
Establishment inputs and costs
Specify input Unit Quantity Costs per Unit (USD) Total costs per input (USD) % of costs borne by land users
Labour
Fencing persons/day/ha 8.33333 6.0 50.0 100.0
Equipment
Tools ha 1.0 10.0 10.0 100.0
Construction material
Wire ha 1.0 200.0 200.0 100.0
Total costs for establishment of the Technology 260.0
Total costs for establishment of the Technology in USD 260.0
Maintenance activities
  1. grazing /mainly cattle (Timing/ frequency: Winter /Once a year)
  2. close the fence (Timing/ frequency: None)
  3. plant maize (Timing/ frequency: None)
  4. Winter grazing (Timing/ frequency: After harvest / Once a year)
  5. Cultivation (Timing/ frequency: First rains / Once a year)
  6. Weeding (Timing/ frequency: / As needed)
Maintenance inputs and costs
Specify input Unit Quantity Costs per Unit (USD) Total costs per input (USD) % of costs borne by land users
Labour
Cultivation and weeding persons/day/ha 1.666666 6.0 10.0 100.0
Construction material
Wire ha 1.0 10.0 10.0 100.0
Total costs for maintenance of the Technology 20.0
Total costs for maintenance of the Technology in USD 20.0

Natural environment

Average annual rainfall
  • < 250 mm
  • 251-500 mm
  • 501-750 mm
  • 751-1,000 mm
  • 1,001-1,500 mm
  • 1,501-2,000 mm
  • 2,001-3,000 mm
  • 3,001-4,000 mm
  • > 4,000 mm
Agro-climatic zone
  • humid
  • sub-humid
  • semi-arid
  • arid
Specifications on climate
n.a.
Slope
  • flat (0-2%)
  • gentle (3-5%)
  • moderate (6-10%)
  • rolling (11-15%)
  • hilly (16-30%)
  • steep (31-60%)
  • very steep (>60%)
Landforms
  • plateau/plains
  • ridges
  • mountain slopes
  • hill slopes
  • footslopes
  • valley floors
Altitude
  • 0-100 m a.s.l.
  • 101-500 m a.s.l.
  • 501-1,000 m a.s.l.
  • 1,001-1,500 m a.s.l.
  • 1,501-2,000 m a.s.l.
  • 2,001-2,500 m a.s.l.
  • 2,501-3,000 m a.s.l.
  • 3,001-4,000 m a.s.l.
  • > 4,000 m a.s.l.
Technology is applied in
  • convex situations
  • concave situations
  • not relevant
Soil depth
  • very shallow (0-20 cm)
  • shallow (21-50 cm)
  • moderately deep (51-80 cm)
  • deep (81-120 cm)
  • very deep (> 120 cm)
Soil texture (topsoil)
  • coarse/ light (sandy)
  • medium (loamy, silty)
  • fine/ heavy (clay)
Soil texture (> 20 cm below surface)
  • coarse/ light (sandy)
  • medium (loamy, silty)
  • fine/ heavy (clay)
Topsoil organic matter content
  • high (>3%)
  • medium (1-3%)
  • low (<1%)
Groundwater table
  • on surface
  • < 5 m
  • 5-50 m
  • > 50 m
Availability of surface water
  • excess
  • good
  • medium
  • poor/ none
Water quality (untreated)
  • good drinking water
  • poor drinking water (treatment required)
  • for agricultural use only (irrigation)
  • unusable
Is salinity a problem?
  • Ja
  • Nee

Occurrence of flooding
  • Ja
  • Nee
Species diversity
  • high
  • medium
  • low
Habitat diversity
  • high
  • medium
  • low

Characteristics of land users applying the Technology

Market orientation
  • subsistence (self-supply)
  • mixed (subsistence/ commercial)
  • commercial/ market
Off-farm income
  • less than 10% of all income
  • 10-50% of all income
  • > 50% of all income
Relative level of wealth
  • very poor
  • poor
  • average
  • rich
  • very rich
Level of mechanization
  • manual work
  • animal traction
  • mechanized/ motorized
Sedentary or nomadic
  • Sedentary
  • Semi-nomadic
  • Nomadic
Individuals or groups
  • individual/ household
  • groups/ community
  • cooperative
  • employee (company, government)
Gender
  • women
  • men
Age
  • children
  • youth
  • middle-aged
  • elderly
Area used per household
  • < 0.5 ha
  • 0.5-1 ha
  • 1-2 ha
  • 2-5 ha
  • 5-15 ha
  • 15-50 ha
  • 50-100 ha
  • 100-500 ha
  • 500-1,000 ha
  • 1,000-10,000 ha
  • > 10,000 ha
Scale
  • small-scale
  • medium-scale
  • large-scale
Land ownership
  • state
  • company
  • communal/ village
  • group
  • individual, not titled
  • individual, titled
Land use rights
  • open access (unorganized)
  • communal (organized)
  • leased
  • individual
Water use rights
  • open access (unorganized)
  • communal (organized)
  • leased
  • individual
Access to services and infrastructure

Impacts

Socio-economic impacts
Crop production
decreased
x
increased


Reduce erosion, manner for grazing

fodder production
decreased
x
increased


Winter grazing with maize staple supplement

fodder quality
decreased
x
increased


Winter grazing with maize staple supplement

production area (new land under cultivation/ use)
decreased
x
increased


Loss of arable land in fenced–off-area

workload
increased
x
decreased


More labour for fencing

input constraints
increased
x
decreased


Higher fencing costs

Socio-cultural impacts
community institutions
weakened
x
strengthened


Relationships between neighbours in the fenced off area

Ecological impacts
soil moisture
decreased
x
increased

soil cover
reduced
x
improved

soil loss
increased
x
decreased

soil fertility
decreased
x
icreased

Off-site impacts
downstream siltation
increased
x
decreased

Cost-benefit analysis

Benefits compared with establishment costs
Short-term returns
very negative
x
very positive

Long-term returns
very negative
x
very positive

Benefits compared with maintenance costs
Short-term returns
very negative
x
very positive

Long-term returns
very negative
x
very positive

Climate change

-

Adoption and adaptation

Percentage of land users in the area who have adopted the Technology
  • single cases/ experimental
  • 1-10%
  • 11-50%
  • > 50%
Of all those who have adopted the Technology, how many have done so without receiving material incentives?
  • 0-10%
  • 11-50%
  • 51-90%
  • 91-100%
Number of households and/ or area covered
60 percent of stated area
Has the Technology been modified recently to adapt to changing conditions?
  • Ja
  • Nee
To which changing conditions?
  • climatic change/ extremes
  • changing markets
  • labour availability (e.g. due to migration)

Conclusions and lessons learnt

Strengths: land user's view
  • Land demarcation
  • Crop protection from grazing in summer
  • Additional grazing in winter
  • Manure input during grazing
Strengths: compiler’s or other key resource person’s view
  • Decrease run-off
  • Increased water harvesting on grass strips
Weaknesses/ disadvantages/ risks: land user's viewhow to overcome
Weaknesses/ disadvantages/ risks: compiler’s or other key resource person’s viewhow to overcome

References

Compiler
  • Andrei Rozanov
Editors
Reviewer
  • David Streiff
  • Alexandra Gavilano
Date of documentation: Jan. 26, 2011
Last update: Junie 20, 2019
Resource persons
Full description in the WOCAT database
Linked SLM data
Documentation was faciliated by
Institution Project
This work is licensed under Creative Commons Attribution-NonCommercial-ShareaAlike 4.0 International