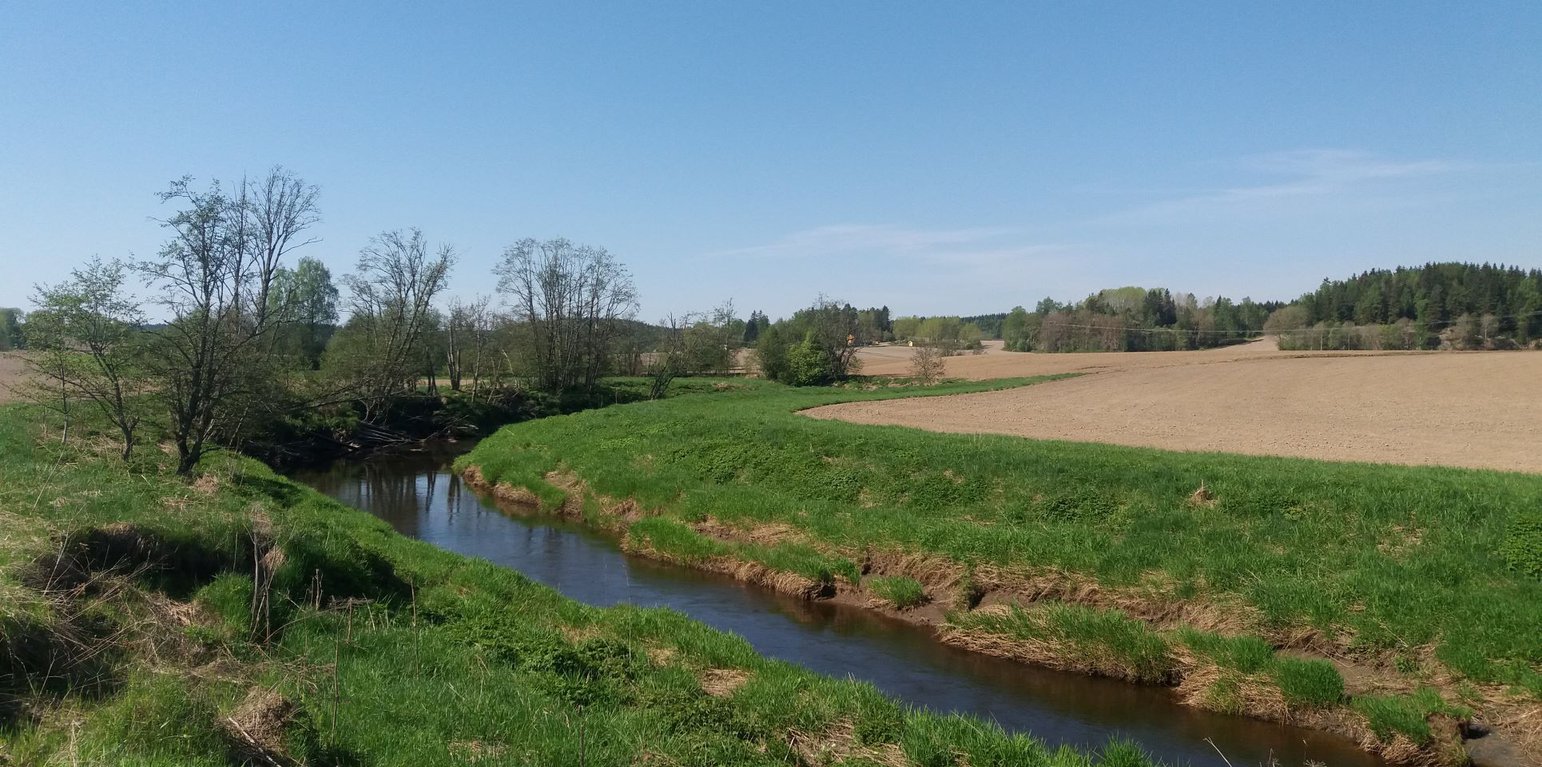
Buffer zones along the Hobøl River (Dominika Krzeminska)

Grass buffer zones alongside waterways in cropland (Norway)

Grasdekt buffersone

Description

Grass buffer zones are established along waterways in cropland to reduce the surface runoff rate, and the amounts of sediment, nutrients and pesticides in the runoff.

Commonly used names: buffer zones, buffer strips, riparian buffers

Purpose/aim: Vegetative buffers are areas of permanent vegetation located within and between agricultural fields and the watercourses to which they drain. The purpose of the vegetative buffer is to intercept, and reduce the rates of surface runoff and to reduce loads of sediment, nutrients and pesticide delivered to waterways. The processes involved are filtration, sedimentation, infiltration and absorption. Reducing the input of particles and nutrients into surface waterways is desirable both to improve water quality and to prevent eutrophication of downstream water bodies. In Norway, buffer zones are primarily established to reduce surface runoff of particles and phosphorus. However, vegetation in these zones can also serve other useful functions, such as protection against bank erosion, production of biomass, and/or provision of habitats for wildlife.

Establishment/maintenance activities:
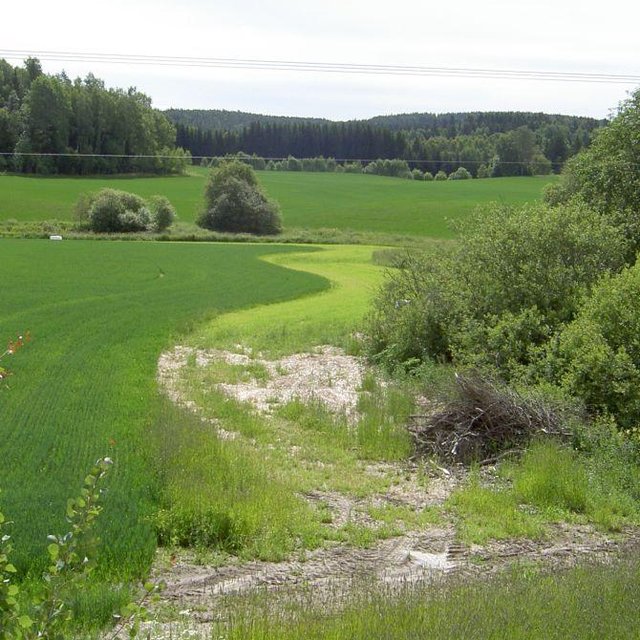
Buffer zones are most commonly designed to retain inputs of nutrients and particles from adjacent fields. Vegetative buffers may be constructed or naturally vegetated, within or alongside fields, or adjacent to drainage ditches, streams, lakes, ponds, and wetlands. The buffer zones may consist of grass for fodder production, or be natural vegetation composed of herbs, weeds, bushes and trees.

In Norway, farmers receive subsidies when the area is still used for production, e.g. grass production for fodder. Farmers leave a strip in cropland for grass and herbs to grow alongside rivers, streams and lakes that intersect their cropland areas. It is recommended to sow grass when establishing grass buffer zones. Robust and dense grass types with a high uptake of nutrients are often the best suited for the purpose. The grass strips should generally not be ploughed, fertilized or treated by herbicides, but some exceptions may be made. The degree to which the grass is harvested varies with the grass type and if it is valuable for livestock fodder.

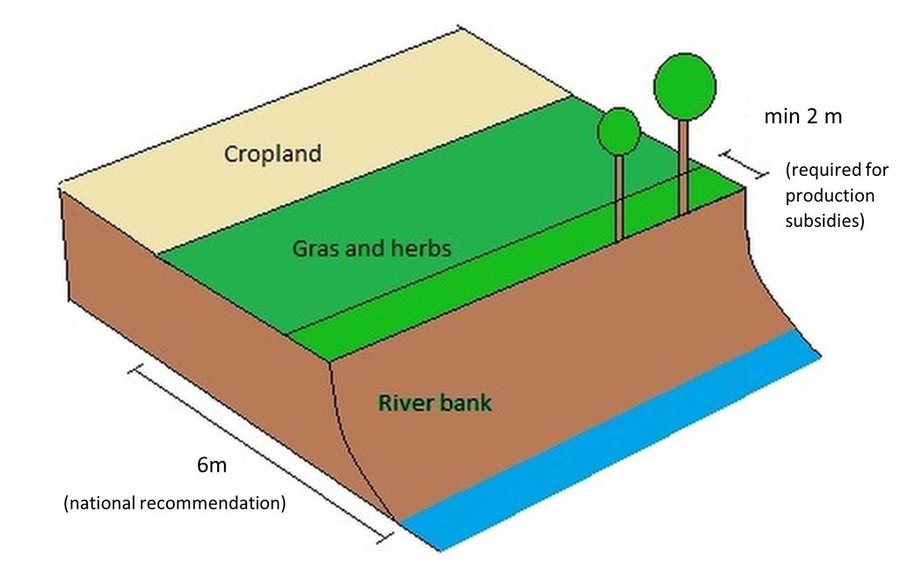
Buffer zones are one of the most common measures in Norway, and the requirements for the dimension of buffer zones have changed with time - and depend on the region. According to current regulations, buffer zones between the field and the watercourse have to be a minimum of 2 meters in order to qualify for production subsidies (PT-forskriften, § 4). In addition, there is a national recommendation (RMP) to maintain a minimum 6-metre wide buffer zone along all watercourses. However, regional guidelines (RMP) can differ from national ones and the width recommendation differ from county to county.

Benefits/impact: The effectiveness of buffer zones in retaining nutrients and soil particles has been explored by many authors. Retention capacity for phosphorus in buffer zones depends on several factors including vegetation, soil type, slope, hydrological conditions, and the width of the zone. There are large variations in the effectiveness of buffer zones: 32-91% retention of sediment, 26-100% retention of phosphorus and 0-100% retention of nitrogen. The retention effect of grass buffer zones along the Hobøl River, measured with rainfall simulation experiments under the BUFFERKLIMA project (Krzeminska et al., 2020), was: 86-94% for sediment, 86-86% for phosphorus and 78-89% for nitrogen.

Natural / human environment: The information about this Technology is based on investigations and/or reports from different part of Norway. For the purpose of the OPTAIN project, the technology is further presented in the natural and human environment context of the Kråkstad River catchment - a Norwegian Case Study catchment within the project.

The Kråkstad River is mainly situated in the Ski municipality in the South-Eastern part of Norway. The river catchment is a western tributary of the Vansjø-Hobøl watercourse, also known as the Morsa watercourse. The Kråkstad River catchment area is c. 51 km², 43% of which is agricultural land. Cereals are the major crop, produced on the heavy clays soils. The main environmental challenge in the area is water quality (incl. high phosphorus pollution) and soil erosion (incl. riverbank erosion and quick-clay landslides).The Morsa watercourse is a drinking water resource and there are specific environmental regulations for land management supported by subsidies through the Regional Environmental Programme (RMP).

Location

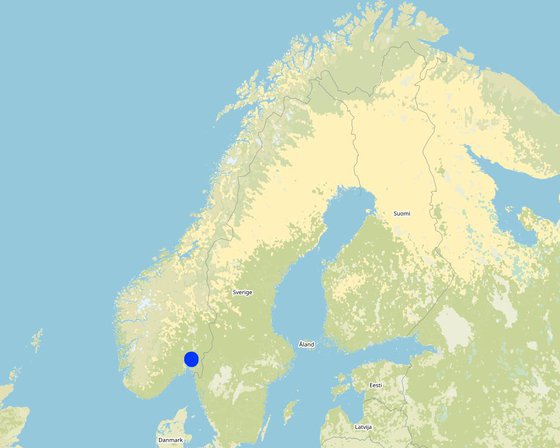
Location: The Vansjø - Hobøl catchment, Viken county, Norway

No. of Technology sites analysed: 2-10 sites

Geo-reference of selected sites
  • 10.888, 59.673
  • 10.91319, 59.60063
  • 10.89596, 59.59361
  • 10.87738, 59.62329
  • 10.88571, 59.6515
  • 10.88726, 59.66477

Spread of the Technology: evenly spread over an area (approx. 1-10 km2)

In a permanently protected area?: Nee

Date of implementation: 10-50 years ago

Type of introduction
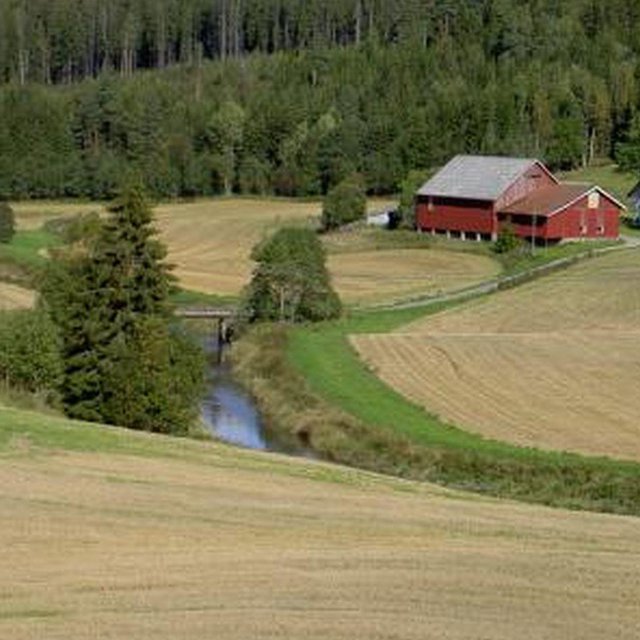
Example of grass covered buffer zones (Eva Skarbøvik)
Grass covered buffer zones along the Hobøl River (Eva Skarbøvik)

Classification of the Technology

Main purpose
  • improve production
  • reduce, prevent, restore land degradation
  • conserve ecosystem
  • protect a watershed/ downstream areas – in combination with other Technologies
  • preserve/ improve biodiversity
  • reduce risk of disasters
  • adapt to climate change/ extremes and its impacts
  • mitigate climate change and its impacts
  • create beneficial economic impact
  • create beneficial social impact
Land use

  • Cropland
    • Annual cropping: cereals - other, small grains
    Number of growing seasons per year: 1
  • Forest/ woodlandsProducts and services: Fuelwood

Water supply
  • rainfed
  • mixed rainfed-irrigated
  • full irrigation

Purpose related to land degradation
  • prevent land degradation
  • reduce land degradation
  • restore/ rehabilitate severely degraded land
  • adapt to land degradation
  • not applicable
Degradation addressed
  • soil erosion by water - Wt: loss of topsoil/ surface erosion, Wg: gully erosion/ gullying, Wm: mass movements/ landslides, Wr: riverbank erosion
  • water degradation - Hp: decline of surface water quality
SLM group
  • surface water management (spring, river, lakes, sea)
SLM measures
  • vegetative measures - V2: Grasses and perennial herbaceous plants

Technical drawing

Technical specifications
A technical drawing of a grass buffer zone - example setup based on the Norwegian recomendation

Technical knowledge required for field staff / advisors: low
Technical knowledge required for land users: low
Main technical functions: control of concentrated runoff: impede / retard

Secondary technical functions: control of raindrop splash, control of dispersed runoff: retain / trap, control of dispersed runoff: impede / retard, control of concentrated runoff: retain / trap, improvement of ground cover, increase of surface roughness, increase of infiltration, increase / maintain water stored in soil, improvement of water quality, buffering / filtering water, sediment retention / trapping, sediment harvesting

Aligned: -along boundary
Vegetative material: T : trees / shrubs

Vegetative measure: Along waterways
Vegetative material: G : grass

Trees/ shrubs species: Naturally
Grass species: Seeded
Author: Kamilla Skaalsveen

Establishment and maintenance: activities, inputs and costs

Calculation of inputs and costs
  • Costs are calculated: per Technology unit (unit: a buffer zone strip along the stream or lake volume, length: dimensions can vary greatly)
  • Currency used for cost calculation: Kroner (NOK)
  • Exchange rate (to USD): 1 USD = 8.89 Kroner (NOK)
  • Average wage cost of hired labour per day: c.a. 3000 NOK (it is only the cost of the time assuming 8h work per day, 320-500 NOK/hour; person; machinery, equipment, materials not included)
Most important factors affecting the costs
The costs of establishment and management of grass buffer zone are are the same as in case of regular crop land management. The subsidy is compensation for land withdrawn from the main production (crop land). Establishment and maintenance costs of buffer strip depends mostly on: - the area (width and continuity) of the buffer strip. - type of vegetation - possibility to use the grass as a fodder.
Establishment activities
  1. Plowing (Timing/ frequency: 1 time/yr)
  2. Harrowing (Timing/ frequency: 2-3 times/yr)
  3. Sowing grass (Timing/ frequency: 2-3 times/yr)
  4. Harvesting grass (Timing/ frequency: 2-3 times/yr)
Establishment inputs and costs (per a buffer zone strip along the stream or lake)
Specify input Unit Quantity Costs per Unit (Kroner (NOK)) Total costs per input (Kroner (NOK)) % of costs borne by land users
Labour
Ploughing zone/farmer/day 1.0 321.0 321.0 7.0
Harrowing zone/farmer/day 1.0 321.0 321.0 7.0
Sowing grass zone/farmer/day 1.0 321.0 321.0 7.0
Harvesting grass zone/farmer/day 1.0 321.0 321.0 7.0
Total costs for establishment of the Technology 1'284.0
Total costs for establishment of the Technology in USD 144.43
Maintenance activities
  1. Ploughing (Timing/ frequency: Every 5th year)
  2. Harrowing (Timing/ frequency: Every 5th year)
  3. Sowing grass (Timing/ frequency: Every 5th year)
  4. Harvesting grass (Timing/ frequency: 1-2 times/yr)
Maintenance inputs and costs (per a buffer zone strip along the stream or lake)
Specify input Unit Quantity Costs per Unit (Kroner (NOK)) Total costs per input (Kroner (NOK)) % of costs borne by land users
Labour
Ploughing zone/farmer/day 1.0 53.0 53.0
Harrowing zone/farmer/day 1.0 321.0 321.0
Sowing grass Day 1.0 321.0 321.0
Harvesting grass Day 1.0 321.0 321.0
Total costs for maintenance of the Technology 1'016.0
Total costs for maintenance of the Technology in USD 114.29

Natural environment

Average annual rainfall
  • < 250 mm
  • 251-500 mm
  • 501-750 mm
  • 751-1,000 mm
  • 1,001-1,500 mm
  • 1,501-2,000 mm
  • 2,001-3,000 mm
  • 3,001-4,000 mm
  • > 4,000 mm
Agro-climatic zone
  • humid
  • sub-humid
  • semi-arid
  • arid
Specifications on climate
Thermal climate class: temperate
Thermal climate class: boreal
Slope
  • flat (0-2%)
  • gentle (3-5%)
  • moderate (6-10%)
  • rolling (11-15%)
  • hilly (16-30%)
  • steep (31-60%)
  • very steep (>60%)
Landforms
  • plateau/plains
  • ridges
  • mountain slopes
  • hill slopes
  • footslopes
  • valley floors
Altitude
  • 0-100 m a.s.l.
  • 101-500 m a.s.l.
  • 501-1,000 m a.s.l.
  • 1,001-1,500 m a.s.l.
  • 1,501-2,000 m a.s.l.
  • 2,001-2,500 m a.s.l.
  • 2,501-3,000 m a.s.l.
  • 3,001-4,000 m a.s.l.
  • > 4,000 m a.s.l.
Technology is applied in
  • convex situations
  • concave situations
  • not relevant
Soil depth
  • very shallow (0-20 cm)
  • shallow (21-50 cm)
  • moderately deep (51-80 cm)
  • deep (81-120 cm)
  • very deep (> 120 cm)
Soil texture (topsoil)
  • coarse/ light (sandy)
  • medium (loamy, silty)
  • fine/ heavy (clay)
Soil texture (> 20 cm below surface)
  • coarse/ light (sandy)
  • medium (loamy, silty)
  • fine/ heavy (clay)
Topsoil organic matter content
  • high (>3%)
  • medium (1-3%)
  • low (<1%)
Groundwater table
  • on surface
  • < 5 m
  • 5-50 m
  • > 50 m
Availability of surface water
  • excess
  • good
  • medium
  • poor/ none
Water quality (untreated)
  • good drinking water
  • poor drinking water (treatment required)
  • for agricultural use only (irrigation)
  • unusable
Water quality refers to: both ground and surface water
Is salinity a problem?
  • Ja
  • Nee

Occurrence of flooding
  • Ja
  • Nee
Species diversity
  • high
  • medium
  • low
Habitat diversity
  • high
  • medium
  • low

Characteristics of land users applying the Technology

Market orientation
  • subsistence (self-supply)
  • mixed (subsistence/ commercial)
  • commercial/ market
Off-farm income
  • less than 10% of all income
  • 10-50% of all income
  • > 50% of all income
Relative level of wealth
  • very poor
  • poor
  • average
  • rich
  • very rich
Level of mechanization
  • manual work
  • animal traction
  • mechanized/ motorized
Sedentary or nomadic
  • Sedentary
  • Semi-nomadic
  • Nomadic
Individuals or groups
  • individual/ household
  • groups/ community
  • cooperative
  • employee (company, government)
Gender
  • women
  • men
Age
  • children
  • youth
  • middle-aged
  • elderly
Area used per household
  • < 0.5 ha
  • 0.5-1 ha
  • 1-2 ha
  • 2-5 ha
  • 5-15 ha
  • 15-50 ha
  • 50-100 ha
  • 100-500 ha
  • 500-1,000 ha
  • 1,000-10,000 ha
  • > 10,000 ha
Scale
  • small-scale
  • medium-scale
  • large-scale
Land ownership
  • state
  • company
  • communal/ village
  • group
  • individual, not titled
  • individual, titled
Land use rights
  • open access (unorganized)
  • communal (organized)
  • leased
  • individual
Water use rights
  • open access (unorganized)
  • communal (organized)
  • leased
  • individual
Access to services and infrastructure
health

poor
good
education

poor
good
technical assistance

poor
good
employment (e.g. off-farm)

poor
good
markets

poor
good
energy

poor
good
roads and transport

poor
good
drinking water and sanitation

poor
good
financial services

poor
good

Impacts

Socio-economic impacts
Crop production
decreased
increased

production area (new land under cultivation/ use)
decreased
increased


The grass (from buffer strips) is often unfit for fodder

farm income
decreased
increased


Despite subsidies, many farmers view grass buffer zones as a financial loss since the grass is often unfit for fodder.

diversity of income sources
decreased
increased

workload
increased
decreased

Socio-cultural impacts
Improved livelihoods and human well-being
decreased
increased


Because of the drinking water quality

Ecological impacts
water quality
decreased
increased


less sediment and nutrient input to surface water

soil cover
reduced
improved

soil loss
increased
decreased

soil compaction
increased
reduced

nutrient cycling/ recharge
decreased
increased

plant diversity
decreased
increased

beneficial species (predators, earthworms, pollinators)
decreased
increased

habitat diversity
decreased
increased

Off-site impacts
groundwater/ river pollution
increased
reduced

buffering/ filtering capacity (by soil, vegetation, wetlands)
reduced
improved

Cost-benefit analysis

Benefits compared with establishment costs
Short-term returns
very negative
very positive

Long-term returns
very negative
very positive

Benefits compared with maintenance costs
Short-term returns
very negative
very positive

Long-term returns
very negative
very positive

Climate change

Gradual climate change
annual temperature increase

not well at all
very well
annual rainfall increase

not well at all
very well
Climate-related extremes (disasters)
local rainstorm

not well at all
very well
local windstorm

not well at all
very well
drought

not well at all
very well
general (river) flood

not well at all
very well
Other climate-related consequences
reduced growing period

not well at all
very well

Adoption and adaptation

Percentage of land users in the area who have adopted the Technology
  • single cases/ experimental
  • 1-10%
  • 11-50%
  • > 50%
Of all those who have adopted the Technology, how many have done so without receiving material incentives?
  • 0-10%
  • 11-50%
  • 51-90%
  • 91-100%
Has the Technology been modified recently to adapt to changing conditions?
  • Ja
  • Nee
To which changing conditions?
  • climatic change/ extremes
  • changing markets
  • labour availability (e.g. due to migration)

Conclusions and lessons learnt

Strengths: land user's view
  • Probably good for the environment
Strengths: compiler’s or other key resource person’s view
  • The grass captures sediments and nutrients from the cropland

    How can they be sustained / enhanced? May be more efficient with a change in grass type (but this has not been not tested)
  • Reduced fertilizer usage

    How can they be sustained / enhanced? Continue in the same way
  • Co-operation between farmers

    How can they be sustained / enhanced? Joint utilization of the buffer strips for grass production
Weaknesses/ disadvantages/ risks: land user's viewhow to overcome
  • Loss of productive cropland Narrower buffer strips
  • Not always good for the farm economy Review the subsidies scheme
  • Doubts about the effectiveness of the technology (infiltration and stream bank erosion)
Weaknesses/ disadvantages/ risks: compiler’s or other key resource person’s viewhow to overcome
  • Low infiltration rates Less heavy machinery on the buffer strips and a wider zone of natural vegetation along the banks

References

Compiler
  • Kamilla Skaalsveen
Editors
  • Anne-Grete Buseth Blankenberg
  • Dominika Krzeminska
  • Zhanguo Bai
Reviewer
  • Rima Mekdaschi Studer
  • William Critchley
Date of documentation: Aug. 13, 2014
Last update: Feb. 3, 2023
Resource persons
Full description in the WOCAT database
Linked SLM data
Documentation was faciliated by
Institution Project
Key references
  • Blankenberg, A-G.B., Skarbøvik E., 2020. Phosphorus retention, erosion protection and farmers’ perceptions of riparian buffer zones with grass and natural vegetation: Case studies from South-Eastern Norway.: Ambio
  • Krzeminska D, Blankenberg A‐G, Bøe F, Nemes A, Skarbøvik E. 2020.Renseeffekt og kanterosjon i kantsoner med forskjellig vegetasjonstype.: NIBIO website
  • Blankenberg, A-G.B., Skarbøvik E., Kværnø S. 2017. Effekt av buffersoner ‐ på vannmiljø og andre økosystemtjenester.: NIBIO website
Links to relevant information which is available online
This work is licensed under Creative Commons Attribution-NonCommercial-ShareaAlike 4.0 International