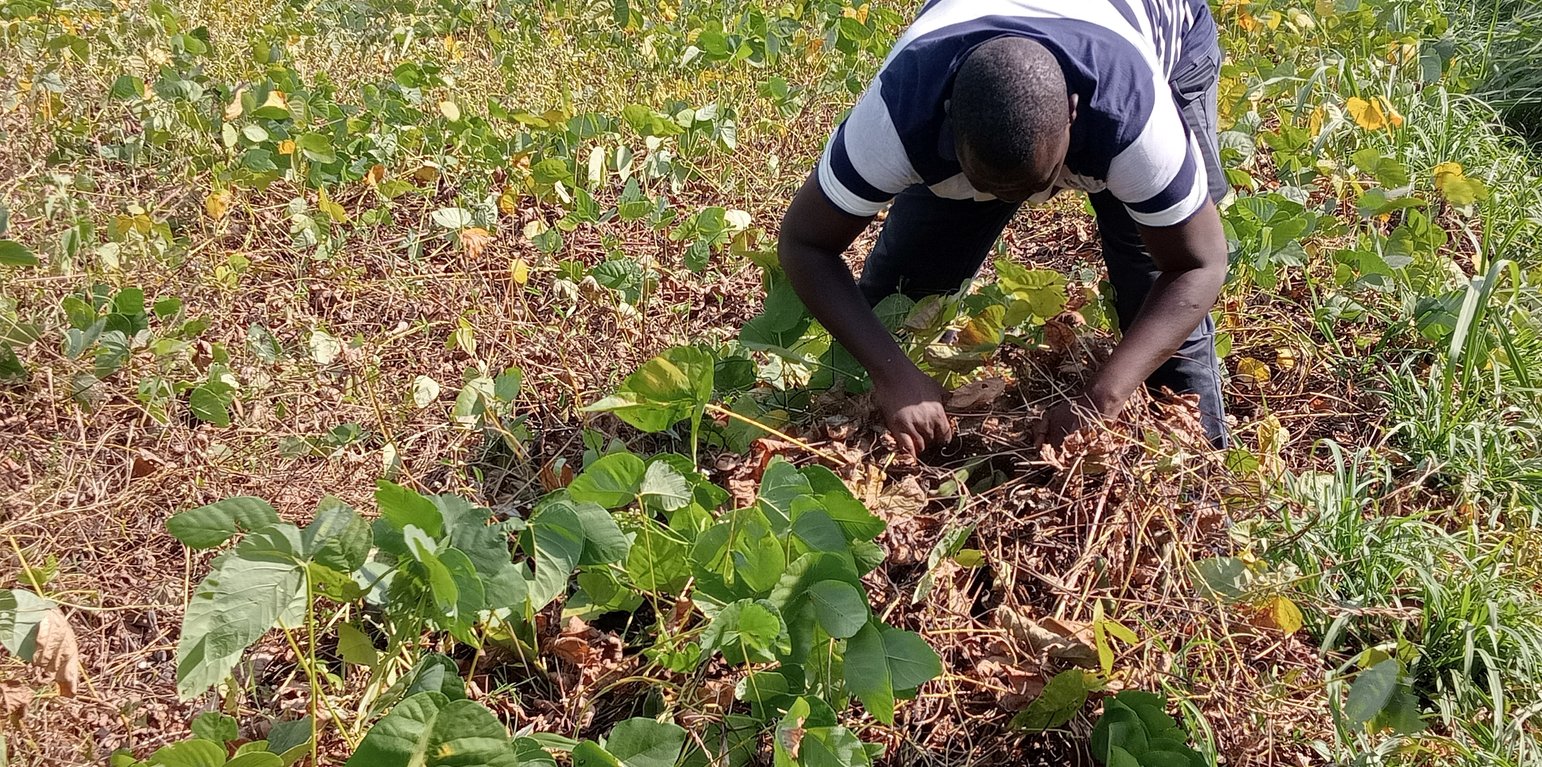
A farm under a mucuna (velvet bean) cover crop (William Akwanyi)

Permanent soil cover (Kenya)

Description

Permanent soil cover with cover crops and/or crop residues helps to control soil erosion, suppress weeds and build up soil fertility. It can also add organic matter to the soil.

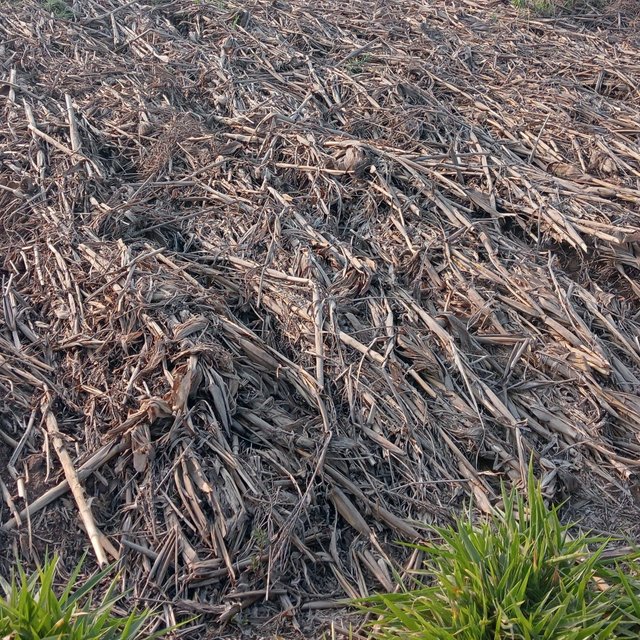
Permanent soil cover is having all-year-round cover on the soil. This can be either in the form of cover crops which are either planted with other crops at the same time, or relay planted later in the season after the main crops have established, or in the form of crop residues (mulch) which is naturally decomposed by microbes. Permanent soil cover provides a shield or umbrella to the soil protecting it from the heat of the sun and the impact of rain. It makes up a fundamental component of conservation agriculture where minimum tillage reduces soil disturbance.

Some of the crops used for permanent soil cover [those promoted by the ProSoil project] include Mucuna pruriens (velvet bean), Canavalia ensiformis, Dolichos lablab, and Desmodium intortum. All of these are legumes, which fix nitrogen from the atmosphere, thus improving soil fertility. In choosing a cover crop, farmers prefer those that fit into their normal cropping systems, and which have multiple purposes, including those that produce edible seeds and vegetables, those that improve soil fertility, those that can be used as animal fodder, and those that can suppress weeds. Some farmers prefer crops that can provide firewood or fencing material and those that can be used for medicinal purposes. Another important factor that farmers consider when choosing a cover crop is the amount and type of work that the cover crop will need, for example for land preparation before planting, weeding, and producing and harvesting the seeds. The crops most preferred are those that cover the soil quickly and completely, and which can also be used for food and fodder, including mucuna. Farmers also like mucuna because of its big pods and grains that are easier to deal with. Farmers can easily multiply mucuna seeds since they do not require complicated treatments; hence, do not need to continue spending money on the seeds.

In establishing a permanent soil cover using cover crops, farmers first intercrop seasonal crops (e.g., maize and beans) and later introduce a green manure cover crop (e.g., mucuna) after about 6 weeks (or at the time when the beans start to produce pods) to ensure that the green manure cover crop does not suppress the main crop(s). The maize is planted at 75 cm row spacing and 25 cm between plants in the same row. However, within each row, the third hole/ space is left for the cover crop (i.e., mucuna). Thus, mucuna is planted after every three maize plants in the same row. The bean intercrop is planted between the maize rows at the spacing of 37.5 cm from the maize row and 20 cm between bean plants in the same row. This spacing requires about 5 kg of cover crop (mucuna) seeds per acre. The crops continue to grow together and upon harvesting the main crops, the cover crop continues to grow on the farm covering the soil until the following cropping season.

Permanent soil cover is beneficial in the farm in various ways including, enhancing soil water infiltration, protecting soil from agents of erosion, increasing soil organic matter, suppressing weeds, aiding in nutrient cycling, and improving the habitat of soil micro- and macro-organisms. Maintaining permanent soil cover through mulching faces some limitations, including competing uses of crop residues e.g., as animal feeds and fuel. Similarly, drought may be a major limitation to maintaining permanent soil cover using cover crops, especially in areas that receive very low rainfall and where the farmer has not invested in irrigation.

Location

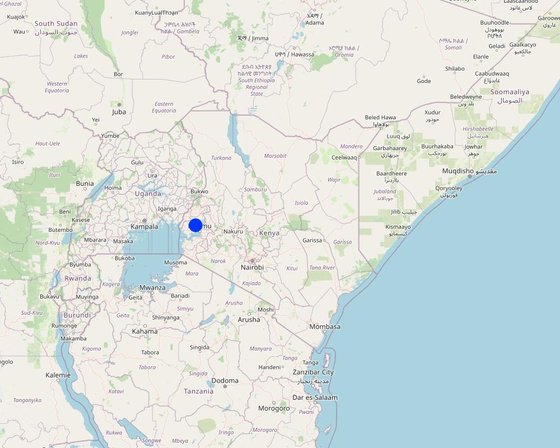
Location: Kisa Central Ward in Khwisero Sub-county; and Koyonzo and Khalaba wards in Matungu Sub-county, Kakamega County in western Kenya, Kenya

No. of Technology sites analysed: 2-10 sites

Geo-reference of selected sites
  • 34.58472, 0.14269

Spread of the Technology: evenly spread over an area

In a permanently protected area?: Nee

Date of implementation: 2021

Type of introduction
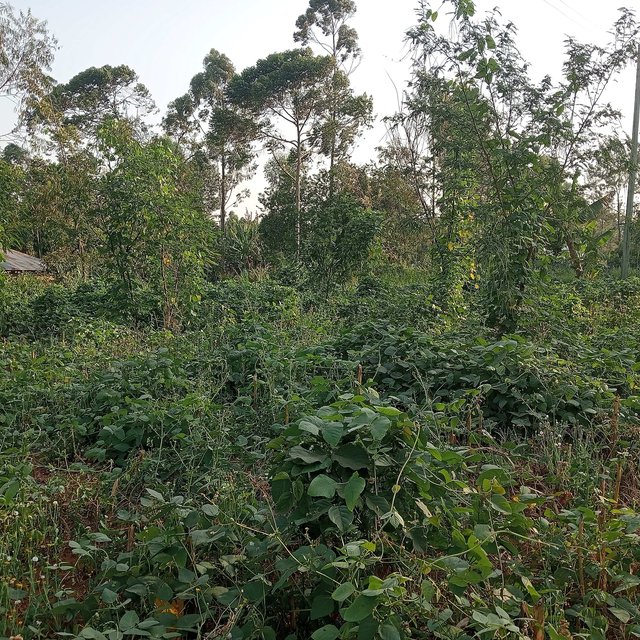
Mucuna cover crop after the main crop (maize) has been harvested (William Akwanyi)
Mulching using maize stover (William Onura)

Classification of the Technology

Main purpose
  • improve production
  • reduce, prevent, restore land degradation
  • conserve ecosystem
  • protect a watershed/ downstream areas – in combination with other Technologies
  • preserve/ improve biodiversity
  • reduce risk of disasters
  • adapt to climate change/ extremes and its impacts
  • mitigate climate change and its impacts
  • create beneficial economic impact
  • create beneficial social impact
Land use
Land use mixed within the same land unit: Ja - Agro-silvopastoralism

  • Cropland
    • Annual cropping: fodder crops - other, fodder crops - grasses, cereals - maize, vegetables - other, vegetables - melon, pumpkin, squash or gourd, legumes and pulses - beans. Cropping system: Maize/sorghum/millet intercropped with legume
    • Perennial (non-woody) cropping: banana/plantain/abaca, fodder crops - grasses, fodder crops - legumes, clover
    • Tree and shrub cropping: fodder trees (Calliandra, Leucaena leucocephala, Prosopis, etc.), avocado, fruits, other, mango, mangosteen, guava, papaya
    Number of growing seasons per year: 2
    Is intercropping practiced? Ja
    Is crop rotation practiced? Ja
  • Grazing land
    • Cut-and-carry/ zero grazing
    • Improved pastures
    Animal type: cattle - dairy, cattle - dairy and beef (e.g. zebu), poultry
    Is integrated crop-livestock management practiced? Ja
    Products and services: economic security, investment prestige, milk, manure as fertilizer/ energy production, eggs, meat
      SpeciesCount
      cattle - dairy1
      cattle - dairy and beef (e.g. zebu)2
      poultry20
    Water supply
    • rainfed
    • mixed rainfed-irrigated
    • full irrigation

    Purpose related to land degradation
    • prevent land degradation
    • reduce land degradation
    • restore/ rehabilitate severely degraded land
    • adapt to land degradation
    • not applicable
    Degradation addressed
    • soil erosion by water - Wt: loss of topsoil/ surface erosion
    • soil erosion by wind - Et: loss of topsoil
    • chemical soil deterioration - Cn: fertility decline and reduced organic matter content (not caused by erosion)
    • physical soil deterioration - Pc: compaction
    • biological degradation - Bc: reduction of vegetation cover, Bs: quality and species composition/ diversity decline
    • water degradation - Ha: aridification
    SLM group
    • improved ground/ vegetation cover
    • minimal soil disturbance
    • integrated soil fertility management
    SLM measures
    • agronomic measures - A1: Vegetation/ soil cover, A2: Organic matter/ soil fertility, A3: Soil surface treatment (A 3.1: No tillage), A6: Residue management (A 6.4: retained)

    Technical drawing

    Technical specifications
    Maize/ mucuna spacing: row to row = 75 cm, plant to plant in the same row = 25 cm, mucuna planted in every third hole/ space in the same row
    Bean spacing: bean rows between the maize/ mucuna rows, bean row to maize/ mucuna row = 37.5 cm, plant to plant in the same row = 20 cm
    Author: William Akwanyi

    Establishment and maintenance: activities, inputs and costs

    Calculation of inputs and costs
    • Costs are calculated: per Technology area (size and area unit: 1 acre)
    • Currency used for cost calculation: KES
    • Exchange rate (to USD): 1 USD = 124.21 KES
    • Average wage cost of hired labour per day: KES 250.00
    Most important factors affecting the costs
    Rate of man-days vary from one place to another, farmer to farmer, and with type of work. Exchange rate for February 2023, source: European Commission/ InfoEuro online at https://commission.europa.eu/funding-tenders/procedures-guidelines-tenders/information-contractors-and-beneficiaries/exchange-rate-inforeuro_en
    Establishment activities
    n.a.
    Maintenance activities
    1. Land preparation (Timing/ frequency: Before rains)
    2. Planting (Timing/ frequency: After rains)
    3. Shallow weeding (Timing/ frequency: During the second weeding of the main crop at 1.5 months)
    4. Uncoiling (e.g., mucuna from the main crop) (Timing/ frequency: Bi-weekly)
    Maintenance inputs and costs (per 1 acre)
    Specify input Unit Quantity Costs per Unit (KES) Total costs per input (KES) % of costs borne by land users
    Labour
    Slashing Man-days 5.0 250.0 1250.0 100.0
    Sub-soiling Man-days 10.0 250.0 2500.0 100.0
    Planting Man-days 4.0 250.0 1000.0 100.0
    Shallow weeding and uncoiling (e.g., mucuna from the main crop) Man-days 9.0 250.0 2250.0 100.0
    Equipment
    Slasher No. 1.0 70.0 70.0
    Hand-held sub-soiler No. 1.0 70.0 70.0
    Jab planter No. 1.0 1000.0 1000.0
    Shallow weeder No. 1.0 80.0 80.0
    Plant material
    Cover crop seeds Kgs 5.0 150.0 750.0
    Total costs for maintenance of the Technology 8'970.0
    Total costs for maintenance of the Technology in USD 72.22

    Natural environment

    Average annual rainfall
    • < 250 mm
    • 251-500 mm
    • 501-750 mm
    • 751-1,000 mm
    • 1,001-1,500 mm
    • 1,501-2,000 mm
    • 2,001-3,000 mm
    • 3,001-4,000 mm
    • > 4,000 mm
    Agro-climatic zone
    • humid
    • sub-humid
    • semi-arid
    • arid
    Specifications on climate
    Average annual rainfall in mm: 1300.0
    Monthly rainfall variability is high with some months such as January recording less than 5 mm of total rainfall.
    Name of the meteorological station: Kakamega Meteorological Station
    The climate in the area favours most agricultural activities.
    Slope
    • flat (0-2%)
    • gentle (3-5%)
    • moderate (6-10%)
    • rolling (11-15%)
    • hilly (16-30%)
    • steep (31-60%)
    • very steep (>60%)
    Landforms
    • plateau/plains
    • ridges
    • mountain slopes
    • hill slopes
    • footslopes
    • valley floors
    Altitude
    • 0-100 m a.s.l.
    • 101-500 m a.s.l.
    • 501-1,000 m a.s.l.
    • 1,001-1,500 m a.s.l.
    • 1,501-2,000 m a.s.l.
    • 2,001-2,500 m a.s.l.
    • 2,501-3,000 m a.s.l.
    • 3,001-4,000 m a.s.l.
    • > 4,000 m a.s.l.
    Technology is applied in
    • convex situations
    • concave situations
    • not relevant
    Soil depth
    • very shallow (0-20 cm)
    • shallow (21-50 cm)
    • moderately deep (51-80 cm)
    • deep (81-120 cm)
    • very deep (> 120 cm)
    Soil texture (topsoil)
    • coarse/ light (sandy)
    • medium (loamy, silty)
    • fine/ heavy (clay)
    Soil texture (> 20 cm below surface)
    • coarse/ light (sandy)
    • medium (loamy, silty)
    • fine/ heavy (clay)
    Topsoil organic matter content
    • high (>3%)
    • medium (1-3%)
    • low (<1%)
    Groundwater table
    • on surface
    • < 5 m
    • 5-50 m
    • > 50 m
    Availability of surface water
    • excess
    • good
    • medium
    • poor/ none
    Water quality (untreated)
    • good drinking water
    • poor drinking water (treatment required)
    • for agricultural use only (irrigation)
    • unusable
    Water quality refers to: both ground and surface water
    Is salinity a problem?
    • Ja
    • Nee

    Occurrence of flooding
    • Ja
    • Nee
    Species diversity
    • high
    • medium
    • low
    Habitat diversity
    • high
    • medium
    • low

    Characteristics of land users applying the Technology

    Market orientation
    • subsistence (self-supply)
    • mixed (subsistence/ commercial)
    • commercial/ market
    Off-farm income
    • less than 10% of all income
    • 10-50% of all income
    • > 50% of all income
    Relative level of wealth
    • very poor
    • poor
    • average
    • rich
    • very rich
    Level of mechanization
    • manual work
    • animal traction
    • mechanized/ motorized
    Sedentary or nomadic
    • Sedentary
    • Semi-nomadic
    • Nomadic
    Individuals or groups
    • individual/ household
    • groups/ community
    • cooperative
    • employee (company, government)
    Gender
    • women
    • men
    Age
    • children
    • youth
    • middle-aged
    • elderly
    Area used per household
    • < 0.5 ha
    • 0.5-1 ha
    • 1-2 ha
    • 2-5 ha
    • 5-15 ha
    • 15-50 ha
    • 50-100 ha
    • 100-500 ha
    • 500-1,000 ha
    • 1,000-10,000 ha
    • > 10,000 ha
    Scale
    • small-scale
    • medium-scale
    • large-scale
    Land ownership
    • state
    • company
    • communal/ village
    • group
    • individual, not titled
    • individual, titled
    Land use rights
    • open access (unorganized)
    • communal (organized)
    • leased
    • individual
    Water use rights
    • open access (unorganized)
    • communal (organized)
    • leased
    • individual
    Access to services and infrastructure
    health

    poor
    x
    good
    education

    poor
    x
    good
    technical assistance

    poor
    x
    good
    employment (e.g. off-farm)

    poor
    x
    good
    markets

    poor
    x
    good
    energy

    poor
    x
    good
    roads and transport

    poor
    x
    good
    financial services

    poor
    x
    good
    Comments

    The above rating varies from one village to the other.

    Impacts

    Socio-economic impacts
    Crop production
    decreased
    x
    increased

    Quantity before SLM: Less than 3
    Quantity after SLM: More than 7
    Quantity refers to the number of 90 Kg bags of maize produced per acre. Based on the farmer's estimate.

    crop quality
    decreased
    x
    increased


    Not easy to quantify. The crops do better compared to how they could do in the past, yet he does not use inorganic fertilizers. Based on the farmer's estimate.

    fodder production
    decreased
    x
    increased

    Quantity before SLM: 2
    Quantity after SLM: 5
    Quantity refers to harvesting cycles per year for nappier grass from the same farm. Based on the farmer's estimate.

    fodder quality
    decreased
    x
    increased


    Not easy to quantify. Fodder does better compared to how it was before the technology. Based on the farmer's estimate.

    animal production
    decreased
    x
    increased

    Quantity before SLM: 2
    Quantity after SLM: 5
    Quantity refers to the amount of milk in litres from one cow. Based on the farmer's estimate.

    risk of production failure
    increased
    x
    decreased

    Quantity before SLM: 70
    Quantity after SLM: 40
    Quantity refers to the percentage probability of the crop failing to do well. Based on the farmer's estimate.

    land management
    hindered
    x
    simplified


    Not easy to quantify but it is easier to prepare land through no tillage than to plough.

    expenses on agricultural inputs
    increased
    x
    decreased

    Quantity before SLM: 10,000
    Quantity after SLM: 0
    Quantity refers to the amount of money in Kenya shillings spend on inorganic fertilizers in a season. The farmer no longer buys money inorganic fertilizers. Based on the farmer's experience.

    diversity of income sources
    decreased
    x
    increased

    Quantity before SLM: 2
    Quantity after SLM: 3
    Quantity refers to the number of household income sources.

    workload
    increased
    x
    decreased


    Not easy to quantify but it is easier to prepare land through no tillage than to plough.

    Socio-cultural impacts
    food security/ self-sufficiency
    reduced
    x
    improved

    Quantity before SLM: 3
    Quantity after SLM: 1
    Quantity refers to the number of months in a year when there is total lack of food in the house, and the farmer has to buy all the food required in the house. Based on the farmer's estimate.

    SLM/ land degradation knowledge
    reduced
    x
    improved


    Refers to the estimated percentage of knowledge in SLM/ land management. Based on the farmer's estimate. His knowledge in SLM has greatly increased.

    Ecological impacts
    soil moisture
    decreased
    x
    increased


    Refers to the farmer's estimated soil moisture content during the dry season when soil moisture challenges are expected to be high.

    soil cover
    reduced
    x
    improved

    Quantity before SLM: 40
    Quantity after SLM: 60
    Quantity refers to the farmer's estimated percentage soil cover at the farm.

    soil loss
    increased
    x
    decreased


    Not easy for the farmer to quantify. According to him, soil erosion has reduced.

    soil accumulation
    decreased
    x
    increased


    Not easy for the farmer to quantify. Based on the farmer's estimate.

    nutrient cycling/ recharge
    decreased
    x
    increased


    Not easy for the farmer to quantify. Based on the farmer's estimate.

    soil organic matter/ below ground C
    decreased
    x
    increased


    Not easy to quantify as there is no data. Based on the farmer's estimate.

    vegetation cover
    decreased
    x
    increased

    Quantity before SLM: 30
    Quantity after SLM: 60
    Quantity refers to the farmer's estimated percentage vegetation cover at the farm.

    biomass/ above ground C
    decreased
    x
    increased


    Not easy for the farmer to quantify. Based on the farmer's estimate.

    plant diversity
    decreased
    x
    increased

    Quantity before SLM: 4
    Quantity after SLM: 11
    Quantity refers to the number of plants (crops) that the farmer establishes at the farm. Based on the farmer's estimate.

    invasive alien species
    increased
    x
    reduced

    Quantity before SLM: 6
    Quantity after SLM: 4
    Quality refers to the number of species of weeds and invasive plants at the farm. Based on the farmer's estimate.

    habitat diversity
    decreased
    x
    increased


    Not easy for the farmer to quantify. Based on the farmer's estimate.

    Off-site impacts
    buffering/ filtering capacity (by soil, vegetation, wetlands)
    reduced
    x
    improved


    No recorded data is available for reference. All are estimates based on the farmer's explanation or as given by him.

    Cost-benefit analysis

    Benefits compared with establishment costs
    Short-term returns
    very negative
    x
    very positive

    Long-term returns
    very negative
    x
    very positive

    Benefits compared with maintenance costs
    Short-term returns
    very negative
    x
    very positive

    Long-term returns
    very negative
    x
    very positive

    Climate change

    Gradual climate change
    annual temperature increase

    not well at all
    x
    very well
    seasonal temperature increase

    not well at all
    x
    very well
    Season: dry season

    Adoption and adaptation

    Percentage of land users in the area who have adopted the Technology
    • single cases/ experimental
    • 1-10%
    • 11-50%
    • > 50%
    Of all those who have adopted the Technology, how many have done so without receiving material incentives?
    • 0-10%
    • 11-50%
    • 51-90%
    • 91-100%
    Has the Technology been modified recently to adapt to changing conditions?
    • Ja
    • Nee
    To which changing conditions?
    • climatic change/ extremes
    • changing markets
    • labour availability (e.g. due to migration)

    Conclusions and lessons learnt

    Strengths: land user's view
    • Improves fertility at the farm, especially when nitrogen-fixing cover crops are used.
    • Reduces cost of labour i.e., no need to plough under conservation agriculture.
    Strengths: compiler’s or other key resource person’s view
    • Plant cover contributes to carbon sequestration.
    • Conserves soil moisture and protects soil resulting in increased yields.
    Weaknesses/ disadvantages/ risks: land user's viewhow to overcome
    • Some cover crops such as mucuna suppress other crops. Regular checking to remove mucuna that attempts to coil on other crops.
    Weaknesses/ disadvantages/ risks: compiler’s or other key resource person’s viewhow to overcome

    References

    Compiler
    • William Akwanyi
    Editors
    • Innocent Faith
    • Noel Templer
    • Leah Munala
    • Tabitha Nekesa
    • Ahmadou Gaye
    • Siagbé Golli
    Reviewer
    • William Critchley
    • Rima Mekdaschi Studer
    • Sally Bunning
    Date of documentation: Maart 18, 2023
    Last update: April 30, 2024
    Resource persons
    Full description in the WOCAT database
    Linked SLM data
    Documentation was faciliated by
    Institution Project
    This work is licensed under Creative Commons Attribution-NonCommercial-ShareaAlike 4.0 International