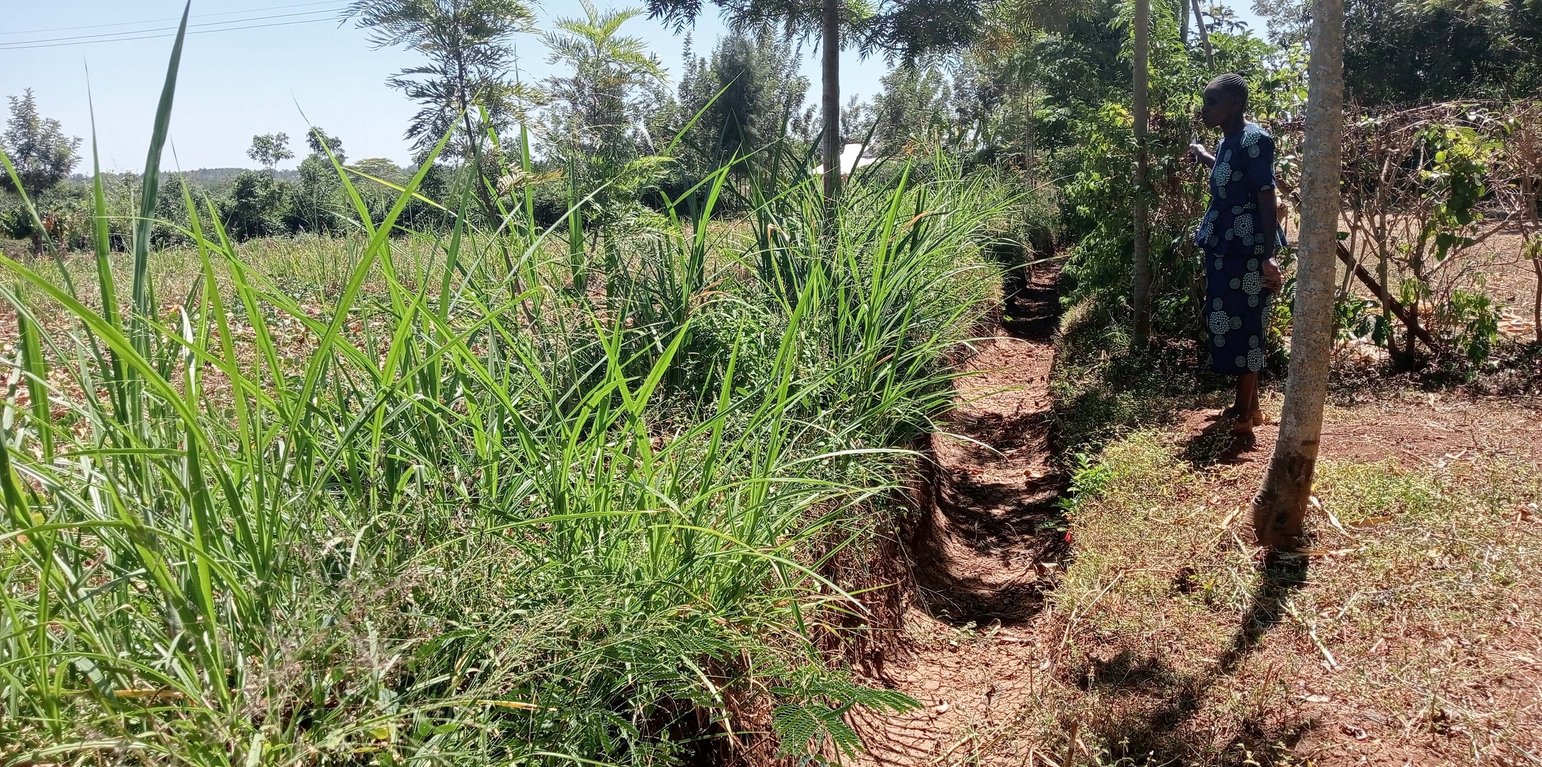
A retention ditch dug to collect surface runoff (William Akwanyi)

Retention ditches for soil and water conservation (Kenya)

Mitaro ya kuhifadhi maji (Kiswahili)

Description

Retention ditches are channels aligned along the contour which are designed for surface runoff management. They improve water infiltration into the ground and prevent soil erosion.

Retention ditches are soil and water conservation practices. They are channels dug along contours (i.e., across the slope), especially at the uppermost part of the farm to retain stormwater/ surface runoff. They typically comprise two components: (a) vegetational-biological and (b) mechanical-structural components which are integrated to collect surface runoff, allowing for sediment carried by runoff to settle as water infiltrates into the ground. The mechanical-structural component consists of channels dug in such a way that they follow the contour and run perpendicular to the flow of water in areas where runoff naturally flows or collects. The soil excavated from the ditch forms a bund below the ditch. Retention ditches prevent surface runoff from outside the farm from flowing into or through the farm. The vegetational-biological component consists of plants grown on the bunds. The plant roots bind the soil thus increasing the slope stability, especially of the bunds; thus, preventing soil from collapsing and falling back into the channel. Retention ditches thus harvest and retain water (especially in low rainfall areas) preventing fertile soil from being washed away by surface runoff and increasing water availability for plants. In high-rainfall areas, they play the role of discharging excessive runoff into waterways.

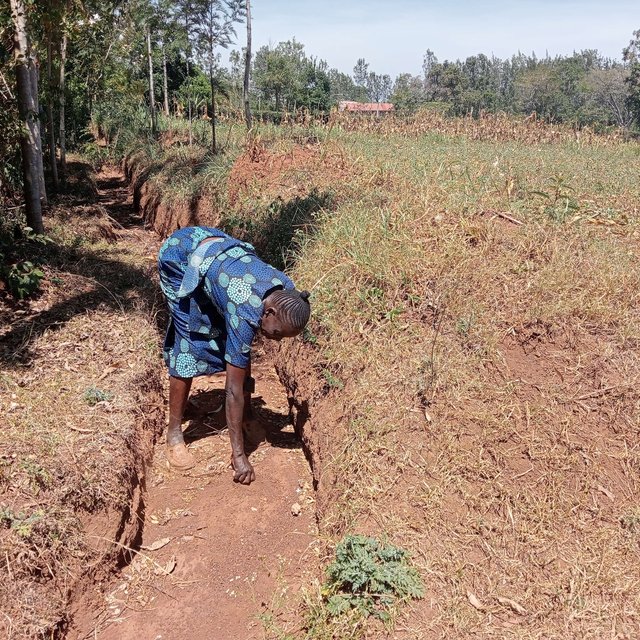
Retention ditches are dug to about 60 cm deep and about 50 cm wide. To ensure stability, especially in areas with unstable soils, the top width is made wider than the bottom width allowing for slanting walls that are more stable than vertical walls. An understanding of the slope angle is an important factor in the designing and construction of retention ditches. A line-level (a spirit level attached to a string suspended between two poles) can be used to determine the measure slope. The slope angle determines the size of the ditch (depth and width) and the spacing between successive ditches on the same piece of land. In low-rainfall areas (such as Siaya), retention ditches are spaced at about 50 – 70 m while in high-rainfall areas the space between the ditches are closer (about 20 m). Similarly, the size of the retention ditches increases with increasing slope.

Some crops, especially bananas, arrowroot, etc. that demand a lot of water can be established in the ditches. Maintenance of retention ditches involves regular desilting, whenever the ditch is about 1/3 filled with silt. Hoes, shovels/ spades, and a panga (machete) are some of the tools used in digging and maintaining retention ditches. Farmers like retention ditches because they help in controlling soil erosion.

Location

Location: Uloma Village, Bondo Municipality, Bondo Sub-county, Siaya County, Nyanza Region, Kenya

No. of Technology sites analysed: single site

Geo-reference of selected sites
  • 34.25235, -0.05657

Spread of the Technology: evenly spread over an area (approx. < 0.1 km2 (10 ha))

In a permanently protected area?: Nee

Date of implementation: 2018

Type of introduction
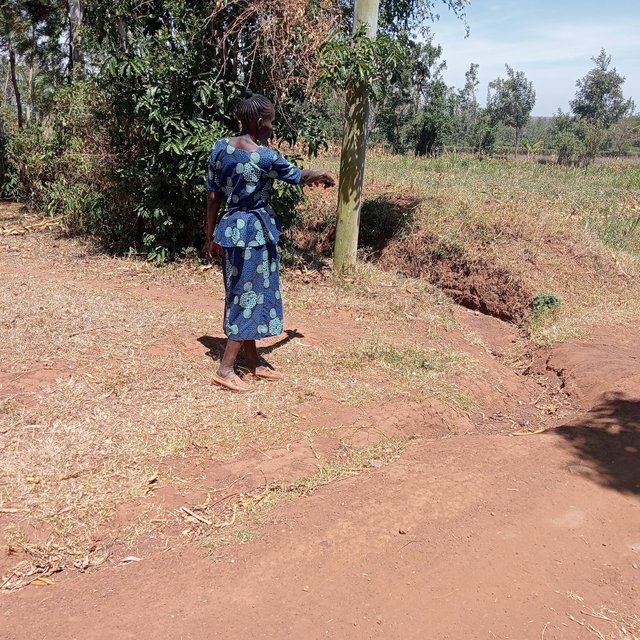
Surface runoff collector at the road (William Akwanyi)
Silt accumulation in a retention ditch (William Akwanyi)

Classification of the Technology

Main purpose
  • improve production
  • reduce, prevent, restore land degradation
  • conserve ecosystem
  • protect a watershed/ downstream areas – in combination with other Technologies
  • preserve/ improve biodiversity
  • reduce risk of disasters
  • adapt to climate change/ extremes and its impacts
  • mitigate climate change and its impacts
  • create beneficial economic impact
  • create beneficial social impact
Land use
Land use mixed within the same land unit: Ja - Agro-silvopastoralism

  • Cropland
    • Annual cropping: fodder crops - other, fodder crops - grasses, cereals - maize, vegetables - other, legumes and pulses - other, legumes and pulses - beans. Cropping system: Fallow - maize/sorghum/millet intercropped with legume
    • Perennial (non-woody) cropping: banana/plantain/abaca, fodder crops - grasses, fodder crops - legumes, clover
    • Tree and shrub cropping: fodder trees (Calliandra, Leucaena leucocephala, Prosopis, etc.), avocado, fruits, other, mango, mangosteen, guava, papaya
    Number of growing seasons per year: 2
    Is intercropping practiced? Ja
    Is crop rotation practiced? Ja
  • Grazing land
    • Cut-and-carry/ zero grazing
    • Improved pastures
    Animal type: cattle - dairy and beef (e.g. zebu), poultry
    Is integrated crop-livestock management practiced? Ja
    Products and services: milk, eggs, meat
      SpeciesCount
      cattle - dairy and beef (e.g. zebu)3
      poultry100
    Water supply
    • rainfed
    • mixed rainfed-irrigated
    • full irrigation

    Purpose related to land degradation
    • prevent land degradation
    • reduce land degradation
    • restore/ rehabilitate severely degraded land
    • adapt to land degradation
    • not applicable
    Degradation addressed
    • soil erosion by water - Wt: loss of topsoil/ surface erosion, Wg: gully erosion/ gullying
    SLM group
    • cross-slope measure
    • water diversion and drainage
    SLM measures
    • vegetative measures - V1: Tree and shrub cover, V2: Grasses and perennial herbaceous plants
    • structural measures - S4: Level ditches, pits

    Technical drawing

    Technical specifications
    Ditch dimensions: length = 70m, width = 50cm, depth = 60cm
    Slope of the field = 4%
    Plants on the berm: nappier grass
    Author: William Akwanyi

    Establishment and maintenance: activities, inputs and costs

    Calculation of inputs and costs
    • Costs are calculated: per Technology area (size and area unit: 0.4 ha)
    • Currency used for cost calculation: KES
    • Exchange rate (to USD): 1 USD = 122.95 KES
    • Average wage cost of hired labour per day: 300
    Most important factors affecting the costs
    Rate of man-days vary from one place to another and also depend on the kind of work. Exchange rate for January 2023, source: European Commission/ InfoEuro online at https://commission.europa.eu/funding-tenders/procedures-guidelines-tenders/information-contractors-and-beneficiaries/exchange-rate-inforeuro_en
    Establishment activities
    1. Slope measurement and determination of position for the retention ditch (Timing/ frequency: During the dry season)
    2. Digging the ditches (Timing/ frequency: Before onset of rains)
    Establishment inputs and costs (per 0.4 ha)
    Specify input Unit Quantity Costs per Unit (KES) Total costs per input (KES) % of costs borne by land users
    Labour
    Digging the ditches Man days 10.0 300.0 3000.0 100.0
    Equipment
    Hoe No. 1.0 80.0 80.0 100.0
    Panga (broad blade) No. 1.0 60.0 60.0 100.0
    Wheelbarrow No. 1.0 800.0 800.0 100.0
    Spade No. 1.0 90.0 90.0 100.0
    Planting rope No. 1.0 60.0 60.0 100.0
    Spirit level No. 1.0 600.0 600.0
    Other
    Slope measurement and determination of position for the retention ditch (professional service) Professional service 1.0 2000.0 2000.0
    Total costs for establishment of the Technology 6'690.0
    Total costs for establishment of the Technology in USD 54.41
    Maintenance activities
    1. Desilting (Timing/ frequency: Whenever the ditch is about 1/3 filled with silt)
    Total maintenance costs (estimation)
    2000.0

    Natural environment

    Average annual rainfall
    • < 250 mm
    • 251-500 mm
    • 501-750 mm
    • 751-1,000 mm
    • 1,001-1,500 mm
    • 1,501-2,000 mm
    • 2,001-3,000 mm
    • 3,001-4,000 mm
    • > 4,000 mm
    Agro-climatic zone
    • humid
    • sub-humid
    • semi-arid
    • arid
    Specifications on climate
    Rainfall pattern is bimodal. Monthly rainfall variability is high with some months such as January recording less than 5 mm of total rainfall.
    Name of the meteorological station: Bondo Meteorological Station
    The area is found near Lake Victoria which influences the climate.
    Slope
    • flat (0-2%)
    • gentle (3-5%)
    • moderate (6-10%)
    • rolling (11-15%)
    • hilly (16-30%)
    • steep (31-60%)
    • very steep (>60%)
    Landforms
    • plateau/plains
    • ridges
    • mountain slopes
    • hill slopes
    • footslopes
    • valley floors
    Altitude
    • 0-100 m a.s.l.
    • 101-500 m a.s.l.
    • 501-1,000 m a.s.l.
    • 1,001-1,500 m a.s.l.
    • 1,501-2,000 m a.s.l.
    • 2,001-2,500 m a.s.l.
    • 2,501-3,000 m a.s.l.
    • 3,001-4,000 m a.s.l.
    • > 4,000 m a.s.l.
    Technology is applied in
    • convex situations
    • concave situations
    • not relevant
    Soil depth
    • very shallow (0-20 cm)
    • shallow (21-50 cm)
    • moderately deep (51-80 cm)
    • deep (81-120 cm)
    • very deep (> 120 cm)
    Soil texture (topsoil)
    • coarse/ light (sandy)
    • medium (loamy, silty)
    • fine/ heavy (clay)
    Soil texture (> 20 cm below surface)
    • coarse/ light (sandy)
    • medium (loamy, silty)
    • fine/ heavy (clay)
    Topsoil organic matter content
    • high (>3%)
    • medium (1-3%)
    • low (<1%)
    Groundwater table
    • on surface
    • < 5 m
    • 5-50 m
    • > 50 m
    Availability of surface water
    • excess
    • good
    • medium
    • poor/ none
    Water quality (untreated)
    • good drinking water
    • poor drinking water (treatment required)
    • for agricultural use only (irrigation)
    • unusable
    Water quality refers to: both ground and surface water
    Is salinity a problem?
    • Ja
    • Nee

    Occurrence of flooding
    • Ja
    • Nee
    Species diversity
    • high
    • medium
    • low
    Habitat diversity
    • high
    • medium
    • low

    Characteristics of land users applying the Technology

    Market orientation
    • subsistence (self-supply)
    • mixed (subsistence/ commercial)
    • commercial/ market
    Off-farm income
    • less than 10% of all income
    • 10-50% of all income
    • > 50% of all income
    Relative level of wealth
    • very poor
    • poor
    • average
    • rich
    • very rich
    Level of mechanization
    • manual work
    • animal traction
    • mechanized/ motorized
    Sedentary or nomadic
    • Sedentary
    • Semi-nomadic
    • Nomadic
    Individuals or groups
    • individual/ household
    • groups/ community
    • cooperative
    • employee (company, government)
    Gender
    • women
    • men
    Age
    • children
    • youth
    • middle-aged
    • elderly
    Area used per household
    • < 0.5 ha
    • 0.5-1 ha
    • 1-2 ha
    • 2-5 ha
    • 5-15 ha
    • 15-50 ha
    • 50-100 ha
    • 100-500 ha
    • 500-1,000 ha
    • 1,000-10,000 ha
    • > 10,000 ha
    Scale
    • small-scale
    • medium-scale
    • large-scale
    Land ownership
    • state
    • company
    • communal/ village
    • group
    • individual, not titled
    • individual, titled
    Land use rights
    • open access (unorganized)
    • communal (organized)
    • leased
    • individual
    Water use rights
    • open access (unorganized)
    • communal (organized)
    • leased
    • individual
    Access to services and infrastructure
    health

    poor
    x
    good
    education

    poor
    x
    good
    technical assistance

    poor
    x
    good
    employment (e.g. off-farm)

    poor
    x
    good
    markets

    poor
    x
    good
    energy

    poor
    x
    good
    roads and transport

    poor
    x
    good
    drinking water and sanitation

    poor
    x
    good
    financial services

    poor
    x
    good
    Comments

    The above rating varies from one village to the other.

    Impacts

    Socio-economic impacts
    Crop production
    decreased
    x
    increased

    Quantity before SLM: 2
    Quantity after SLM: 4
    Quantity refers to the number of 90 Kg bags of maize produced per acre. Based on estimation by the farmer.

    crop quality
    decreased
    x
    increased


    Not easy to quantify but according to the farmer, the crops are doing better compared to how they were before the retention ditches were dug.

    fodder production
    decreased
    x
    increased

    Quantity before SLM: 1
    Quantity after SLM: 3
    Quantity refers to harvesting cycles for nappier grass from the same farm. Based on estimation by the farmer.

    fodder quality
    decreased
    x
    increased


    Not easy to quantify but according to the farmer, fodder is doing better compared to how it was before the retention ditches were dug.

    animal production
    decreased
    x
    increased

    Quantity before SLM: 1
    Quantity after SLM: 3
    Quantity refers to the amount of milk in litres from one cow. Milk production is often at the peak during early lactation months. Based on estimation by the farmer.

    risk of production failure
    increased
    x
    decreased

    Quantity before SLM: 80
    Quantity after SLM: 40
    Quantity refers to the percentage probability of the crop failing to do well. Based on estimation by the farmer.

    workload
    increased
    x
    decreased


    Refers to the number of hours that the farmer can be free in any working day. During the rainy season, the farmer spends some time desilting the ditches. Based on estimation by the farmer.

    Socio-cultural impacts
    food security/ self-sufficiency
    reduced
    x
    improved

    Quantity before SLM: 5
    Quantity after SLM: 2
    Quantity refers to the number of months in a year when there is total lack of food in the house, and the farmer has to buy all the food required in the house. Based on estimation by the farmer.

    SLM/ land degradation knowledge
    reduced
    x
    improved

    Quantity before SLM: 10%
    Quantity after SLM: 80%
    Quantity refers to the estimated percentage of knowledge in SLM/ land management. This is a farmer's estimate.

    Ecological impacts
    harvesting/ collection of water (runoff, dew, snow, etc)
    reduced
    x
    improved


    Not easy to quantify. Based on estimation by the farmer.

    surface runoff
    increased
    x
    decreased


    Refers to the amount of water that flows through the farm. Not easy to quantify. Based on estimation by the farmer.

    soil loss
    increased
    x
    decreased


    Not easy to quantify.

    vegetation cover
    decreased
    x
    increased


    Refers to the farmer's estimated percentage vegetation cover at the farm. Based on estimation by the farmer.

    Off-site impacts
    downstream flooding (undesired)
    increased
    x
    reduced


    Not easy to quantify. Retention ditches have reduced the amount of water that flows to the farms in the lower areas. This has reduced soil erosion in these farms.

    downstream siltation
    increased
    x
    decreased


    Not easy to quantify. All silt is deposited in the retention ditches and scooped by the farmer for replenishing parts of the farm with low soil levels.

    damage on neighbours' fields
    increased
    x
    reduced


    Not easy to quantify. Retention ditches have reduced the amount of water that flows to the farms in the lower areas. This has reduced soil erosion in these farms.

    Cost-benefit analysis

    Benefits compared with establishment costs
    Short-term returns
    very negative
    x
    very positive

    Long-term returns
    very negative
    x
    very positive

    Benefits compared with maintenance costs
    Short-term returns
    very negative
    x
    very positive

    Long-term returns
    very negative
    x
    very positive

    The retention ditches have generally improved crop production.

    Climate change

    Gradual climate change
    annual temperature increase

    not well at all
    x
    very well
    seasonal temperature increase

    not well at all
    x
    very well
    Season: dry season

    Adoption and adaptation

    Percentage of land users in the area who have adopted the Technology
    • single cases/ experimental
    • 1-10%
    • 11-50%
    • > 50%
    Of all those who have adopted the Technology, how many have done so without receiving material incentives?
    • 0-10%
    • 11-50%
    • 51-90%
    • 91-100%
    Has the Technology been modified recently to adapt to changing conditions?
    • Ja
    • Nee
    To which changing conditions?
    • climatic change/ extremes
    • changing markets
    • labour availability (e.g. due to migration)

    Conclusions and lessons learnt

    Strengths: land user's view
    • Controls soil erosion. Silt collected in the ditches is used to replenish other sections of the farm with poor soils.
    • Improved crop yields.
    Strengths: compiler’s or other key resource person’s view
    • Controls road damage due to runoff as most of the water is collected by the ditches before it destroys the road.
    Weaknesses/ disadvantages/ risks: land user's viewhow to overcome
    • Establishment investment is capital and labour intensive. The farmer has to be committed.
    • Maintenance is labour intensive. The farmer has to be committed. Proper planning of farm work.
    Weaknesses/ disadvantages/ risks: compiler’s or other key resource person’s viewhow to overcome
    • If not managed properly by regular removal of silt, the ditch can easily fill up. The farmer must be committed to remove silt regularly.
    • May overflow and collapse during high rainfall leading to high levels of soil erosion. Proper designing in consideration of runoff volumes and slope angle. Regular maintenance.

    References

    Compiler
    • William Akwanyi
    Editors
    • Innocent Faith
    • JARED AYIENA
    • Noel Templer
    • George Onyango
    • Tabitha Nekesa
    • Ahmadou Gaye
    • Siagbé Golli
    Reviewer
    • William Critchley
    • Rima Mekdaschi Studer
    • Joana Eichenberger
    • Sally Bunning
    Date of documentation: Maart 7, 2023
    Last update: April 23, 2024
    Resource persons
    Full description in the WOCAT database
    Linked SLM data
    Documentation was faciliated by
    Institution Project
    Key references
    • Climate Smart Extension Manual by KCEP - CRAL, 2021: Download free at https://www.kalro.org/files/kcep/CSA-extension-manual-18-06-21.pdf
    Links to relevant information which is available online
    This work is licensed under Creative Commons Attribution-NonCommercial-ShareaAlike 4.0 International