Rotational Grazing [Türkiye]
- Creation:
- Update:
- Compiler: Mehmet Zengin
- Editor: –
- Reviewer: Fabian Ottiger
Kontrollü Otlatma (Turkish)
technologies_1398 - Türkiye
View sections
Expand all Collapse all1. General information
1.2 Contact details of resource persons and institutions involved in the assessment and documentation of the Technology
1.3 Conditions regarding the use of data documented through WOCAT
When were the data compiled (in the field)?
24/05/2008
The compiler and key resource person(s) accept the conditions regarding the use of data documented through WOCAT:
Ja
2. Description of the SLM Technology
2.1 Short description of the Technology
Definition of the Technology:
Allowing livestocks to graze in pasturelands in a periodic and regular manner.
2.2 Detailed description of the Technology
Description:
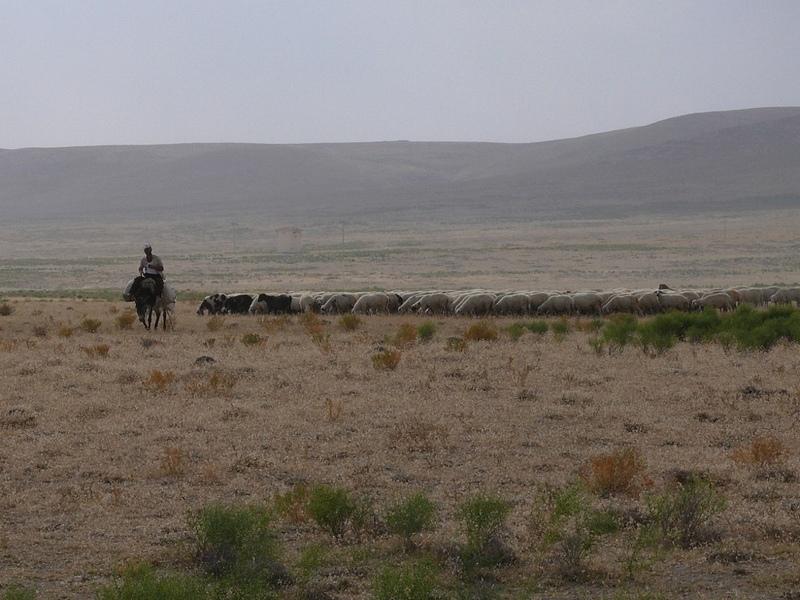
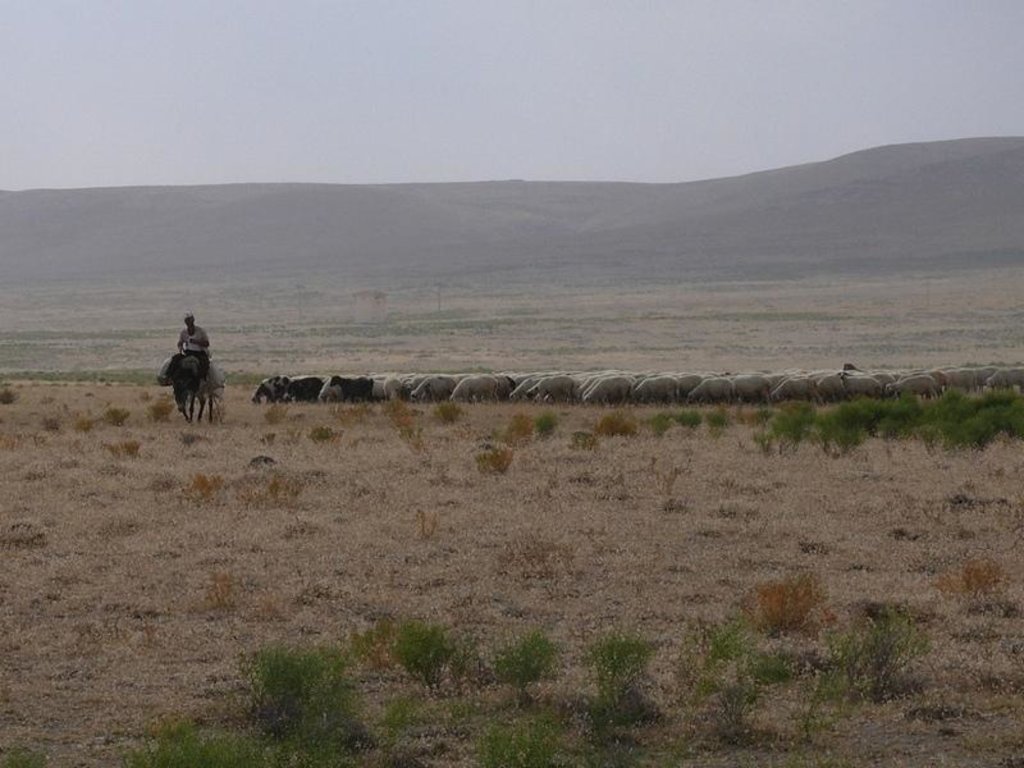
Sheep breeding has been very common for a long time in the Karapinar district. Sheep grazes in 50 km2 pasture area within the DESIRE hotspot during summers and they are fed in stables in winters. Pasture areas are degraded due to lack of rain, overgrazing and no-remediation. Farmers allow their livestock to go out from early spring onwards due to expensive feed costs in stables. A pasture can not feed sheep efficiently due to high numbers of sheep, early grazing and soil weakness due to high wind erosion. If a part of pasture is grazed one year, the remaining parts will be grazed coming year, in this way pastures are rested in rotation. So, in rested pastures soil erosion will be minimum since herb growth is good for the next year.
2.3 Photos of the Technology
2.5 Country/ region/ locations where the Technology has been applied and which are covered by this assessment
Country:
Türkiye
Region/ State/ Province:
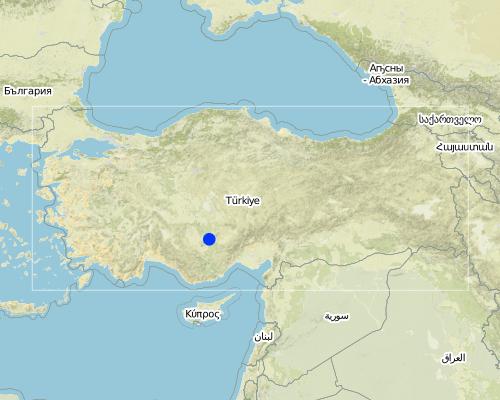
Konya
Further specification of location:
Karapinar
Map
×2.6 Date of implementation
If precise year is not known, indicate approximate date:
- 10-50 years ago
2.7 Introduction of the Technology
Specify how the Technology was introduced:
- through projects/ external interventions
3. Classification of the SLM Technology
3.2 Current land use type(s) where the Technology is applied

Cropland
- Annual cropping
Main crops (cash and food crops):
Major cash crop: wheat, sugar beet, corn, clover, barley
Major food crop: wheat, corn
Grazing land
Extensive grazing land:
- Semi-nomadism/ pastoralism
Main animal species and products:
Main livestock species: Sheep in natural pastures.
Comments:
Major land use problems (compiler’s opinion): Annual precipitation is low (270 mm) while evaporation is high (750 mm) per year. Soils are thin because of wind deflation and degradation. As a result soil fertility is low and biomass is very poor. Negatively, farmers grow plants that need lots of water. Strip farming has not been performed and drip irrigation is not preferred method.
Major land use problems (land users’ perception): Irrigation water is scarce, pasture lands are very poor, electricity for irrigation is very expensive.
Semi-nomadism / pastoralism: sheep in natural pastures.
Livestock is grazing on crop residues
3.3 Further information about land use
Water supply for the land on which the Technology is applied:
- rainfed
Comments:
Water supply: rainfed
Number of growing seasons per year:
- 1
Specify:
Longest growing period in days: 240Longest growing period from month to month: Oct - MaySecond longest growing period in days: 180Second longest growing period from month to month: May - Oct
Livestock density (if relevant):
50-100 LU /km2
3.4 SLM group to which the Technology belongs
- pastoralism and grazing land management
- improved ground/ vegetation cover
- Rotational grazing
3.5 Spread of the Technology
Comments:
Total area covered by the SLM Technology is 50 m2.
3.6 SLM measures comprising the Technology
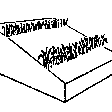
vegetative measures
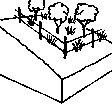
management measures
Comments:
Main measures: management measures
Secondary measures: vegetative measures
Type of vegetative measures: scattered / dispersed
3.7 Main types of land degradation addressed by the Technology

soil erosion by wind
- Et: loss of topsoil
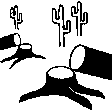
biological degradation
- Bc: reduction of vegetation cover
- Bh: loss of habitats
- Bq: quantity/ biomass decline
- Bs: quality and species composition/ diversity decline
- Bl: loss of soil life
Comments:
Main type of degradation addressed: Et: loss of topsoil, Bc: reduction of vegetation cover, Bh: loss of habitats
Secondary types of degradation addressed: Bq: quantity / biomass decline, Bs: quality and species composition /diversity decline, Bl: loss of soil life
Main causes of degradation: overgrazing (Controlled grazing must be performed immediately.), droughts (Yearly temperature is increasing.), population pressure (Population increases parallel to the labourlessness.)
Secondary causes of degradation: disturbance of water cycle (infiltration / runoff) (Annual rain is low.), over abstraction / excessive withdrawal of water (for irrigation, industry, etc.) (Groundwater is excessively used to irrigate plants of high water demand.)
3.8 Prevention, reduction, or restoration of land degradation
Comments:
Main goals: rehabilitation / reclamation of denuded land
Secondary goals: prevention of land degradation, mitigation / reduction of land degradation
4. Technical specifications, implementation activities, inputs, and costs
4.2 Technical specifications/ explanations of technical drawing
Main technical functions: improvement of ground cover, reduction in wind speed
Secondary technical functions: increase in organic matter, increase in nutrient availability (supply, recycling,…), increase of infiltration, increase / maintain water stored in soil, increase of groundwater level / recharge of groundwater, sediment retention / trapping, sediment harvesting, increase of biomass (quantity)
Scattered / dispersed
Vegetative material: C : perennial crops
Number of plants per (ha): 5000000
Perennial crops species: graminea and laguminosa
Layout change according to natural and human environment: densely herb growing
Major change in timing of activities: rotational grazing
4.3 General information regarding the calculation of inputs and costs
other/ national currency (specify):
Turkish Liras
Indicate exchange rate from USD to local currency (if relevant): 1 USD =:
1.3
Indicate average wage cost of hired labour per day:
17.00
4.4 Establishment activities
| Activity | Type of measure | Timing | |
|---|---|---|---|
| 1. | sowing | Vegetative | early spring / once |
| 2. | fertilizing | Vegetative | early spring / once |
| 3. | Farmers training | Management | winter / once |
| 4. | Barbed wire | Management | winter / once |
4.5 Costs and inputs needed for establishment
| Specify input | Unit | Quantity | Costs per Unit | Total costs per input | % of costs borne by land users | |
|---|---|---|---|---|---|---|
| Labour | Labour | ha | 1.0 | 23.0 | 23.0 | 50.0 |
| Equipment | Machine use | ha | 1.0 | 105.0 | 105.0 | 10.0 |
| Equipment | Tools | ha | 1.0 | 39.0 | 39.0 | 10.0 |
| Total costs for establishment of the Technology | 167.0 | |||||
Comments:
Duration of establishment phase: 6 month(s)
4.6 Maintenance/ recurrent activities
| Activity | Type of measure | Timing/ frequency | |
|---|---|---|---|
| 1. | fertilizing | Vegetative | early spring / once a year |
4.7 Costs and inputs needed for maintenance/ recurrent activities (per year)
| Specify input | Unit | Quantity | Costs per Unit | Total costs per input | % of costs borne by land users | |
|---|---|---|---|---|---|---|
| Labour | Labour | ha | 1.0 | 45.0 | 45.0 | 50.0 |
| Equipment | Machine use | ha | 1.0 | 16.0 | 16.0 | 10.0 |
| Total costs for maintenance of the Technology | 61.0 | |||||
Comments:
Machinery/ tools: tractor, fertilizing machine, tractor, screw
The cost were calculated according to prices of 2008 for seed, fertilizer and labour.
4.8 Most important factors affecting the costs
Describe the most determinate factors affecting the costs:
Seed and fertilizer costs.
5. Natural and human environment
5.1 Climate
Annual rainfall
- < 250 mm
- 251-500 mm
- 501-750 mm
- 751-1,000 mm
- 1,001-1,500 mm
- 1,501-2,000 mm
- 2,001-3,000 mm
- 3,001-4,000 mm
- > 4,000 mm
Specifications/ comments on rainfall:
Winter / 8 months
Agro-climatic zone
- semi-arid
Thermal climate class: boreal
5.2 Topography
Slopes on average:
- flat (0-2%)
- gentle (3-5%)
- moderate (6-10%)
- rolling (11-15%)
- hilly (16-30%)
- steep (31-60%)
- very steep (>60%)
Landforms:
- plateau/plains
- ridges
- mountain slopes
- hill slopes
- footslopes
- valley floors
Altitudinal zone:
- 0-100 m a.s.l.
- 101-500 m a.s.l.
- 501-1,000 m a.s.l.
- 1,001-1,500 m a.s.l.
- 1,501-2,000 m a.s.l.
- 2,001-2,500 m a.s.l.
- 2,501-3,000 m a.s.l.
- 3,001-4,000 m a.s.l.
- > 4,000 m a.s.l.
5.3 Soils
Soil depth on average:
- very shallow (0-20 cm)
- shallow (21-50 cm)
- moderately deep (51-80 cm)
- deep (81-120 cm)
- very deep (> 120 cm)
Soil texture (topsoil):
- coarse/ light (sandy)
- medium (loamy, silty)
Topsoil organic matter:
- low (<1%)
If available, attach full soil description or specify the available information, e.g. soil type, soil PH/ acidity, Cation Exchange Capacity, nitrogen, salinity etc.
Soil fertility is: Very low-low
Soil drainage/infiltration is: Medium
Soil water storage capacity is: Medium-very low
5.4 Water availability and quality
Ground water table:
5-50 m
Availability of surface water:
poor/ none
Water quality (untreated):
for agricultural use only (irrigation)
Comments and further specifications on water quality and quantity:
Ground water table: 5-50m (it decrease in summer and increase in winter)
Availability of surface water: poor/none (it is high in winter and very low in summer)
Seasonability of water quality and source of water pollution: For agricultural use only (irrigation) (Commonly ground water is used for agriculture. It is more saline in summer than winter seasons.)
Seasonability of water quality and source of water pollution: poor drinking water (treatement required) (Its quality is good in winter, while that of is bad in summer. Usually ground water.)
5.5 Biodiversity
Species diversity:
- low
5.6 Characteristics of land users applying the Technology
Market orientation of production system:
- mixed (subsistence/ commercial
Off-farm income:
- less than 10% of all income
Relative level of wealth:
- poor
- average
Level of mechanization:
- mechanized/ motorized
Indicate other relevant characteristics of the land users:
Population density: 10-50 persons/km2
Annual population growth: 0.5% - 1%
70% of the land users are average wealthy and own 70% of the land.
30% of the land users are poor and own 30% of the land.
Market orientation: The production is slightly subsidised
5.7 Average area of land owned or leased by land users applying the Technology
- < 0.5 ha
- 0.5-1 ha
- 1-2 ha
- 2-5 ha
- 5-15 ha
- 15-50 ha
- 50-100 ha
- 100-500 ha
- 500-1,000 ha
- 1,000-10,000 ha
- > 10,000 ha
Comments:
Average area of land owned or leased by land users applying the Technology: 15-50 ha, 50-100 ha
5.8 Land ownership, land use rights, and water use rights
Land ownership:
- state
Land use rights:
- open access (unorganized)
Water use rights:
- open access (unorganized)
5.9 Access to services and infrastructure
health:
- poor
- moderate
- good
education:
- poor
- moderate
- good
technical assistance:
- poor
- moderate
- good
employment (e.g. off-farm):
- poor
- moderate
- good
markets:
- poor
- moderate
- good
energy:
- poor
- moderate
- good
roads and transport:
- poor
- moderate
- good
financial services:
- poor
- moderate
- good
6. Impacts and concluding statements
6.1 On-site impacts the Technology has shown
Socio-economic impacts
Production
crop production
Quantity before SLM:
500
Quantity after SLM:
650
Comments/ specify:
kg/da
fodder production
Quantity before SLM:
500
Quantity after SLM:
650
Comments/ specify:
kg/da
fodder quality
Quantity before SLM:
low
Quantity after SLM:
moderate
animal production
Quantity before SLM:
15
Quantity after SLM:
23
Comments/ specify:
sheep/da
risk of production failure
Quantity before SLM:
modarate
Quantity after SLM:
low
Water availability and quality
demand for irrigation water
Income and costs
expenses on agricultural inputs
Quantity before SLM:
170
Quantity after SLM:
130
Comments/ specify:
Numbers in USD. Cost for one sheep.
farm income
Quantity before SLM:
30000 USD
Quantity after SLM:
50000 USD
Comments/ specify:
Income per year
Socio-cultural impacts
community institutions
Quantity before SLM:
low
Quantity after SLM:
moderate
national institutions
Quantity before SLM:
low
Quantity after SLM:
modarate
SLM/ land degradation knowledge
Quantity before SLM:
low
Quantity after SLM:
moderate
conflict mitigation
Quantity before SLM:
low
Quantity after SLM:
moderate
Ecological impacts
Soil
soil loss
Quantity before SLM:
high
Quantity after SLM:
modarate
soil organic matter/ below ground C
Quantity before SLM:
low
Quantity after SLM:
modarate
Biodiversity: vegetation, animals
biomass/ above ground C
Quantity before SLM:
low
Quantity after SLM:
modarate
plant diversity
Quantity before SLM:
low
Quantity after SLM:
modarate
pest/ disease control
Climate and disaster risk reduction
wind velocity
Quantity before SLM:
high
Quantity after SLM:
modarate
6.2 Off-site impacts the Technology has shown
downstream flooding
Quantity before SLM:
high
Quantity after SLM:
modarate
wind transported sediments
Quantity before SLM:
high
Quantity after SLM:
modarate
damage on neighbours' fields
Quantity before SLM:
high
Quantity after SLM:
modarate
damage on public/ private infrastructure
Quantity before SLM:
high
Quantity after SLM:
modarate
6.3 Exposure and sensitivity of the Technology to gradual climate change and climate-related extremes/ disasters (as perceived by land users)
Comments:
Planting shrub species as rows perpendicular to wind direction which are tolaerant to drought and dust storms. So the other plants can survive more and soil erosion by wind will decrease.
6.4 Cost-benefit analysis
How do the benefits compare with the establishment costs (from land users’ perspective)?
Short-term returns:
positive
Long-term returns:
positive
How do the benefits compare with the maintenance/ recurrent costs (from land users' perspective)?
Short-term returns:
positive
Long-term returns:
positive
Comments:
Pasture maintenance costs are low. Only rotational grazing is done and seeding and fertilizing were realized periodically.
6.5 Adoption of the Technology
If available, quantify (no. of households and/ or area covered):
145
Of all those who have adopted the Technology, how many have did so spontaneously, i.e. without receiving any material incentives/ payments?
- 0-10%
Comments:
50% of land user families have adopted the Technology with external material support
145 land user families have adopted the Technology with external material support
Comments on acceptance with external material support: Sheep owners supported this technology idea. Because rotational grazing and pasture improving are easy and cheap.
10% of land user families have adopted the Technology without any external material support
30 land user families have adopted the Technology without any external material support
Comments on spontaneous adoption: Sheep owners or farmers liked rotational grazing model, but they had no knowledge about it. Government Farming Organization gave knowledge about the application of this measure.
There is a moderate trend towards spontaneous adoption of the Technology
Comments on adoption trend: In both Karapınar and vicinity, farmers learned the new grazing technology and its benefits. Pasture grazing conflicts decreased gradually. The technology in question was a model for around settlements.
6.7 Strengths/ advantages/ opportunities of the Technology
| Strengths/ advantages/ opportunities in the land user’s view |
|---|
|
The conservation is easy to apply. How can they be sustained / enhanced? With education, and care, they can sustain the method. |
| Strengths/ advantages/ opportunities in the compiler’s or other key resource person’s view |
|---|
|
Low expensive, usable and adoptable How can they be sustained / enhanced? No overgrazing, animal density mustn't be inceased. Instead, the government should support new seeding and fertilizing expenses and give knowledge about new techniques. |
6.8 Weaknesses/ disadvantages/ risks of the Technology and ways of overcoming them
| Weaknesses/ disadvantages/ risks in the land user’s view | How can they be overcome? |
|---|---|
| Lack of pasture at initial phase of the method. | Feed crops production like sillage corn, welch or clover. |
| Weaknesses/ disadvantages/ risks in the compiler’s or other key resource person’s view | How can they be overcome? |
|---|---|
| Conflicts among farmers. | With training they can overcome this problem. And they did not preserve new pasture areas sowed to graze their sheep. |
Links and modules
Expand all Collapse allLinks
No links
Modules
No modules


