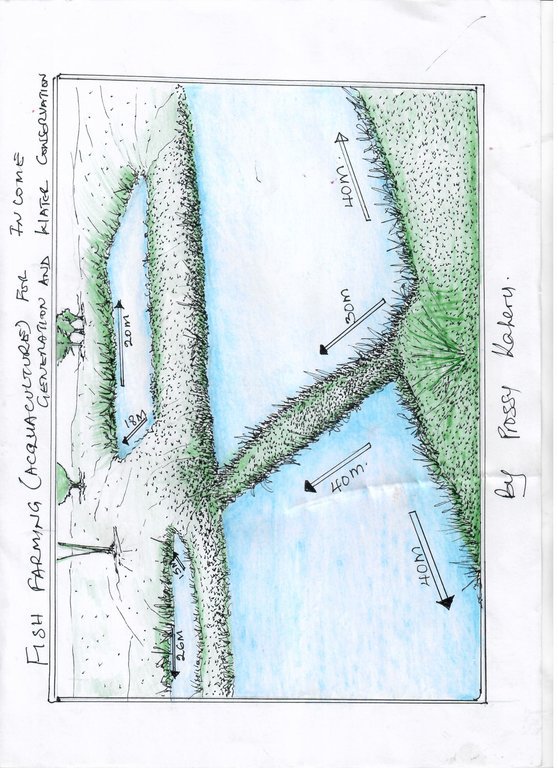
Fish farming (Aquaculture) for income generation and water conservation. (Betty Adoch)
Fish farming requires initial consultation with the extension agents or experts to access knowledge and skills on establishment as well as proper procedures including testing the water suitability and the reliabilty of water sources to constantly provide water to the fish pond.
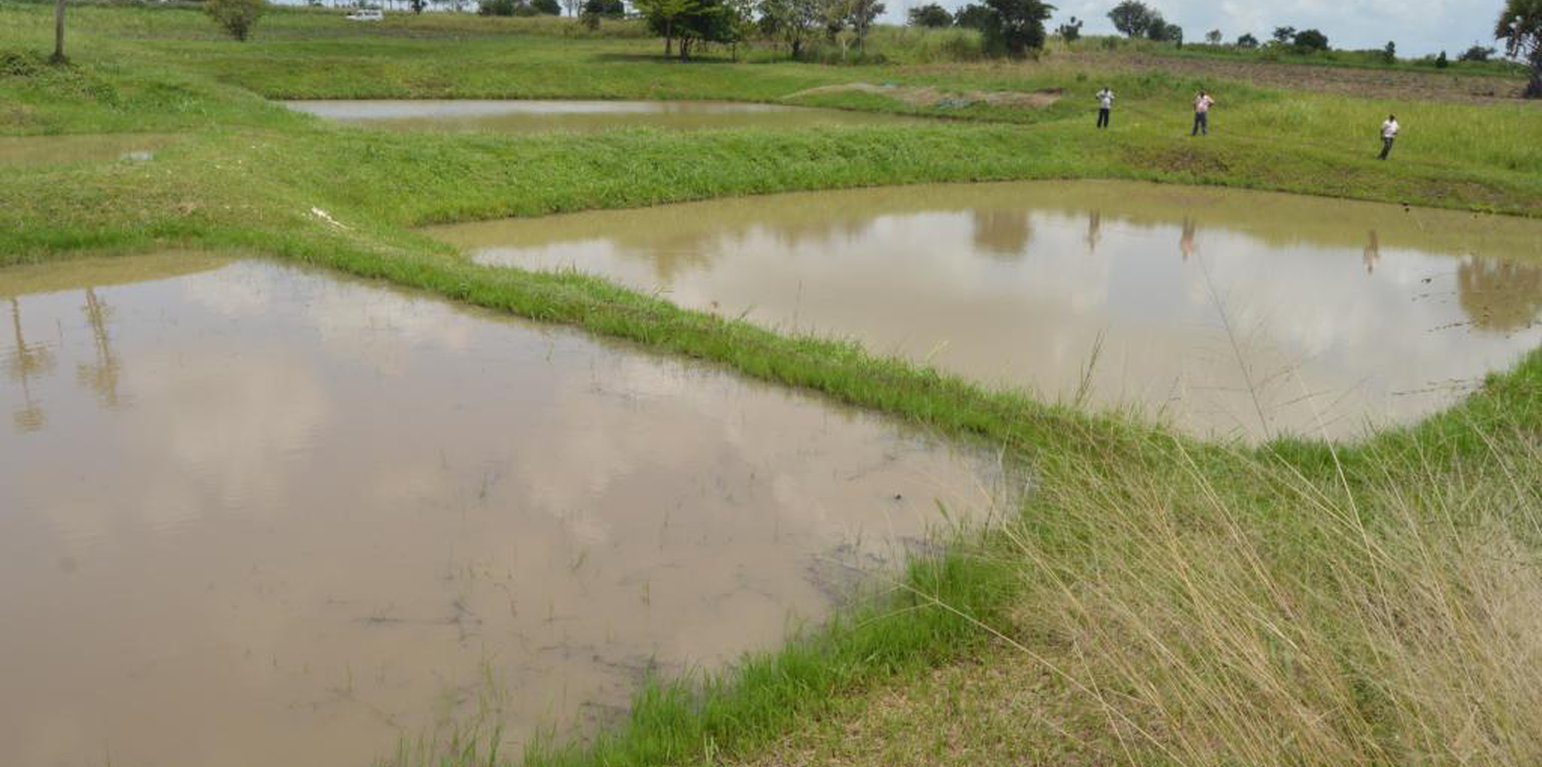
The farmer has seven big fish ponds of various sizes ranging from 30m*40m, 40m*50m, 20m*25m, 20m*26m, 15m*15m, 20m*18m and 18m *16m, which serve different purposes including the bigger ones are for breeding fish of different sizes, another for production, one is meant for cat fish (omel), another pond has mixed species of tilapia (lapok) and cat fish, another pond is meant for a rare species known as singida. The farmer has established another pond meant for only male tilapia ready for sale and the last one inhabits mixed mature species ready for sale.
Usually, the fish ponds are restocked by bringing young species from another fish pond. To ensure hygine and survival, fish ponds are maintained by clearing the bushes around the ponds weekly. Feeds are provided to the fish at a specific time interval that is regularly 10:00 am, 3:00 pm and 6:00 pm.
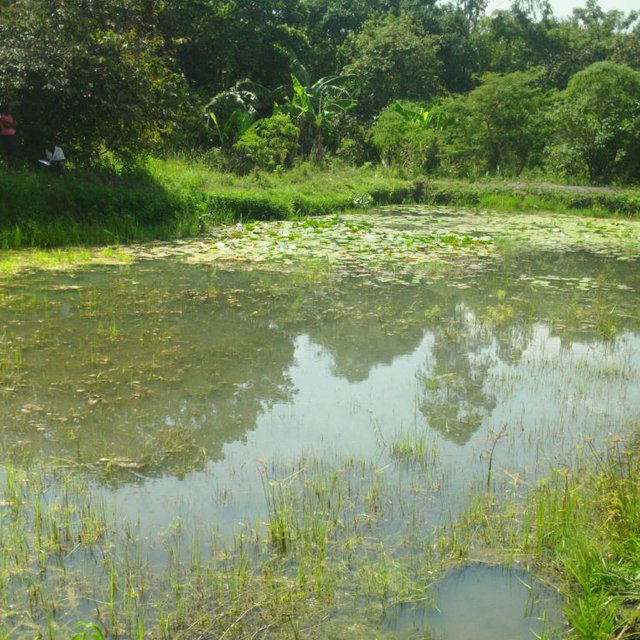
At the end of the day; once the technology is established the pond system requires only maintenance costs for removing weeds, feeding, restocking and slashing around the pond. What is not liked about this technology is that it relies on a natural spring. In case of drought survival of the fish is not guaranteed.
Location: Amuru town council, Northern Uganda, Uganda
No. of Technology sites analysed: 2-10 sites
Spread of the Technology: applied at specific points/ concentrated on a small area
Date of implementation: 2012
Type of introduction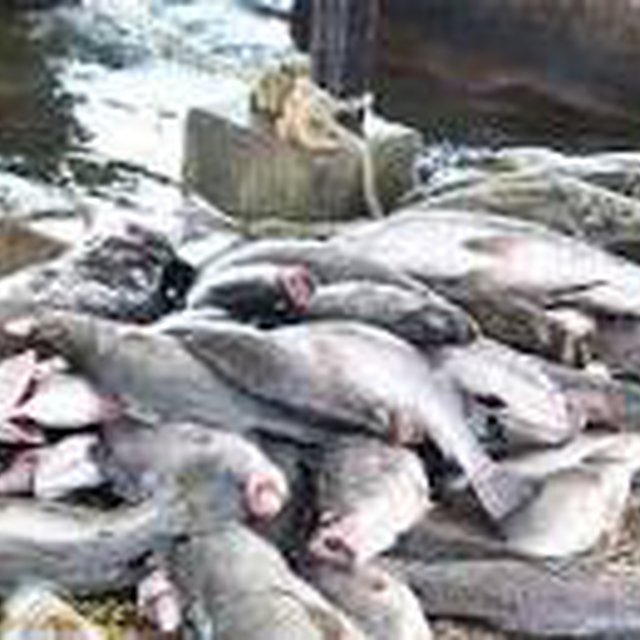

| Specify input | Unit | Quantity | Costs per Unit (UGX) | Total costs per input (UGX) | % of costs borne by land users |
| Labour | |||||
| Labour on monthly basis | workers | 5.0 | 150000.0 | 750000.0 | 100.0 |
| Equipment | |||||
| Spades | pieces | 5.0 | 7000.0 | 35000.0 | 100.0 |
| Slasher | pieces | 5.0 | 7000.0 | 35000.0 | 100.0 |
| Wheelbarrow | pieces | 1.0 | 8000.0 | 8000.0 | 100.0 |
| Other | |||||
| Fish fry | pieces | 200.0 | 1000.0 | 200000.0 | 100.0 |
| Feeds per week | kgs | 100.0 | 1000.0 | 100000.0 | 100.0 |
| Fish nets | pieces | 5.0 | 4000.0 | 20000.0 | 100.0 |
| Total costs for establishment of the Technology | 1'148'000.0 | ||||
| Specify input | Unit | Quantity | Costs per Unit (UGX) | Total costs per input (UGX) | % of costs borne by land users |
| Labour | |||||
| Labour on monthly basis | workers | 1.0 | 150000.0 | 150000.0 | 100.0 |
| Total costs for maintenance of the Technology | 150'000.0 | ||||
Fodder planted on the pond levee.
Monitoring and supervision by the extension worker and the land user.
Running water retained in the ponds.
Only for purchase of fish feeds.
From the sale of fish.
Only for feeding, fishing and clearing the bush around the pond.
Income from the sale of fish is used to purchase other food stuffs.
Fish farming associations in place to enhance fishing and negotiate for better prices.
On fishing farming extended by fisheries office and partners
Via the increased groundwater table.


