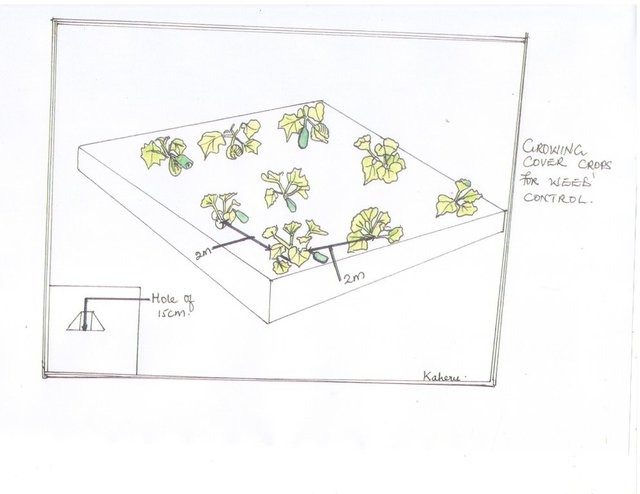
A typical cover crop that grows in garden (Amale Balla Sunday)

Growing cover crops for weed control (Uganda)

Pito cam me neko doo

Description

Cultivating leguminous crops in weed prone fields to help overgrow and kill the weeds

Weeds account for a substantial proportion of crop yield losses among farming communities in northern Uganda. Weeds reduce farm and forest productivity, by depriving them of soil nutrients and water, the latter especially during dry seasons.

Majority of farmers in northern Uganda weed fields using rudimentary methods such as hand-hoeing and hand picking; both of which are manual and ineffective. Mechanized and herbicide weeding methods are out of reach of typical small scale farmers in the region. Moreover, alternative, more cost effective and environmentally augmenting natural weed control methods such as cover crops or living mulch exist, but are yet to be adopted widely in the region. Cover crops are creeping leguminous crops such as Macuna beans (mucuna pruriens) and local wild beans, which are planted in fields purposely to suppress weeds, control runoff and soil erosion, conserve soil moisture, fix nitrogen, regulate soil temperature, improve soil structure and provide fodder for livestock.

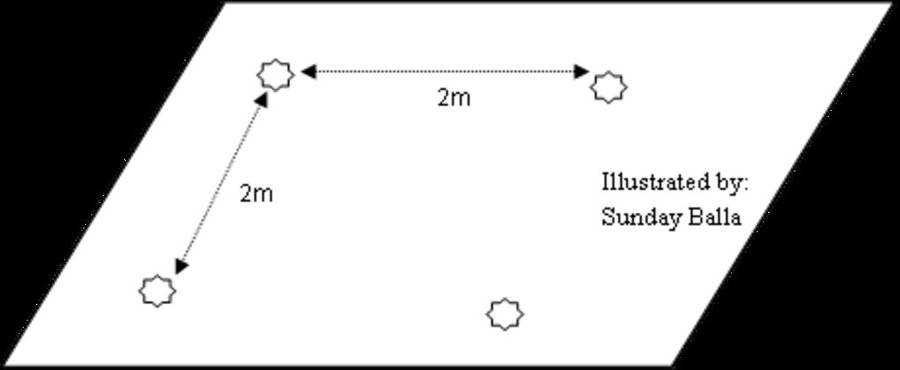
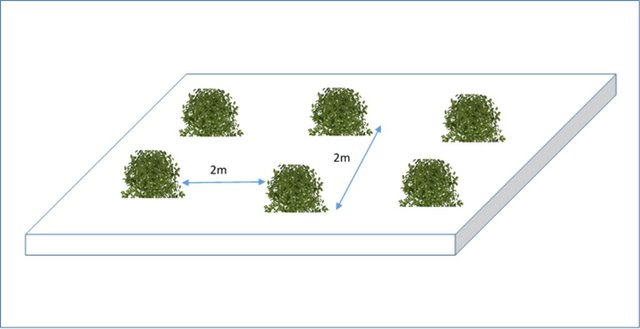
In northern Uganda, cover crops are usually planted at a spacing of 2 meter by 2 meter (see figure below) and in holes of 5 cm depth. Cover mulches are generally planted after the main crops have been harvested to minimize cover crop-main crop competition for resources. Nevertheless, planting while the main crop is growing in the field is also possible. However, the main crops should be given up to five weeks to establish before planting your cover crop.

The cover crop technology, being a natural phenomenon is usually affordable by typical small scale farmers in northern Uganda. The only challenge is to access to quality seed of suitable cover crops. Otherwise, after sowing the first and purchased seed, the farmer uses own seed harvested from previous crops for subsequent season sowing. However, the farmer needs to ensure that cover crops do not become invasive in cropping fields. This is done by clearing cover crops just before their fruits mature. As such, only a portion of the cover crop to be left for seed purpose is allowed growth to full maturity.

Location

Location: Nwoya District, Gulu, Uganda

No. of Technology sites analysed: 2-10 sites

Geo-reference of selected sites
  • 32.34873, 2.80399
  • 31.99971, 2.63453

Spread of the Technology: applied at specific points/ concentrated on a small area

Date of implementation: 2013

Type of introduction
Photo of covercrop (Sunday Balla)

Classification of the Technology

Main purpose
  • improve production
  • reduce, prevent, restore land degradation
  • conserve ecosystem
  • protect a watershed/ downstream areas – in combination with other Technologies
  • preserve/ improve biodiversity
  • reduce risk of disasters
  • adapt to climate change/ extremes and its impacts
  • mitigate climate change and its impacts
  • create beneficial economic impact
  • create beneficial social impact
Land use

  • Cropland - Annual cropping, Perennial (non-woody) cropping, Tree and shrub cropping
    Main crops (cash and food crops): Maize, cassava, bananas, oranges, mangoes, tree plantations
  • Grazing land - Extensive grazing land: Semi-nomadism/ pastoralism
    Intensive grazing/ fodder production: Cut-and-carry/ zero grazing, Improved pastures

Water supply
  • rainfed
  • mixed rainfed-irrigated
  • full irrigation

Number of growing seasons per year: 2
Land use before implementation of the Technology: n.a.
Livestock density: n.a.

Purpose related to land degradation
  • prevent land degradation
  • reduce land degradation
  • restore/ rehabilitate severely degraded land
  • adapt to land degradation
  • not applicable
Degradation addressed
  • soil erosion by water - Wt: loss of topsoil/ surface erosion
  • soil erosion by wind - Et: loss of topsoil
  • chemical soil deterioration - Cp: soil pollution
  • biological degradation - Bp: increase of pests/ diseases, loss of predators
SLM group
  • rotational systems (crop rotation, fallows, shifting cultivation)
  • improved ground/ vegetation cover
  • integrated pest and disease management (incl. organic agriculture)
SLM measures
  • agronomic measures - A1: Vegetation/ soil cover, A2: Organic matter/ soil fertility
  • vegetative measures - V2: Grasses and perennial herbaceous plants

Technical drawing

Technical specifications
Author: sunday balla
Spacing between covercrop plants: 2m X 2m, plant one seed per planting hole.
Author: Amale Balla Sunday
Author: Kaheru, Prossy

Establishment and maintenance: activities, inputs and costs

Calculation of inputs and costs
  • Costs are calculated: per Technology area (size and area unit: 1ha)
  • Currency used for cost calculation: uganda shillings
  • Exchange rate (to USD): 1 USD = 3600.0 uganda shillings
  • Average wage cost of hired labour per day: 5000
Most important factors affecting the costs
Labour for slashing the covercrop
Establishment activities
  1. Obtaining seed (Timing/ frequency: dry season)
  2. Digging the holes for planting (Timing/ frequency: onset of rains)
  3. Planting covercrop seeds (Timing/ frequency: onset of rains)
  4. Clearing cover crops (partly) (Timing/ frequency: at fruit set)
  5. Harvesting covercrop seed (Timing/ frequency: at seed maturity)
Establishment inputs and costs (per 1ha)
Specify input Unit Quantity Costs per Unit (uganda shillings) Total costs per input (uganda shillings) % of costs borne by land users
Labour
During planting personnel 2.0 5000.0 10000.0 100.0
Clearing personnel 6.0 5000.0 30000.0 100.0
Harvesting personnel 1.0 5000.0 5000.0 100.0
Equipment
Hand hoe pieces 1.0 12000.0 12000.0 100.0
Slashers pieces 1.0 6000.0 6000.0 100.0
Plant material
Seeds kg 2.0 8000.0 16000.0 100.0
Total costs for establishment of the Technology 79'000.0
Maintenance activities
  1. Planting (Timing/ frequency: once after every 3-4 years)
  2. Clearing (Timing/ frequency: once after every 3-4 years)
  3. Seed harvesting and saving (Timing/ frequency: once after every 3-4 years)
Maintenance inputs and costs (per 1ha)
Specify input Unit Quantity Costs per Unit (uganda shillings) Total costs per input (uganda shillings) % of costs borne by land users
Labour
Planting personnel 0.5 5000.0 2500.0 100.0
Slashing personnel 1.5 5000.0 7500.0 100.0
Equipment
Handhoe pieces 0.25 12000.0 3000.0 100.0
Slashers pieces 0.25 6000.0 1500.0 100.0
Total costs for maintenance of the Technology 14'500.0

Natural environment

Average annual rainfall
  • < 250 mm
  • 251-500 mm
  • 501-750 mm
  • 751-1,000 mm
  • 1,001-1,500 mm
  • 1,501-2,000 mm
  • 2,001-3,000 mm
  • 3,001-4,000 mm
  • > 4,000 mm
Agro-climatic zone
  • humid
  • sub-humid
  • semi-arid
  • arid
Specifications on climate
n.a.
Slope
  • flat (0-2%)
  • gentle (3-5%)
  • moderate (6-10%)
  • rolling (11-15%)
  • hilly (16-30%)
  • steep (31-60%)
  • very steep (>60%)
Landforms
  • plateau/plains
  • ridges
  • mountain slopes
  • hill slopes
  • footslopes
  • valley floors
Altitude
  • 0-100 m a.s.l.
  • 101-500 m a.s.l.
  • 501-1,000 m a.s.l.
  • 1,001-1,500 m a.s.l.
  • 1,501-2,000 m a.s.l.
  • 2,001-2,500 m a.s.l.
  • 2,501-3,000 m a.s.l.
  • 3,001-4,000 m a.s.l.
  • > 4,000 m a.s.l.
Technology is applied in
  • convex situations
  • concave situations
  • not relevant
Soil depth
  • very shallow (0-20 cm)
  • shallow (21-50 cm)
  • moderately deep (51-80 cm)
  • deep (81-120 cm)
  • very deep (> 120 cm)
Soil texture (topsoil)
  • coarse/ light (sandy)
  • medium (loamy, silty)
  • fine/ heavy (clay)
Soil texture (> 20 cm below surface)
  • coarse/ light (sandy)
  • medium (loamy, silty)
  • fine/ heavy (clay)
Topsoil organic matter content
  • high (>3%)
  • medium (1-3%)
  • low (<1%)
Groundwater table
  • on surface
  • < 5 m
  • 5-50 m
  • > 50 m
Availability of surface water
  • excess
  • good
  • medium
  • poor/ none
Water quality (untreated)
  • good drinking water
  • poor drinking water (treatment required)
  • for agricultural use only (irrigation)
  • unusable
Is salinity a problem?
  • Yes
  • No

Occurrence of flooding
  • Yes
  • No
Species diversity
  • high
  • medium
  • low
Habitat diversity
  • high
  • medium
  • low

Characteristics of land users applying the Technology

Market orientation
  • subsistence (self-supply)
  • mixed (subsistence/ commercial
  • commercial/ market
Off-farm income
  • less than 10% of all income
  • 10-50% of all income
  • > 50% of all income
Relative level of wealth
  • very poor
  • poor
  • average
  • rich
  • very rich
Level of mechanization
  • manual work
  • animal traction
  • mechanized/ motorized
Sedentary or nomadic
  • Sedentary
  • Semi-nomadic
  • Nomadic
Individuals or groups
  • individual/ household
  • groups/ community
  • cooperative
  • employee (company, government)
Gender
  • women
  • men
Age
  • children
  • youth
  • middle-aged
  • elderly
Area used per household
  • < 0.5 ha
  • 0.5-1 ha
  • 1-2 ha
  • 2-5 ha
  • 5-15 ha
  • 15-50 ha
  • 50-100 ha
  • 100-500 ha
  • 500-1,000 ha
  • 1,000-10,000 ha
  • > 10,000 ha
Scale
  • small-scale
  • medium-scale
  • large-scale
Land ownership
  • state
  • company
  • communal/ village
  • group
  • individual, not titled
  • individual, titled
Land use rights
  • open access (unorganized)
  • communal (organized)
  • leased
  • individual
Water use rights
  • open access (unorganized)
  • communal (organized)
  • leased
  • individual
Access to services and infrastructure
health

poor
good
education

poor
good
technical assistance

poor
good
employment (e.g. off-farm)

poor
good
markets

poor
good
energy

poor
good
roads and transport

poor
good
drinking water and sanitation

poor
good
financial services

poor
good

Impacts

Socio-economic impacts
Crop production
decreased
increased

Quantity before SLM: 1200kg per ha
Quantity after SLM: 1800kg per ha
Yields pertain to maize

crop quality
decreased
increased

Quantity before SLM: poor seed
Quantity after SLM: good quality seed

fodder production
decreased
increased


Slashed cover crop as feeds

fodder quality
decreased
increased

animal production
decreased
increased

risk of production failure
increased
decreased

production area (new land under cultivation/ use)
decreased
increased

expenses on agricultural inputs
increased
decreased

Quantity before SLM: 20000 per year
Quantity after SLM: 0
Pertains to herbicides

farm income
decreased
increased

workload
increased
decreased


Now weed garden once a season. Before farmers used to weed 2-3 times per season.

Socio-cultural impacts
food security/ self-sufficiency
reduced
improved

SLM/ land degradation knowledge
reduced
improved

Ecological impacts
surface runoff
increased
decreased

evaporation
increased
decreased

Off-site impacts
buffering/ filtering capacity (by soil, vegetation, wetlands)
reduced
improved

wind transported sediments
increased
reduced

Cost-benefit analysis

Benefits compared with establishment costs
Short-term returns
very negative
very positive

Long-term returns
very negative
very positive

Benefits compared with maintenance costs
Short-term returns
very negative
very positive

Long-term returns
very negative
very positive

Climate change

Gradual climate change
annual temperature increase

not well at all
very well
seasonal temperature increase

not well at all
very well
Season: dry season
annual rainfall decrease

not well at all
very well
seasonal rainfall decrease

not well at all
very well
Season: wet/ rainy season
Climate-related extremes (disasters)
local windstorm

not well at all
very well
drought

not well at all
very well

Adoption and adaptation

Percentage of land users in the area who have adopted the Technology
  • single cases/ experimental
  • 1-10%
  • 10-50%
  • more than 50%
Of all those who have adopted the Technology, how many have done so without receiving material incentives?
  • 0-10%
  • 10-50%
  • 50-90%
  • 90-100%
Has the Technology been modified recently to adapt to changing conditions?
  • Yes
  • No
To which changing conditions?
  • climatic change/ extremes
  • changing markets
  • labour availability (e.g. due to migration)

Conclusions and lessons learnt

Strengths: land user's view
  • reduction of workload on the farmer during weeding
  • Reduction of erosion and improvement of soil fertility as the cover crop in most cases is a legume
Strengths: compiler’s or other key resource person’s view
  • Sustainable source of green manure, animal manure
  • Farmers can save own seed
Weaknesses/ disadvantages/ risks: land user's viewhow to overcome
  • Requires to be planted very early at onset of season
  • Can become invasive if not well managed
Weaknesses/ disadvantages/ risks: compiler’s or other key resource person’s viewhow to overcome

References

Compiler
  • Sunday Balla Amale
Editors
  • Joy Tukahirwa
  • Kamugisha Rick Nelson
  • betty adoch
  • Bernard Fungo
Reviewer
  • John Stephen Tenywa
  • Nicole Harari
  • Udo Höggel
Date of documentation: Dec. 6, 2017
Last update: May 11, 2020
Resource persons
Full description in the WOCAT database
Linked SLM data
Documentation was faciliated by
Institution Project
This work is licensed under Creative Commons Attribution-NonCommercial-ShareaAlike 4.0 International