This technology is problematic with regard to land degradation, so it cannot be declared a sustainable land management technology
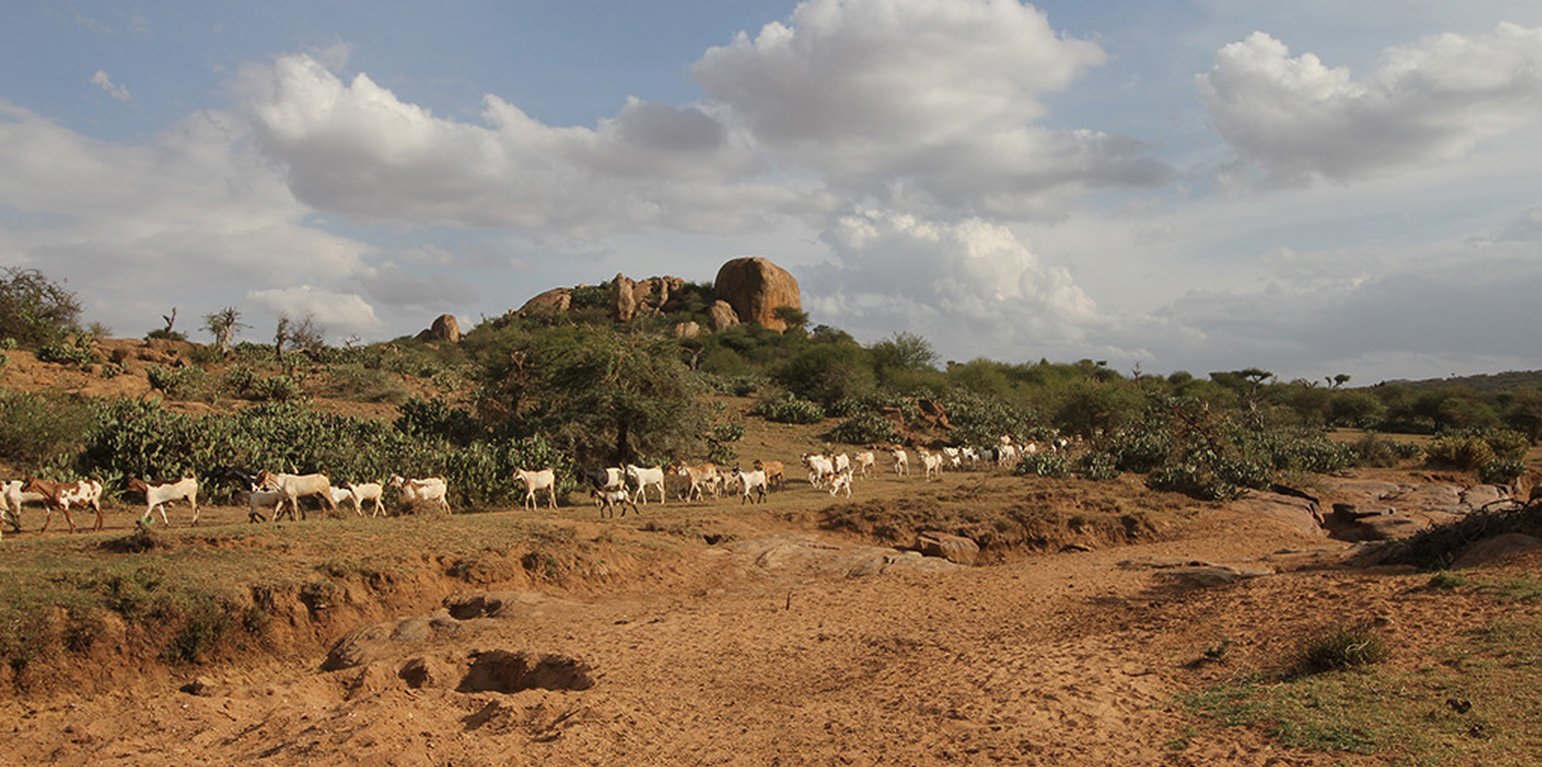
Livestock from Makurian Group Ranch (Michael Herger)

Makurian Group Ranch Grazing with Holistic Management Principles (Kenya)

Description

The grazing principles of a Masai group ranch (pastoralists) deal with high numbers of livestock in semi-arid lands with very limited water resources. Makurian has abandoned "Holistic Management" principles and applies a more traditional management system today. There is a grazing plan for the rains, while during the dry season everybody seeks for water and pasture individually. Bare land is recovered by "Boma” technology (strategic corralling of animals overnight) and reseeding. The rangeland is due to high stocking rates severely degraded with lots of erosion, bare ground, and invasive species. High stocking rates have on the one hand historical and political reasons and on the other hand socioeconomic rationales.

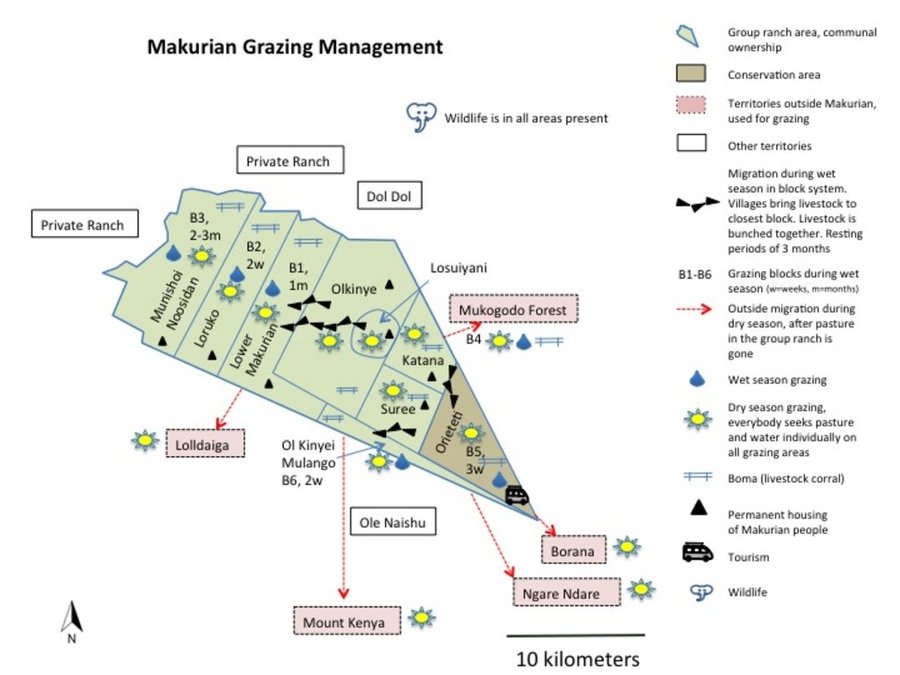
On Makurian Masai Group Ranch, livestock production management is through a combination of traditional livestock keeping practices and newly introduced management principles. Livestock production at Makurian is for subsistence and local use, and has very high cultural significance.
During the wet season, livestock are “bunched” together and rotational grazing in blocks is practiced. The management team (elders) group all livestock from each village (16 villages) and each uses the block next to their village. Livestock are hardly separated (cows, heifers, steers, bulls all herded together).
o Block 1: Lower Makurian - 1 month
o Block 2: Makurian Loruko - 2 weeks (next to Lolldaiga Northern Gate)
o Block 3: Munishoi Noosidan - 2-3 months
o Block 4: Mukogodo Forest - 1-2 months
o Block 5: Orieteti Conservation Area - 3 weeks. Soft grass, runs out quickly.
o Block 6: Ol Kinyei Mulango - 2 weeks. Next to Olenaisho
They apply resting periods of three months after usage (if this rule is broken, the owner is punished by a fine of one livestock unit).
When it becomes dry, everyone is responsible for their own livestock. Owners of livestock want to maintain and decide about their livestock individually, this is why "Holistic Management" and specific grazing plans for the dry season did not work.
In comparison to earlier days when the whole family moved, and livestock was herded by morans (young warriors), they hire external herders nowadays (800 herders in total). Herders seek whatever water and pasture remains on the group ranch, then move on to:
(a) Ngare Ndare forest: 1,000 cattle and 1,000 sheep and goats (shoats) per year on average, for 1-2 months, over an area of 250 km2;
(b) Mukogodo forest: 3,000 cattle and 4,000 shoats per year on average, for 3-4 weeks, over 250 km2, and
(c) Mount Kenya: 12,000 cattle and 5,000 shoats on average per year, for 1-2 months, on an undefined area.
In Mukogodo forest, Makurian Masai have also officially settled, in Ngare Ndare forest on the other hand they graze on the basis of an informal agreement and on Mount Kenya it is not official pasture - but grazing is tolerated). They are also assisted by private ranches to graze during droughts (Lolldaiga and Borana; for every 1,000 units, they usually pay 5 Ksh per cow per month: a token amount). On one private ranch (Borana) they also graze steers and cows for fattening and selling.

Furthermore, Laikipia rangelands support some of the highest densities of wildlife in Kenya, however, group ranches less so than private ranches. The wild herbivore biomass density on group ranches is by Georgiadis et al. (2007) estimated at 205 ha /TLU.
Bomas (corrals in Kiswahili) for the livestock are constructed in traditional style, where animals are kept closely bunched together in enclosures overnight. Bomas are strategically located on denuded land to rehabilitate the land (through dung accumulation and breaking the soil crust by hoof action). Every homestead has one boma (approximately 1,500 in total in the whole Group Ranch). When herders are moving with livestock, temporary bomas are constructed.
Sales are usually need-driven (e.g. for school fees) within a family. They sell to the nearest local markets (in DolDol and Nanyuki) or directly to butchers. Makurian is also part of the "Dung Market" in Mukogodo District, where livestock dung is sold as manure for crop production. Moreover, Makurian makes additional income by harvesting sand and selling it for construction.

Location

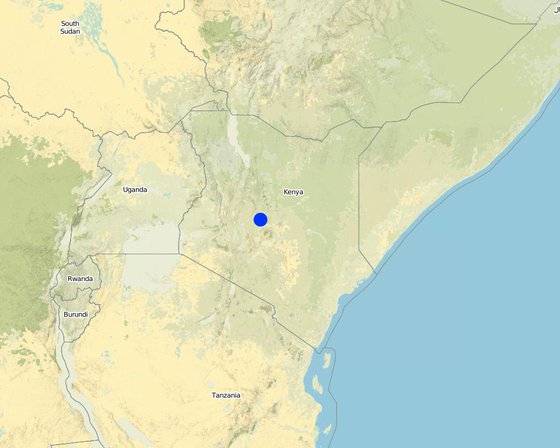
Location: Mukogodo Division, Laikipia, Kenya

No. of Technology sites analysed: single site

Geo-reference of selected sites
  • 37.12897, 0.34975

Spread of the Technology: evenly spread over an area (78.0 km²)

In a permanently protected area?:

Date of implementation: less than 10 years ago (recently)

Type of introduction
Rangeland of Makurian in December after rainfalls. The degraded soil was not able to produce grasses (annual and perennial) but only a few forbes. (Michael Herger)
Pedestal - example of an erosion feature, that shows how much (top-)soil has been eroded and how perennial grasses protect against erosion. (Michael Herger)

Classification of the Technology

Main purpose
  • improve production
  • reduce, prevent, restore land degradation
  • conserve ecosystem
  • protect a watershed/ downstream areas – in combination with other Technologies
  • preserve/ improve biodiversity
  • reduce risk of disasters
  • adapt to climate change/ extremes and its impacts
  • mitigate climate change and its impacts
  • create beneficial economic impact
  • create beneficial social impact
Land use

  • Grazing land
    • Semi-nomadic pastoralism
    Animal type: camels, goats, mules and asses, sheep, cattle
    Products and services: meat, milk
      SpeciesCount
      goats20000
      sheep10000
    • Settlements, infrastructure - Settlements, buildings
      Remarks: Villages, bomas, manyattas. 8'000 inhabitans.

    Water supply
    • rainfed
    • mixed rainfed-irrigated
    • full irrigation

    Purpose related to land degradation
    • prevent land degradation
    • reduce land degradation
    • restore/ rehabilitate severely degraded land
    • adapt to land degradation
    • not applicable
    Degradation addressed
    • soil erosion by water - Wt: loss of topsoil/ surface erosion, Wg: gully erosion/ gullying
    • soil erosion by wind - Et: loss of topsoil
    • physical soil deterioration - Pc: compaction, Pk: slaking and crusting, Pi: soil sealing
    • biological degradation - Bc: reduction of vegetation cover, Bh: loss of habitats, Bq: quantity/ biomass decline, Bs: quality and species composition/ diversity decline, Bl: loss of soil life
    SLM group
    • pastoralism and grazing land management
    • improved ground/ vegetation cover
    SLM measures
    • management measures - M2: Change of management/ intensity level, M4: Major change in timing of activities

    Technical drawing

    Technical specifications
    None
    Author: Michael Herger

    Establishment and maintenance: activities, inputs and costs

    Calculation of inputs and costs
    • Costs are calculated: per Technology area (size and area unit: Herders, animals treatment (for the total area affected by livestock = 78km2))
    • Currency used for cost calculation: USD
    • Exchange rate (to USD): 1 USD = n.a
    • Average wage cost of hired labour per day: 1.5
    Most important factors affecting the costs
    Herders
    Establishment activities
    1. Grazing planning for bunched animals (livestock from all households) (Timing/ frequency: None)
    2. Hiring herders, supervisors, watchmen etc (Timing/ frequency: None)
    Establishment inputs and costs (per Herders, animals treatment (for the total area affected by livestock = 78km2))
    Specify input Unit Quantity Costs per Unit (USD) Total costs per input (USD) % of costs borne by land users
    Labour
    unknown
    Maintenance activities
    1. Herders, supervisors, watchmen etc (Timing/ frequency: None)
    2. Animal treatments (vaccination, spraying, injections) (Timing/ frequency: None)
    3. Planning activites (Timing/ frequency: None)
    4. Boma Management (mainly movement of Bomas) (Timing/ frequency: None)
    Maintenance inputs and costs (per Herders, animals treatment (for the total area affected by livestock = 78km2))
    Specify input Unit Quantity Costs per Unit (USD) Total costs per input (USD) % of costs borne by land users
    Labour
    Herders, watchmen, supervisors Person-days 260000.0 1.5 390000.0
    Engaged population in livestock production 720000.0 1.5 1080000.0
    Other
    Animals treatments Per TLU 13500.0 3.5 47250.0
    Total costs for maintenance of the Technology 1'517'250.0
    Total costs for maintenance of the Technology in USD 1'517'250.0

    Natural environment

    Average annual rainfall
    • < 250 mm
    • 251-500 mm
    • 501-750 mm
    • 751-1,000 mm
    • 1,001-1,500 mm
    • 1,501-2,000 mm
    • 2,001-3,000 mm
    • 3,001-4,000 mm
    • > 4,000 mm
    Agro-climatic zone
    • humid
    • sub-humid
    • semi-arid
    • arid
    Specifications on climate
    Average annual rainfall in mm: 378.0
    Strong local (and temporal) variation, changing rainfall regimes. Makurian generally drier than Lolldaiga.
    Name of the meteorological station: Rainfall gauge Lolldaiga Northern Gate (neighbouring ranch)
    Slope
    • flat (0-2%)
    • gentle (3-5%)
    • moderate (6-10%)
    • rolling (11-15%)
    • hilly (16-30%)
    • steep (31-60%)
    • very steep (>60%)
    Landforms
    • plateau/plains
    • ridges
    • mountain slopes
    • hill slopes
    • footslopes
    • valley floors
    Altitude
    • 0-100 m a.s.l.
    • 101-500 m a.s.l.
    • 501-1,000 m a.s.l.
    • 1,001-1,500 m a.s.l.
    • 1,501-2,000 m a.s.l.
    • 2,001-2,500 m a.s.l.
    • 2,501-3,000 m a.s.l.
    • 3,001-4,000 m a.s.l.
    • > 4,000 m a.s.l.
    Technology is applied in
    • convex situations
    • concave situations
    • not relevant
    Soil depth
    • very shallow (0-20 cm)
    • shallow (21-50 cm)
    • moderately deep (51-80 cm)
    • deep (81-120 cm)
    • very deep (> 120 cm)
    Soil texture (topsoil)
    • coarse/ light (sandy)
    • medium (loamy, silty)
    • fine/ heavy (clay)
    Soil texture (> 20 cm below surface)
    • coarse/ light (sandy)
    • medium (loamy, silty)
    • fine/ heavy (clay)
    Topsoil organic matter content
    • high (>3%)
    • medium (1-3%)
    • low (<1%)
    Groundwater table
    • on surface
    • < 5 m
    • 5-50 m
    • > 50 m
    Availability of surface water
    • excess
    • good
    • medium
    • poor/ none
    Water quality (untreated)
    • good drinking water
    • poor drinking water (treatment required)
    • for agricultural use only (irrigation)
    • unusable
    Water quality refers to:
    Is salinity a problem?
    • Yes
    • No

    Occurrence of flooding
    • Yes
    • No
    Species diversity
    • high
    • medium
    • low
    Habitat diversity
    • high
    • medium
    • low

    Characteristics of land users applying the Technology

    Market orientation
    • subsistence (self-supply)
    • mixed (subsistence/ commercial)
    • commercial/ market
    Off-farm income
    • less than 10% of all income
    • 10-50% of all income
    • > 50% of all income
    Relative level of wealth
    • very poor
    • poor
    • average
    • rich
    • very rich
    Level of mechanization
    • manual work
    • animal traction
    • mechanized/ motorized
    Sedentary or nomadic
    • Sedentary
    • Semi-nomadic
    • Nomadic
    Individuals or groups
    • individual/ household
    • groups/ community
    • cooperative
    • employee (company, government)
    Gender
    • women
    • men
    Age
    • children
    • youth
    • middle-aged
    • elderly
    Area used per household
    • < 0.5 ha
    • 0.5-1 ha
    • 1-2 ha
    • 2-5 ha
    • 5-15 ha
    • 15-50 ha
    • 50-100 ha
    • 100-500 ha
    • 500-1,000 ha
    • 1,000-10,000 ha
    • > 10,000 ha
    Scale
    • small-scale
    • medium-scale
    • large-scale
    Land ownership
    • state
    • company
    • communal/ village
    • group
    • individual, not titled
    • individual, titled
    Land use rights
    • open access (unorganized)
    • communal (organized)
    • leased
    • individual
    Water use rights
    • open access (unorganized)
    • communal (organized)
    • leased
    • individual
    Access to services and infrastructure
    health

    poor
    good
    education

    poor
    good
    technical assistance

    poor
    good
    employment (e.g. off-farm)

    poor
    good
    markets

    poor
    good
    energy

    poor
    good
    roads and transport

    poor
    good
    drinking water and sanitation

    poor
    good
    financial services

    poor
    good

    Impacts

    Socio-economic impacts
    fodder production
    decreased
    increased


    Lack of rain. Impact analysis is comparing the current state vs. some 10 years ago when they applied Holistic Management. This is why improvements are indicated according to the land user, even though the land is severely degraded.

    fodder quality
    decreased
    increased

    animal production
    decreased
    increased

    land management
    hindered
    simplified

    drinking water availability
    decreased
    increased

    drinking water quality
    decreased
    increased


    less salt

    water availability for livestock
    decreased
    increased

    water quality for livestock
    decreased
    increased

    workload
    increased
    decreased


    Compared to HM it has decreased, because of higher numbers of livestock it has increased though

    Socio-cultural impacts
    food security/ self-sufficiency
    reduced
    improved

    land use/ water rights
    worsened
    improved

    SLM/ land degradation knowledge
    reduced
    improved


    More traditional knowledge than with Holistic Management

    conflict mitigation
    worsened
    improved


    Other communities

    Ecological impacts
    water quantity
    decreased
    increased

    water quality
    decreased
    increased

    surface runoff
    increased
    decreased


    Opuntia

    groundwater table/ aquifer
    lowered
    recharge

    evaporation
    increased
    decreased

    vegetation cover
    decreased
    increased


    Opuntia (an invasive cactus) is chasing out native plants and consuming water. Elephants are destroying trees (high density of elephants, Opuntia is additionally attracting elephants)

    plant diversity
    decreased
    increased


    Opuntia

    animal diversity
    decreased
    increased


    More wildlife coming in, roaming even in villages. Elephants problematic; breaking fences

    habitat diversity
    decreased
    increased


    Wildlife numbers are declining drastically. Indigenous vegetation is being driven out by invasive species like Opuntia.

    drought impacts
    increased
    decreased


    Resilience has worsened

    Off-site impacts

    Cost-benefit analysis

    Benefits compared with establishment costs
    Short-term returns
    very negative
    very positive

    Long-term returns
    very negative
    very positive

    Benefits compared with maintenance costs
    Short-term returns
    very negative
    very positive

    Long-term returns
    very negative
    very positive

    Climate change

    Gradual climate change
    Greater variation of seasonal rainfall, more intense rainfalls, change in rainfall regimes in general (see Schmocker 2013 and Imfeld 2016). increase

    not well at all
    very well
    Climate-related extremes (disasters)
    heatwave

    not well at all
    very well

    Adoption and adaptation

    Percentage of land users in the area who have adopted the Technology
    • single cases/ experimental
    • 1-10%
    • 11-50%
    • > 50%
    Of all those who have adopted the Technology, how many have done so without receiving material incentives?
    • 0-10%
    • 11-50%
    • 51-90%
    • 91-100%
    Has the Technology been modified recently to adapt to changing conditions?
    • Yes
    • No
    To which changing conditions?
    • climatic change/ extremes
    • changing markets
    • labour availability (e.g. due to migration)
    Masai people have changed their livestock composition towards owning more smallstock (goats and sheep) than cattle. Goats are tolerant to drought, and as browsers they don't need grass. They can be turned into money much quicker than a cow in times of need. Their faster reproductive cycle means they can rebuild numbers faster than cattle after losses through drought.

    Conclusions and lessons learnt

    Strengths: land user's view
    • Everybody makes their own decision about their livestock (during the dry season). Owners stay in charge.
    • Grazing principles and plans lead to community control.
    • Traditional knowledge
    • Fewer costs
    • Less of effort (during the dry season no bunching of animals)
    • Fewer trees cut. During Holistic Management times many trees had to be cut to create two big bomas every month.
    • Can enrich land, livestock is tilling ground (seeds don't go away - kept in ground due to "tilling")
    Strengths: compiler’s or other key resource person’s view
    Weaknesses/ disadvantages/ risks: land user's viewhow to overcome
    • Brings in conflicts. If you start to protect and maintain your grass, thieves come in.
    • Spread of diseases when animals from different places with different diseases are brought together during the wet season
    Weaknesses/ disadvantages/ risks: compiler’s or other key resource person’s viewhow to overcome

    References

    Compiler
    • Michael Herger
    Editors
    Reviewer
    • Donia Mühlematter
    • Hanspeter Liniger
    • Rima Mekdaschi Studer
    • Alexandra Gavilano
    Date of documentation: July 21, 2017
    Last update: May 9, 2019
    Resource persons
    Full description in the WOCAT database
    Linked SLM data
    Documentation was faciliated by
    Institution Project
    Key references
    • Imfeld, N. (2016). Modeling Seasonal and Annual Precipitation using long-term Climate Records and Topography. MSc Thesis. University of Bern.: Online
    • Herger, M.B. (2018). Environmental Impacts of Red Meat Production. MSc Thesis. University of Bern.: University of Bern
    • Georgiadis, N.J., Olivero, I.N., Romanach, S.S. (2007). Savanna herbivore dynamics in a livestock-dominated landscape: I. Dependence on land use, rainfall, density, and time. Biology Conservation 137(3): 461-472.: Online
    This work is licensed under Creative Commons Attribution-NonCommercial-ShareaAlike 4.0 International