Grass strips (Uganda)

Omukikizo (Runyankore)

Description

Napier grass strips control soil erosion on annual and perennial cropland on moderately-angled to highly-angled slopes.

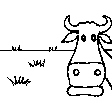
Napier grass is native to the tropical African savanna, where one cultivar is also known as Uganda grass or elephant grass. In Uganda, extensive natural Napier grasslands grew on the fringes of tropical forest until quite recently, the grass being used as mulch for coffee plantations and, later, banana plantations. Its use as cut fodder is more recent.

Napier grass strips as a conservation technology was introduced to members of Farmer Field Schools in Mwizi sub-county by Kagera TAMP field facilitators. Its extensive rhizomatous root system coupled with dense, leafy clumps makes it a quickly establishing vegetative technology against soil erosion by stabilizing the soil and checking surface runoff.

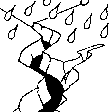
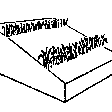
The technology is watershed oriented, with grass strips planted on the upper side of "Fanya Ju" trenches to enhance runoff checking and sediment retention. Mulching is also used to reduce direct impact of rain-drops that otherwise loosen the top soil and worsen the process of surface erosion. When established, grass strips form a continuous hedge along the contour, 0.5m to 1.0m high, regularly cut to provide fodder for livestock or for mulch. The strips are 10m apart.

Purpose of the Technology: The grass strips protect the land from surface erosion, progressively checking the speed of surface runoff, trapping sediment and increasing infiltration. Over time grass strips lead to the formation of terraces.

Establishment / maintenance activities and inputs: Napier grass is propagated from root splits, canes with 3 nodes or from whole canes. In the soil excavated from a shallow (0.30m to 0.60m) fanya ju trench, the planting material is planted 0.15m to 0.20m deep with splits planted upright, three node canes planted at an angle of 30-45 degrees while whole canes are buried in the furrow 0.60m to 0.90m apart. The root splits and canes are usually spaced 0.50m to 0.60m along the contour. Root splits generally take more labor to prepare and to plant but result in quicker establishment and earlier and higher forage yields. Once the crop is well-established the original planting material type generally has little effect strip characteristics.

The grass strips are maintained by regular harvesting to a height of o.3m or lower depending on the amount of rain.

Natural / human environment: Maintenance is simple and cheap. Hand hoes and pangas are the only tools used in establishment and maintenance. A little manual labor is all that is required for establishment and management. Stands can survive for decades when well-maintained, but because of its rapid growth and high yields, Napier grass requires regular application of nitrogen (N) phosphorus (P) and potassium (K) in the form of farm yard manure, readily available in Mwizi from the livestock that feed on the grass. While pests and diseases that attack the Napier grass exist, it has not yet been observed to be a problem.

Location

Location: Mbarara, Uganda, Uganda

No. of Technology sites analysed:

Geo-reference of selected sites
  • n.a.

Spread of the Technology: evenly spread over an area (approx. 1-10 km2)

In a permanently protected area?:

Date of implementation: less than 10 years ago (recently)

Type of introduction

Classification of the Technology

Main purpose
  • improve production
  • reduce, prevent, restore land degradation
  • conserve ecosystem
  • protect a watershed/ downstream areas – in combination with other Technologies
  • preserve/ improve biodiversity
  • reduce risk of disasters
  • adapt to climate change/ extremes and its impacts
  • mitigate climate change and its impacts
  • create beneficial economic impact
  • create beneficial social impact
Land use
Land use mixed within the same land unit: Yes - Agroforestry

  • Cropland
    • Annual cropping: legumes and pulses - beans, root/tuber crops - potatoes, casava, Napier grass/ Uganda grass/ Eplephant grass
    • Perennial (non-woody) cropping: banana/plantain/abaca
    Number of growing seasons per year: 2
  • Grazing land
  • Forest/ woodlands
Water supply
  • rainfed
  • mixed rainfed-irrigated
  • full irrigation

Purpose related to land degradation
  • prevent land degradation
  • reduce land degradation
  • restore/ rehabilitate severely degraded land
  • adapt to land degradation
  • not applicable
Degradation addressed
  • soil erosion by water - Wt: loss of topsoil/ surface erosion
SLM group
  • improved ground/ vegetation cover
  • cross-slope measure
SLM measures
  • vegetative measures - V2: Grasses and perennial herbaceous plants

Technical drawing

Technical specifications

Establishment and maintenance: activities, inputs and costs

Calculation of inputs and costs
  • Costs are calculated:
  • Currency used for cost calculation: Ug Shillings
  • Exchange rate (to USD): 1 USD = 2600.0 Ug Shillings
  • Average wage cost of hired labour per day: 0.70
Most important factors affecting the costs
There is cheap hired labour and the slope is not so steep
Establishment activities
  1. Cutting (Timing/ frequency: wet season)
  2. Transporting (Timing/ frequency: None)
  3. Planting (Timing/ frequency: None)
Establishment inputs and costs
Specify input Unit Quantity Costs per Unit (Ug Shillings) Total costs per input (Ug Shillings) % of costs borne by land users
Labour
Labour 200 7.0 100.0
Equipment
Tools 200m 1.0 2.0 2.0 100.0
Other
Grass cuttings 200m 1.0 8.0 8.0 100.0
Total costs for establishment of the Technology 10.0
Maintenance activities
  1. Slashing (Timing/ frequency: 2 times a year)
Maintenance inputs and costs
Specify input Unit Quantity Costs per Unit (Ug Shillings) Total costs per input (Ug Shillings) % of costs borne by land users
Labour
Labour 200 m 1.0 5.0 5.0
Equipment
Tools 200m 1.0 1.0 1.0
Total costs for maintenance of the Technology 6.0

Natural environment

Average annual rainfall
  • < 250 mm
  • 251-500 mm
  • 501-750 mm
  • 751-1,000 mm
  • 1,001-1,500 mm
  • 1,501-2,000 mm
  • 2,001-3,000 mm
  • 3,001-4,000 mm
  • > 4,000 mm
Agro-climatic zone
  • humid
  • sub-humid
  • semi-arid
  • arid
Specifications on climate
Recieved twice a year, March/June and September/January
Thermal climate class: tropics
Slope
  • flat (0-2%)
  • gentle (3-5%)
  • moderate (6-10%)
  • rolling (11-15%)
  • hilly (16-30%)
  • steep (31-60%)
  • very steep (>60%)
Landforms
  • plateau/plains
  • ridges
  • mountain slopes
  • hill slopes
  • footslopes
  • valley floors
Altitude
  • 0-100 m a.s.l.
  • 101-500 m a.s.l.
  • 501-1,000 m a.s.l.
  • 1,001-1,500 m a.s.l.
  • 1,501-2,000 m a.s.l.
  • 2,001-2,500 m a.s.l.
  • 2,501-3,000 m a.s.l.
  • 3,001-4,000 m a.s.l.
  • > 4,000 m a.s.l.
Technology is applied in
  • convex situations
  • concave situations
  • not relevant
Soil depth
  • very shallow (0-20 cm)
  • shallow (21-50 cm)
  • moderately deep (51-80 cm)
  • deep (81-120 cm)
  • very deep (> 120 cm)
Soil texture (topsoil)
  • coarse/ light (sandy)
  • medium (loamy, silty)
  • fine/ heavy (clay)
Soil texture (> 20 cm below surface)
  • coarse/ light (sandy)
  • medium (loamy, silty)
  • fine/ heavy (clay)
Topsoil organic matter content
  • high (>3%)
  • medium (1-3%)
  • low (<1%)
Groundwater table
  • on surface
  • < 5 m
  • 5-50 m
  • > 50 m
Availability of surface water
  • excess
  • good
  • medium
  • poor/ none
Water quality (untreated)
  • good drinking water
  • poor drinking water (treatment required)
  • for agricultural use only (irrigation)
  • unusable
Water quality refers to:
Is salinity a problem?
  • Yes
  • No

Occurrence of flooding
  • Yes
  • No
Species diversity
  • high
  • medium
  • low
Habitat diversity
  • high
  • medium
  • low

Characteristics of land users applying the Technology

Market orientation
  • subsistence (self-supply)
  • mixed (subsistence/ commercial)
  • commercial/ market
Off-farm income
  • less than 10% of all income
  • 10-50% of all income
  • > 50% of all income
Relative level of wealth
  • very poor
  • poor
  • average
  • rich
  • very rich
Level of mechanization
  • manual work
  • animal traction
  • mechanized/ motorized
Sedentary or nomadic
  • Sedentary
  • Semi-nomadic
  • Nomadic
Individuals or groups
  • individual/ household
  • groups/ community
  • cooperative
  • employee (company, government)
Gender
  • women
  • men
Age
  • children
  • youth
  • middle-aged
  • elderly
Area used per household
  • < 0.5 ha
  • 0.5-1 ha
  • 1-2 ha
  • 2-5 ha
  • 5-15 ha
  • 15-50 ha
  • 50-100 ha
  • 100-500 ha
  • 500-1,000 ha
  • 1,000-10,000 ha
  • > 10,000 ha
Scale
  • small-scale
  • medium-scale
  • large-scale
Land ownership
  • state
  • company
  • communal/ village
  • group
  • individual, not titled
  • individual, titled
Land use rights
  • open access (unorganized)
  • communal (organized)
  • leased
  • individual
Water use rights
  • open access (unorganized)
  • communal (organized)
  • leased
  • individual
Access to services and infrastructure
health

poor
x
good
education

poor
x
good
technical assistance

poor
x
good
employment (e.g. off-farm)

poor
x
good
markets

poor
x
good
energy

poor
x
good
roads and transport

poor
x
good
drinking water and sanitation

poor
x
good
financial services

poor
x
good

Impacts

Socio-economic impacts
Crop production
decreased
x
increased

Quantity before SLM: 200kg
Quantity after SLM: 1300kg
From improved yields people have increased suplus for sell and enough money to cater for family necesities

fodder production
decreased
x
increased


Introduction of zero grazing

fodder quality
decreased
x
increased

animal production
decreased
x
increased

risk of production failure
increased
x
decreased


There is crop failure close to strips

production area (new land under cultivation/ use)
decreased
x
increased


Grasses occupy are where crops would grow

farm income
decreased
x
increased

Quantity before SLM: 50000shs
Quantity after SLM: 75000shs

Competition
decreased
x
increased


Crop failure near gras strips (on the lower side)

Socio-cultural impacts
Ecological impacts
surface runoff
increased
x
decreased


Water speed was reduced

pest/ disease control
decreased
x
increased


They create hiding places for rats

Off-site impacts
damage on neighbours' fields
increased
x
reduced

Cost-benefit analysis

Benefits compared with establishment costs
Short-term returns
very negative
x
very positive

Long-term returns
very negative
x
very positive

Benefits compared with maintenance costs
Short-term returns
very negative
x
very positive

Long-term returns
very negative
x
very positive

Grasses are used to feed livestock and mulching. It requires low labour.

Climate change

Gradual climate change
annual temperature increase

not well at all
very well
Answer: not known
Climate-related extremes (disasters)
local rainstorm

not well at all
x
very well
local windstorm

not well at all
very well
Answer: not known
drought

not well at all
x
very well
general (river) flood

not well at all
very well
Answer: not known

Adoption and adaptation

Percentage of land users in the area who have adopted the Technology
  • single cases/ experimental
  • 1-10%
  • 11-50%
  • > 50%
Of all those who have adopted the Technology, how many have done so without receiving material incentives?
  • 0-10%
  • 11-50%
  • 51-90%
  • 91-100%
Number of households and/ or area covered
10
Has the Technology been modified recently to adapt to changing conditions?
  • Yes
  • No
To which changing conditions?
  • climatic change/ extremes
  • changing markets
  • labour availability (e.g. due to migration)

Conclusions and lessons learnt

Strengths: land user's view
Strengths: compiler’s or other key resource person’s view
  • Land users are already sensitized

    How can they be sustained / enhanced? Continuous sensitization
  • There is high demand for animal feed and mulching

    How can they be sustained / enhanced? Estabkish more grass strips
  • Planting materials are available

    How can they be sustained / enhanced? Leaving some grasses to overgrow
Weaknesses/ disadvantages/ risks: land user's viewhow to overcome
Weaknesses/ disadvantages/ risks: compiler’s or other key resource person’s viewhow to overcome
  • Low adoption of the technology setting demonstrations
  • Low turn up at training sessions Forining farmer groups like Farmer field schools

References

Compiler
  • Wilson Bamwerinde
Editors
Reviewer
  • Fabian Ottiger
  • Alexandra Gavilano
Date of documentation: April 18, 2013
Last update: Aug. 10, 2019
Resource persons
Full description in the WOCAT database
Linked SLM data
Documentation was faciliated by
Institution Project
This work is licensed under Creative Commons Attribution-NonCommercial-ShareaAlike 4.0 International