Conservation tillage in UK arable cropping systems: Tivington
(United Kingdom)
non-inversion tillage (eng); minimum tillage (eng), conservation agriculture (eng)
Description
Surface cultivation of up to the top 10cm of soil but not complete inversion
Machinery with discs or tines replace the plough for minimal cultivations of the soil. Equally crops may be established by no-tillage/ zero-tillage.
Purpose of the Technology: (i) soil protection (ii) improved crop establishment particularly through the speeding up of of operations.
Establishment / maintenance activities and inputs: appropriate machinery, soil condition and following crop all determine establishment. Maintenance: on an annual basis.
Natural / human environment: SOWAP (ww.sowap.org) project working with farmer to protect environment and maintain economic viability
Location
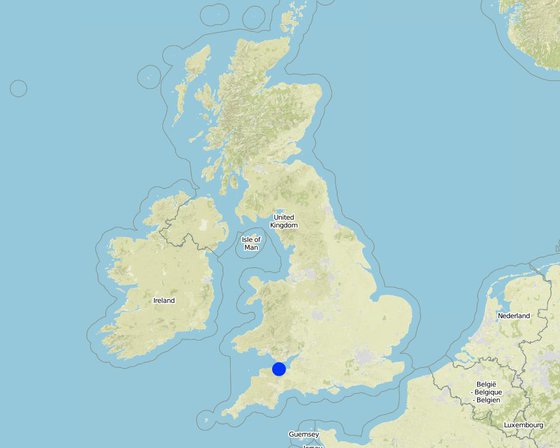
Location: Minehead, Somerset, United Kingdom
No. of Technology sites analysed:
Geo-reference of selected sites
Spread of the Technology:
In a permanently protected area?:
Date of implementation:
Type of introduction
-
through land users' innovation
-
as part of a traditional system (> 50 years)
-
during experiments/ research
-
through projects/ external interventions

beans emerging through previous crop residue
Classification of the Technology
Main purpose
-
improve production
-
reduce, prevent, restore land degradation
-
conserve ecosystem
-
protect a watershed/ downstream areas – in combination with other Technologies
-
preserve/ improve biodiversity
-
reduce risk of disasters
-
adapt to climate change/ extremes and its impacts
-
mitigate climate change and its impacts
-
create beneficial economic impact
-
create beneficial social impact
Land use
-
Cropland
- Annual cropping: cereals - wheat (spring), oilseed crops - sunflower, rapeseed, other
Number of growing seasons per year: 1
Water supply
-
rainfed
-
mixed rainfed-irrigated
-
full irrigation
Purpose related to land degradation
-
prevent land degradation
-
reduce land degradation
-
restore/ rehabilitate severely degraded land
-
adapt to land degradation
-
not applicable
Degradation addressed
-
soil erosion by water - Wt: loss of topsoil/ surface erosion, Wo: offsite degradation effects
-
physical soil deterioration - Pk: slaking and crusting
SLM measures
-
agronomic measures - A1: Vegetation/ soil cover, A3: Soil surface treatment (A 3.1: No tillage)
Technical drawing
Technical specifications
Establishment and maintenance: activities, inputs and costs
Calculation of inputs and costs
- Costs are calculated:
- Currency used for cost calculation: £
- Exchange rate (to USD): 1 USD = 0.56 £
- Average wage cost of hired labour per day: n.a
Most important factors affecting the costs
slope (steeper slopes require more horsepower), state of the soil, climate, crop
Establishment activities
n.a.
Maintenance activities
-
Year1: light cultivation with discs (Timing/ frequency: 3rd-4th week in August / per crop)
-
Year1: spray with non-selective herbicide (glyphosate) (Timing/ frequency: late August/ early September / per crop)
-
Year1: drill (Timing/ frequency: late August/ early September, 3-4 days after spraying / per crop)
-
Year1: roll (optional) (Timing/ frequency: after drilling / per crop)
Maintenance inputs and costs
| Specify input |
Unit |
Quantity |
Costs per Unit (£) |
Total costs per input (£) |
% of costs borne by land users |
|
Equipment
|
| Equipment (year1) machine hour |
ha |
1.0 |
148.0 |
148.0 |
100.0 |
| Equipment (year2) machine hour |
ha |
1.0 |
166.0 |
166.0 |
100.0 |
| Equipment (year3) machine hour |
ha |
1.0 |
113.0 |
113.0 |
100.0 |
| Total costs for maintenance of the Technology |
427.0 |
|
| Total costs for maintenance of the Technology in USD |
762.5 |
|
Natural environment
Average annual rainfall
-
< 250 mm
-
251-500 mm
-
501-750 mm
-
751-1,000 mm
-
1,001-1,500 mm
-
1,501-2,000 mm
-
2,001-3,000 mm
-
3,001-4,000 mm
-
> 4,000 mm
Agro-climatic zone
-
humid
-
sub-humid
-
semi-arid
-
arid
Specifications on climate
Average annual rainfall in mm: 800.0
Slope
-
flat (0-2%)
-
gentle (3-5%)
-
moderate (6-10%)
-
rolling (11-15%)
-
hilly (16-30%)
-
steep (31-60%)
-
very steep (>60%)
Landforms
-
plateau/plains
-
ridges
-
mountain slopes
-
hill slopes
-
footslopes
-
valley floors
Altitude
-
0-100 m a.s.l.
-
101-500 m a.s.l.
-
501-1,000 m a.s.l.
-
1,001-1,500 m a.s.l.
-
1,501-2,000 m a.s.l.
-
2,001-2,500 m a.s.l.
-
2,501-3,000 m a.s.l.
-
3,001-4,000 m a.s.l.
-
> 4,000 m a.s.l.
Technology is applied in
-
convex situations
-
concave situations
-
not relevant
Soil depth
-
very shallow (0-20 cm)
-
shallow (21-50 cm)
-
moderately deep (51-80 cm)
-
deep (81-120 cm)
-
very deep (> 120 cm)
Soil texture (topsoil)
-
coarse/ light (sandy)
-
medium (loamy, silty)
-
fine/ heavy (clay)
Soil texture (> 20 cm below surface)
-
coarse/ light (sandy)
-
medium (loamy, silty)
-
fine/ heavy (clay)
Topsoil organic matter content
-
high (>3%)
-
medium (1-3%)
-
low (<1%)
Groundwater table
-
on surface
-
< 5 m
-
5-50 m
-
> 50 m
Availability of surface water
-
excess
-
good
-
medium
-
poor/ none
Water quality (untreated)
-
good drinking water
-
poor drinking water (treatment required)
-
for agricultural use only (irrigation)
-
unusable
Is salinity a problem?
Occurrence of flooding
Characteristics of land users applying the Technology
Market orientation
-
subsistence (self-supply)
-
mixed (subsistence/ commercial)
-
commercial/ market
Off-farm income
-
less than 10% of all income
-
10-50% of all income
-
> 50% of all income
Relative level of wealth
-
very poor
-
poor
-
average
-
rich
-
very rich
Level of mechanization
-
manual work
-
animal traction
-
mechanized/ motorized
Sedentary or nomadic
-
Sedentary
-
Semi-nomadic
-
Nomadic
Individuals or groups
-
individual/ household
-
groups/ community
-
cooperative
-
employee (company, government)
Age
-
children
-
youth
-
middle-aged
-
elderly
Area used per household
-
< 0.5 ha
-
0.5-1 ha
-
1-2 ha
-
2-5 ha
-
5-15 ha
-
15-50 ha
-
50-100 ha
-
100-500 ha
-
500-1,000 ha
-
1,000-10,000 ha
-
> 10,000 ha
Scale
-
small-scale
-
medium-scale
-
large-scale
Land ownership
-
state
-
company
-
communal/ village
-
group
-
individual, not titled
-
individual, titled
-
Other
Land use rights
-
open access (unorganized)
-
communal (organized)
-
leased
-
individual
Water use rights
-
open access (unorganized)
-
communal (organized)
-
leased
-
individual
Access to services and infrastructure
Impacts
Socio-economic impacts
Crop production
perhaps most significant in early years
expenses on agricultural inputs
Possible increasing herbicide costs
workload
Timing of operations critical
Preparation for new legislation
CAP reform, Soil Action Plan for England, EU Water Framework directive
Timeliness
operation twice as quick as ploughing
Socio-cultural impacts
Acceptance by society
Age differences: Tends to be taken up by younger farmers
Ecological impacts
animal diversity
More earthworms compared to land that has been ploughed
pest/ disease control
Quantity before SLM: 0.01
Quantity after SLM: 0
Cost-benefit analysis
Benefits compared with establishment costs
Short-term returns
very negative
very positive
Long-term returns
very negative
very positive
Benefits compared with maintenance costs
Short-term returns
very negative
very positive
Long-term returns
very negative
very positive
Adoption and adaptation
Percentage of land users in the area who have adopted the Technology
-
single cases/ experimental
-
1-10%
-
11-50%
-
> 50%
Of all those who have adopted the Technology, how many have done so without receiving material incentives?
-
0-10%
-
11-50%
-
51-90%
-
91-100%
Has the Technology been modified recently to adapt to changing conditions?
To which changing conditions?
-
climatic change/ extremes
-
changing markets
-
labour availability (e.g. due to migration)
Conclusions and lessons learnt
Strengths: land user's view
-
ncreased work rate making operations quicker
-
Better trafficability
-
Less at risk of weather
-
Earlier drilling. It is a systems approach - minimum tillage combined with early drilling and low seed rates
Strengths: compiler’s or other key resource person’s view
-
Increased work rate and cost effectiveness
-
Improved soil organic matter
-
Imrpoved water quality
-
Improved soil biodiversity
Weaknesses/ disadvantages/ risks: land user's viewhow to overcome
-
Dependent on dry weather
Co-operation with other farmers or larger acreage
-
Machinery more complex and expensive
A combination of crop rotation, pesticides and stale seedbeds
-
Increasing grass weed populations
Does not necessarily mean spending money eg utilising old equipment on farm like subsoilers. However, need the right attitude
-
Need to be experimental
Accept advice for varying sources, talk to different people
-
Advice can be fragmented/ confusing
Weaknesses/ disadvantages/ risks: compiler’s or other key resource person’s viewhow to overcome
-
Technological knowledge of farmer
Training and education, dissemination
-
Initial high capital investment
Extended finance
-
Possible increasing weed populations
More diverse management options - cultural and chemical
-
Need to expand acreage to cover capital costs
More diverse crop rotation but perhaps this is insufficient to retain economic viability
References
Reviewer
-
Deborah Niggli
-
Alexandra Gavilano
Date of documentation: Feb. 24, 2011
Last update: Aug. 11, 2019
Resource persons
-
Ceris A. Jones - SLM specialist
-
Jo Oborn - SLM specialist
Full description in the WOCAT database
Documentation was faciliated by
Institution
- Farmin & wildlife advisory group (FWAG) - United Kingdom
Project
- Soil and water protection (EU-SOWAP)
Key references
-
FWAG (Farming and Wildlife Advisory group): www.fwag.org.uk
Links to relevant information which is available online


