Non-inversion tillage in UK arable cropping; Loddington
(United Kingdom)
minimum tillage (English), conservation tillage (English)
Description
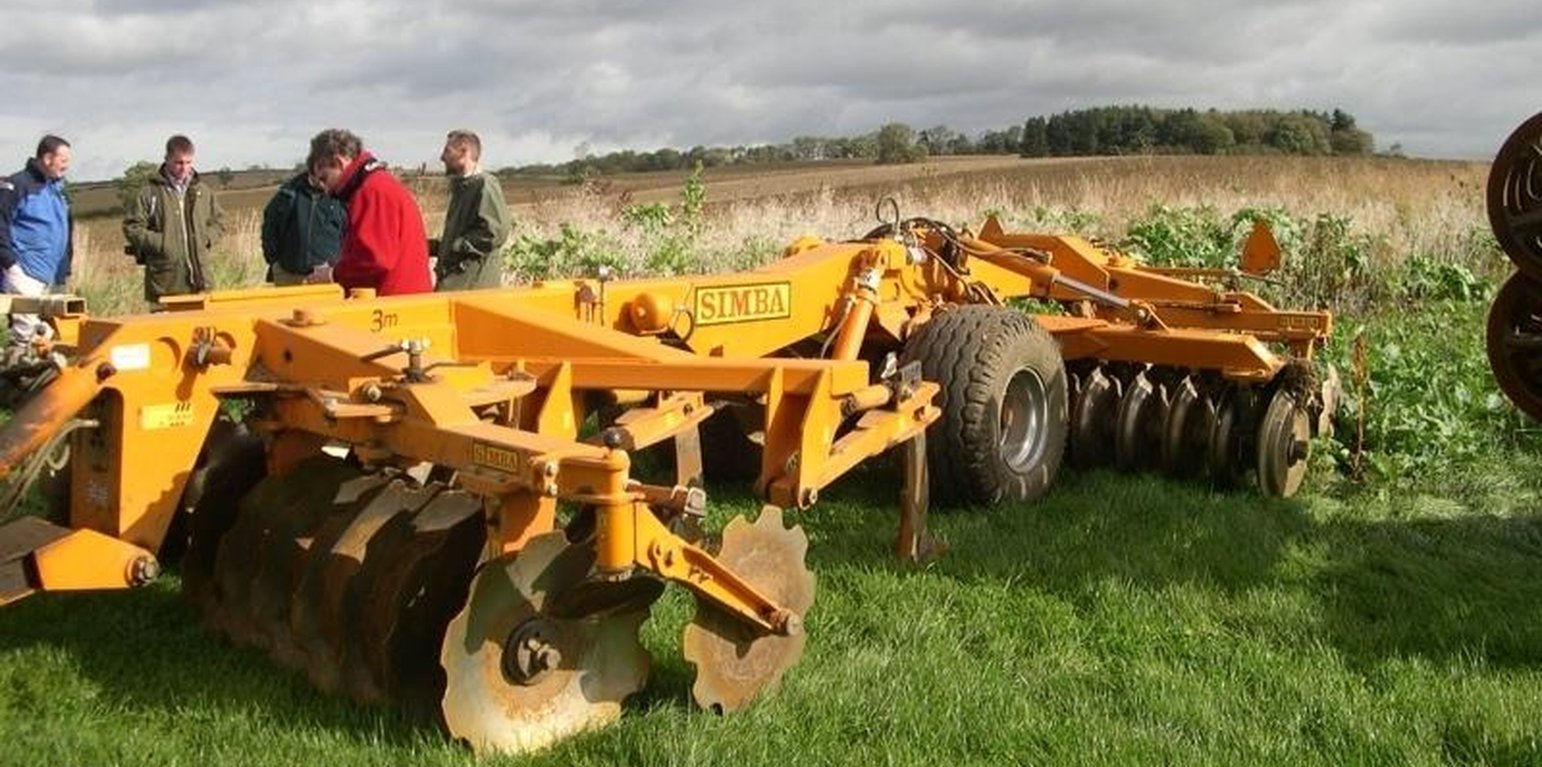
Surface cultivation of the top 10cm of soil but not complete inversion
machinery with discs or tines replace the plough.
Purpose of the Technology: (i) improved crop establishment particularly by speeding up of operations (ii) improved soil structure.
Establishment / maintenance activities and inputs: appropriate machinery, soil condition and following crop all determine establishment.
Maintenance: on an annual basis.
Natural / human environment: farmer working to protect environment and maintain rural employment
Location
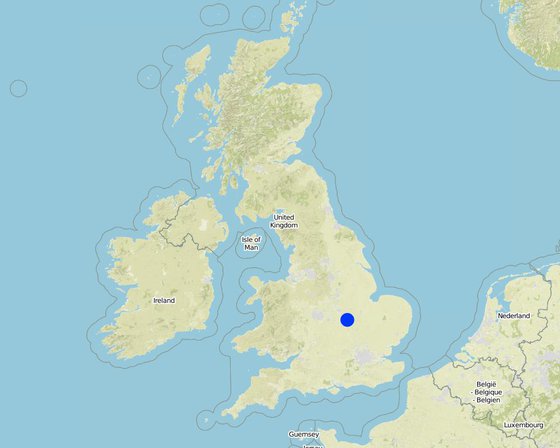
Location: Loddington, Leicestershire, United Kingdom
No. of Technology sites analysed:
Geo-reference of selected sites
Spread of the Technology:
In a permanently protected area?:
Date of implementation:
Type of introduction
-
through land users' innovation
-
as part of a traditional system (> 50 years)
-
during experiments/ research
-
through projects/ external interventions
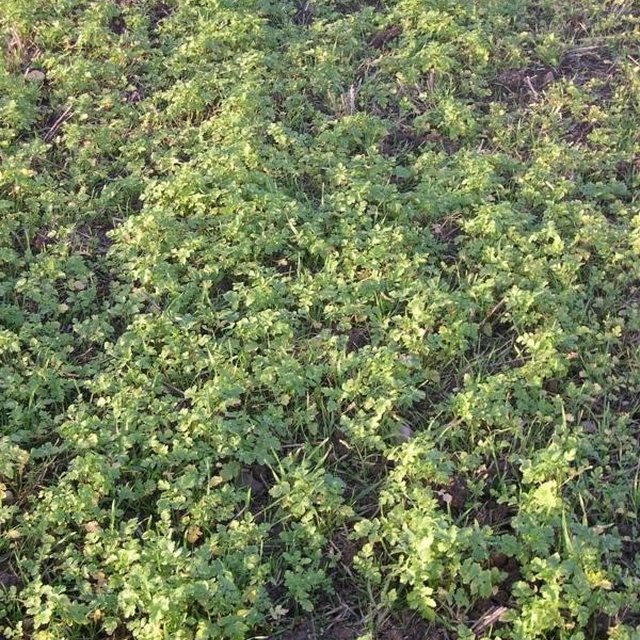
Cover crop of mustard and rye on SOWAP plot Oct04 (Ceris Jones (UK))
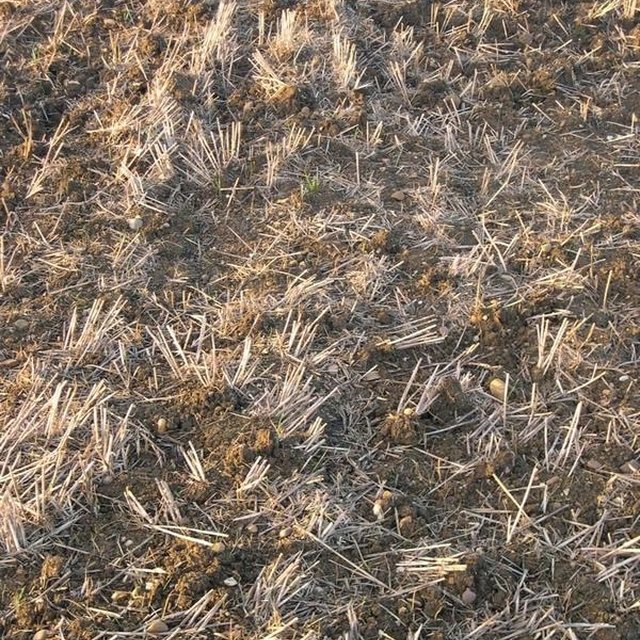
Soil surface showing partially incorporated residue
Classification of the Technology
Main purpose
-
improve production
-
reduce, prevent, restore land degradation
-
conserve ecosystem
-
protect a watershed/ downstream areas – in combination with other Technologies
-
preserve/ improve biodiversity
-
reduce risk of disasters
-
adapt to climate change/ extremes and its impacts
-
mitigate climate change and its impacts
-
create beneficial economic impact
-
create beneficial social impact
Land use
-
Cropland
- Annual cropping: cereals - other, cereals - wheat (spring), legumes and pulses - beans, oilseed crops - sunflower, rapeseed, other
Number of growing seasons per year: 1
Water supply
-
rainfed
-
mixed rainfed-irrigated
-
full irrigation
Purpose related to land degradation
-
prevent land degradation
-
reduce land degradation
-
restore/ rehabilitate severely degraded land
-
adapt to land degradation
-
not applicable
Degradation addressed
-
soil erosion by water - Wt: loss of topsoil/ surface erosion, Wo: offsite degradation effects
-
chemical soil deterioration - Cn: fertility decline and reduced organic matter content (not caused by erosion)
-
physical soil deterioration - Pc: compaction
Technical drawing
Technical specifications
Establishment and maintenance: activities, inputs and costs
Calculation of inputs and costs
- Costs are calculated:
- Currency used for cost calculation: UK pounds (£)
- Exchange rate (to USD): 1 USD = 0.56 UK pounds (£)
- Average wage cost of hired labour per day: 155.00
Most important factors affecting the costs
Equipment costs, slope (higher horse power required for steeper slopes), presence of weeds (higher herbicide costs),
Establishment activities
n.a.
Maintenance activities
-
Year1: chop straw as low to the ground as possible (Timing/ frequency: at harvest (usually August) / annual)
-
Year1: incorporate straw to 10cm depth, though this is dependent on density of straw (Timing/ frequency: September / per crop)
-
Year1: additional cultivation (Timing/ frequency: early October / per crop)
-
Year1:drilling (4cm depth) (Timing/ frequency: early October / once per crop)
-
Year1: consolidation (more in Annex 3) (Timing/ frequency: early October / once per crop)
Maintenance inputs and costs
| Specify input |
Unit |
Quantity |
Costs per Unit (UK pounds (£)) |
Total costs per input (UK pounds (£)) |
% of costs borne by land users |
|
Equipment
|
| Machine use |
ha |
1.0 |
204.0 |
204.0 |
100.0 |
| Machine hours (year 2) |
ha |
1.0 |
184.0 |
184.0 |
100.0 |
| Machine hours (year 3) |
ha |
1.0 |
236.0 |
236.0 |
100.0 |
| Total costs for maintenance of the Technology |
624.0 |
|
| Total costs for maintenance of the Technology in USD |
1'114.29 |
|
Natural environment
Average annual rainfall
-
< 250 mm
-
251-500 mm
-
501-750 mm
-
751-1,000 mm
-
1,001-1,500 mm
-
1,501-2,000 mm
-
2,001-3,000 mm
-
3,001-4,000 mm
-
> 4,000 mm
Agro-climatic zone
-
humid
-
sub-humid
-
semi-arid
-
arid
Specifications on climate
Average annual rainfall in mm: 660.0
Slope
-
flat (0-2%)
-
gentle (3-5%)
-
moderate (6-10%)
-
rolling (11-15%)
-
hilly (16-30%)
-
steep (31-60%)
-
very steep (>60%)
Landforms
-
plateau/plains
-
ridges
-
mountain slopes
-
hill slopes
-
footslopes
-
valley floors
Altitude
-
0-100 m a.s.l.
-
101-500 m a.s.l.
-
501-1,000 m a.s.l.
-
1,001-1,500 m a.s.l.
-
1,501-2,000 m a.s.l.
-
2,001-2,500 m a.s.l.
-
2,501-3,000 m a.s.l.
-
3,001-4,000 m a.s.l.
-
> 4,000 m a.s.l.
Technology is applied in
-
convex situations
-
concave situations
-
not relevant
Soil depth
-
very shallow (0-20 cm)
-
shallow (21-50 cm)
-
moderately deep (51-80 cm)
-
deep (81-120 cm)
-
very deep (> 120 cm)
Soil texture (topsoil)
-
coarse/ light (sandy)
-
medium (loamy, silty)
-
fine/ heavy (clay)
Soil texture (> 20 cm below surface)
-
coarse/ light (sandy)
-
medium (loamy, silty)
-
fine/ heavy (clay)
Topsoil organic matter content
-
high (>3%)
-
medium (1-3%)
-
low (<1%)
Groundwater table
-
on surface
-
< 5 m
-
5-50 m
-
> 50 m
Availability of surface water
-
excess
-
good
-
medium
-
poor/ none
Water quality (untreated)
-
good drinking water
-
poor drinking water (treatment required)
-
for agricultural use only (irrigation)
-
unusable
Is salinity a problem?
Occurrence of flooding
Characteristics of land users applying the Technology
Market orientation
-
subsistence (self-supply)
-
mixed (subsistence/ commercial)
-
commercial/ market
Off-farm income
-
less than 10% of all income
-
10-50% of all income
-
> 50% of all income
Relative level of wealth
-
very poor
-
poor
-
average
-
rich
-
very rich
Level of mechanization
-
manual work
-
animal traction
-
mechanized/ motorized
Sedentary or nomadic
-
Sedentary
-
Semi-nomadic
-
Nomadic
Individuals or groups
-
individual/ household
-
groups/ community
-
cooperative
-
employee (company, government)
Age
-
children
-
youth
-
middle-aged
-
elderly
Area used per household
-
< 0.5 ha
-
0.5-1 ha
-
1-2 ha
-
2-5 ha
-
5-15 ha
-
15-50 ha
-
50-100 ha
-
100-500 ha
-
500-1,000 ha
-
1,000-10,000 ha
-
> 10,000 ha
Scale
-
small-scale
-
medium-scale
-
large-scale
Land ownership
-
state
-
company
-
communal/ village
-
group
-
individual, not titled
-
individual, titled
-
Trust
Land use rights
-
open access (unorganized)
-
communal (organized)
-
leased
-
individual
-
Trust
Water use rights
-
open access (unorganized)
-
communal (organized)
-
leased
-
individual
-
Trust
Access to services and infrastructure
Impacts
Socio-economic impacts
Crop production
In good (weather) conditions, yields from ploughed fields often better
timeliness of operations
Speed of working allows larger acreage to be managed
Input constraints
herbicide resistance is increasing in a number of weed species therefore a better range of herbicide options required
Window of operation
Can be more narrow than when ploughing
Ecological impacts
excess water drainage
Better infiltration of water
soil moisture
Better germination in dry years
soil loss
Quantity before SLM: 0.01
Quantity after SLM: 0
Better soil structure
Maintenance of rural employment
enabled the farm to just about support the land manager and farm worker
Biodiversity enhancement
Higher bird and invertebrate numbers
Off-site impacts
reliable and stable stream flows in dry season (incl. low flows)
downstream flooding (undesired)
groundwater/ river pollution
Fertilisers and pesticides not transported with eroded soil, better soil structure + biodiversity slow + improve metabolism of chemicals in the soil
Cost-benefit analysis
Benefits compared with establishment costs
Short-term returns
very negative
very positive
Long-term returns
very negative
very positive
Benefits compared with maintenance costs
Short-term returns
very negative
very positive
Long-term returns
very negative
very positive
Adoption and adaptation
Percentage of land users in the area who have adopted the Technology
-
single cases/ experimental
-
1-10%
-
11-50%
-
> 50%
Of all those who have adopted the Technology, how many have done so without receiving material incentives?
-
0-10%
-
11-50%
-
51-90%
-
91-100%
Has the Technology been modified recently to adapt to changing conditions?
To which changing conditions?
-
climatic change/ extremes
-
changing markets
-
labour availability (e.g. due to migration)
Conclusions and lessons learnt
Strengths: land user's view
-
Timely crop establishment + good work rate
How can they be sustained / enhanced? good planning
-
Lower costs
How can they be sustained / enhanced? Increased acreage to spread costs
-
Increased contractor income
How can they be sustained / enhanced? as above
-
improved soil structure - higher organic matter and provision of a better seed bed to drill into
How can they be sustained / enhanced? continue with practice
Strengths: compiler’s or other key resource person’s view
-
cost effectiveness
How can they be sustained / enhanced? increase ares under cultivation (economy of scale)
-
increased work rate
-
improved soil quality
How can they be sustained / enhanced? continuation of current soil management principles
-
increased biodiversity
How can they be sustained / enhanced? price premium for biodiversity-friendly products
-
improved water quality
How can they be sustained / enhanced? no option. The EU Water Framework Directive requires watercourses to be of good status by 2015
Weaknesses/ disadvantages/ risks: land user's viewhow to overcome
-
narrow weather window
drill non-inversion tillage fields first
-
grass weeds
crop rotation; new herbicide modes of action
-
slug management
monitoring slug populations
-
large acreage required to justify cost of machinery
consider not cropping headlands
Weaknesses/ disadvantages/ risks: compiler’s or other key resource person’s viewhow to overcome
-
Grass weed control
New herbicide modes of action, more integrated management options
-
Untidy appearance of field (due to crop residue)
Familiarity with the technology
References
Reviewer
-
Fabian Ottiger
-
Alexandra Gavilano
Date of documentation: Feb. 24, 2011
Last update: Aug. 11, 2019
Resource persons
-
Ceris A. Jones - SLM specialist
-
Alastaire Leake - SLM specialist
Full description in the WOCAT database
Documentation was faciliated by
Institution
- Game & Wildlife Conservation Trust - United Kingdom
Project
- Soil and water protection (EU-SOWAP)
Key references
-
Guide to managing crop establishment, SMI: www.smi.org.uk
-
Improved soil management for agronomic and environmental gain, SMI: www.smi.org.uk
-
ECAF website: www.sowap.org