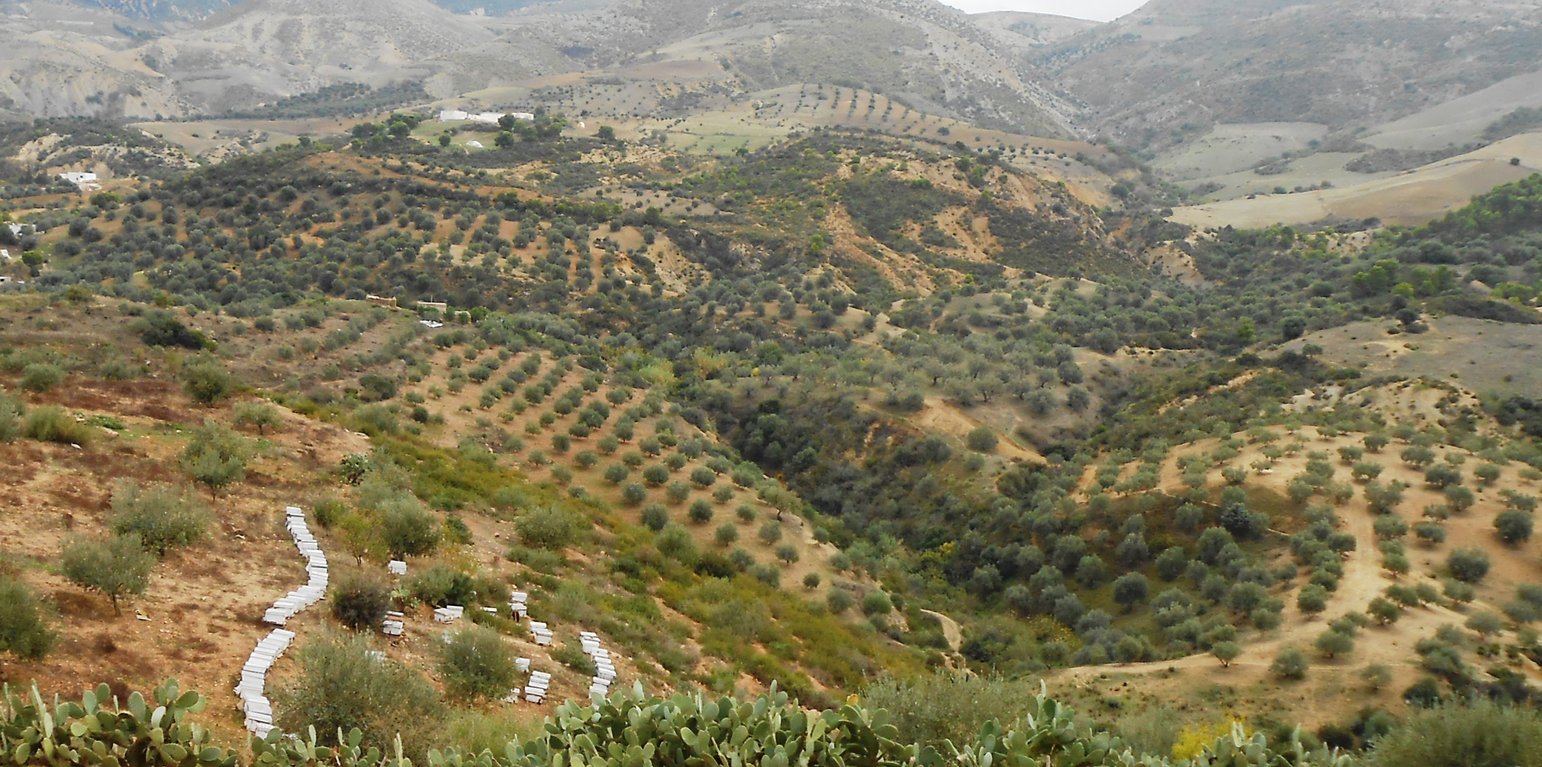
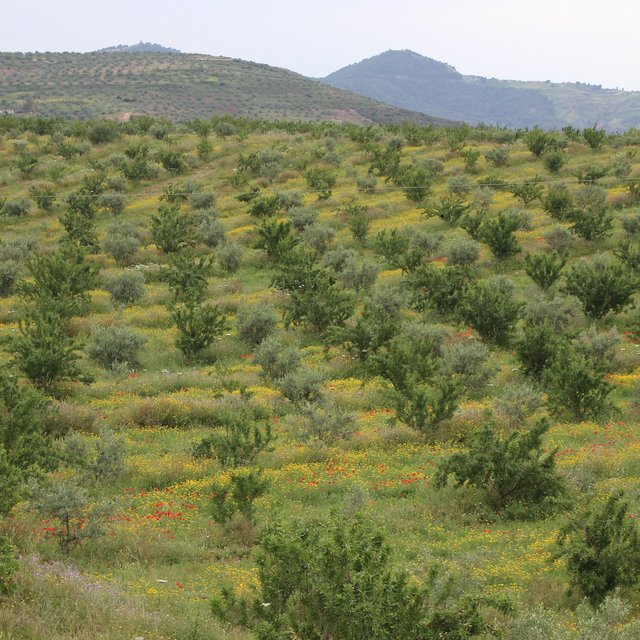
Le système agroforestier dans les zones montagneuses au Nord Ouest Tunisien. (ODESYPANO)
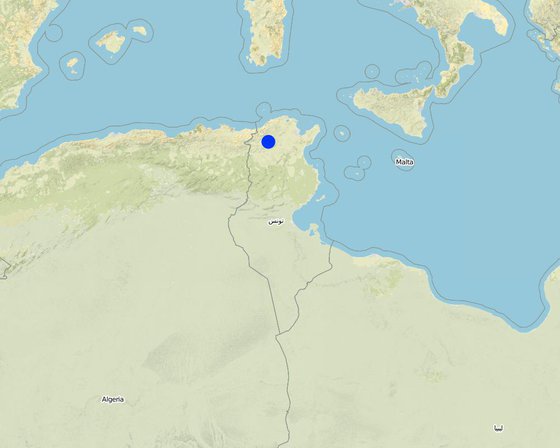
Le système d’Agroforesterie pour la protection des terres et l'amélioration des revenus des exploitants dans les zones montagneuses.de Nord Ouest Tunisien (Tunisia)

Agroforesterie

Description

Location

Location: Tunisia

No. of Technology sites analysed: single site

Geo-reference of selected sites
  • 9.10585, 36.52629

Spread of the Technology: evenly spread over an area (approx. 0.1-1 km2)

In a permanently protected area?:

Date of implementation: 10-50 years ago

Type of introduction
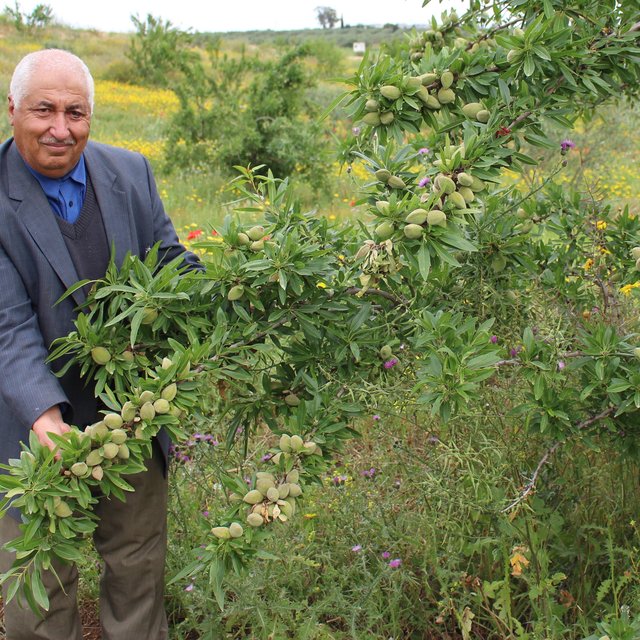
-
-

Classification of the Technology

Main purpose
  • improve production
  • reduce, prevent, restore land degradation
  • conserve ecosystem
  • protect a watershed/ downstream areas – in combination with other Technologies
  • preserve/ improve biodiversity
  • reduce risk of disasters
  • adapt to climate change/ extremes and its impacts
  • mitigate climate change and its impacts
  • create beneficial economic impact
  • create beneficial social impact
Land use
Land use mixed within the same land unit: Yes - Agroforestry

  • CroplandNumber of growing seasons per year: 1
  • Grazing land
    • Ranching
    • Cut-and-carry/ zero grazing
  • Forest/ woodlands

Water supply
  • rainfed
  • mixed rainfed-irrigated
  • full irrigation

Purpose related to land degradation
  • prevent land degradation
  • reduce land degradation
  • restore/ rehabilitate severely degraded land
  • adapt to land degradation
  • not applicable
Degradation addressed
  • soil erosion by water - Wt: loss of topsoil/ surface erosion
  • chemical soil deterioration - Cn: fertility decline and reduced organic matter content (not caused by erosion)
  • physical soil deterioration - Pc: compaction
  • biological degradation - Bc: reduction of vegetation cover
SLM group
  • agroforestry
  • integrated crop-livestock management
  • improved ground/ vegetation cover
SLM measures
  • agronomic measures - A1: Vegetation/ soil cover, A3: Soil surface treatment
  • vegetative measures - V1: Tree and shrub cover
  • management measures - M1: Change of land use type, M2: Change of management/ intensity level, M7: Others

Technical drawing

Technical specifications

Establishment and maintenance: activities, inputs and costs

Calculation of inputs and costs
  • Costs are calculated: per Technology area
  • Currency used for cost calculation: n.a.
  • Exchange rate (to USD): 1 USD = 2.45
  • Average wage cost of hired labour per day: n.a
Most important factors affecting the costs
n.a.
Establishment activities
  1. (Timing/ frequency: None)
  2. (Timing/ frequency: None)
  3. (Timing/ frequency: None)
Establishment inputs and costs
Specify input Unit Quantity Costs per Unit (n.a.) Total costs per input (n.a.) % of costs borne by land users
Labour
100.0 3.0 300.0 100.0
Equipment
100.0 2.0 200.0
Plant material
100.0 2.2 220.0
Fertilizers and biocides
3.0 50.0 150.0 100.0
Total costs for establishment of the Technology 870.0
Maintenance activities
  1. (Timing/ frequency: None)
  2. (Timing/ frequency: None)
  3. (Timing/ frequency: None)
  4. (Timing/ frequency: None)
  5. (Timing/ frequency: None)
  6. (Timing/ frequency: None)
  7. (Timing/ frequency: None)
Maintenance inputs and costs
Specify input Unit Quantity Costs per Unit (n.a.) Total costs per input (n.a.) % of costs borne by land users
Labour
100.0 2.0 200.0 100.0
100.0 1.0 100.0 100.0
Equipment
2.0 25.0 50.0 100.0
Fertilizers and biocides
1.0 50.0 50.0 100.0
Total costs for maintenance of the Technology 400.0

Natural environment

Average annual rainfall
  • < 250 mm
  • 251-500 mm
  • 501-750 mm
  • 751-1,000 mm
  • 1,001-1,500 mm
  • 1,501-2,000 mm
  • 2,001-3,000 mm
  • 3,001-4,000 mm
  • > 4,000 mm
Agro-climatic zone
  • humid
  • sub-humid
  • semi-arid
  • arid
Specifications on climate
n.a.
Slope
  • flat (0-2%)
  • gentle (3-5%)
  • moderate (6-10%)
  • rolling (11-15%)
  • hilly (16-30%)
  • steep (31-60%)
  • very steep (>60%)
Landforms
  • plateau/plains
  • ridges
  • mountain slopes
  • hill slopes
  • footslopes
  • valley floors
Altitude
  • 0-100 m a.s.l.
  • 101-500 m a.s.l.
  • 501-1,000 m a.s.l.
  • 1,001-1,500 m a.s.l.
  • 1,501-2,000 m a.s.l.
  • 2,001-2,500 m a.s.l.
  • 2,501-3,000 m a.s.l.
  • 3,001-4,000 m a.s.l.
  • > 4,000 m a.s.l.
Technology is applied in
  • convex situations
  • concave situations
  • not relevant
Soil depth
  • very shallow (0-20 cm)
  • shallow (21-50 cm)
  • moderately deep (51-80 cm)
  • deep (81-120 cm)
  • very deep (> 120 cm)
Soil texture (topsoil)
  • coarse/ light (sandy)
  • medium (loamy, silty)
  • fine/ heavy (clay)
Soil texture (> 20 cm below surface)
  • coarse/ light (sandy)
  • medium (loamy, silty)
  • fine/ heavy (clay)
Topsoil organic matter content
  • high (>3%)
  • medium (1-3%)
  • low (<1%)
Groundwater table
  • on surface
  • < 5 m
  • 5-50 m
  • > 50 m
Availability of surface water
  • excess
  • good
  • medium
  • poor/ none
Water quality (untreated)
  • good drinking water
  • poor drinking water (treatment required)
  • for agricultural use only (irrigation)
  • unusable
Water quality refers to:
Is salinity a problem?
  • Yes
  • No

Occurrence of flooding
  • Yes
  • No
Species diversity
  • high
  • medium
  • low
Habitat diversity
  • high
  • medium
  • low

Characteristics of land users applying the Technology

Market orientation
  • subsistence (self-supply)
  • mixed (subsistence/ commercial)
  • commercial/ market
Off-farm income
  • less than 10% of all income
  • 10-50% of all income
  • > 50% of all income
Relative level of wealth
  • very poor
  • poor
  • average
  • rich
  • very rich
Level of mechanization
  • manual work
  • animal traction
  • mechanized/ motorized
Sedentary or nomadic
  • Sedentary
  • Semi-nomadic
  • Nomadic
Individuals or groups
  • individual/ household
  • groups/ community
  • cooperative
  • employee (company, government)
Gender
  • women
  • men
Age
  • children
  • youth
  • middle-aged
  • elderly
Area used per household
  • < 0.5 ha
  • 0.5-1 ha
  • 1-2 ha
  • 2-5 ha
  • 5-15 ha
  • 15-50 ha
  • 50-100 ha
  • 100-500 ha
  • 500-1,000 ha
  • 1,000-10,000 ha
  • > 10,000 ha
Scale
  • small-scale
  • medium-scale
  • large-scale
Land ownership
  • state
  • company
  • communal/ village
  • group
  • individual, not titled
  • individual, titled
Land use rights
  • open access (unorganized)
  • communal (organized)
  • leased
  • individual
Water use rights
  • open access (unorganized)
  • communal (organized)
  • leased
  • individual
Access to services and infrastructure
health

poor
good
education

poor
good
technical assistance

poor
good
employment (e.g. off-farm)

poor
good
markets

poor
good
energy

poor
good
roads and transport

poor
good
drinking water and sanitation

poor
good
financial services

poor
good

Impacts

Socio-economic impacts
Crop production
decreased
increased

crop quality
decreased
increased

fodder production
decreased
increased

fodder quality
decreased
increased

animal production
decreased
increased

risk of production failure
increased
decreased

product diversity
decreased
increased

production area (new land under cultivation/ use)
decreased
increased

land management
hindered
simplified

expenses on agricultural inputs
increased
decreased

farm income
decreased
increased

diversity of income sources
decreased
increased

workload
increased
decreased

Socio-cultural impacts
food security/ self-sufficiency
reduced
improved

community institutions
weakened
strengthened

SLM/ land degradation knowledge
reduced
improved

conflict mitigation
worsened
improved

Ecological impacts
surface runoff
increased
decreased

evaporation
increased
decreased

soil moisture
decreased
increased

soil cover
reduced
improved

soil loss
increased
decreased

soil crusting/ sealing
increased
reduced

soil compaction
increased
reduced

soil organic matter/ below ground C
decreased
increased

vegetation cover
decreased
increased

biomass/ above ground C
decreased
increased

plant diversity
decreased
increased

invasive alien species
increased
reduced

animal diversity
decreased
increased

beneficial species (predators, earthworms, pollinators)
decreased
increased

habitat diversity
decreased
increased

pest/ disease control
decreased
increased

flood impacts
increased
decreased

landslides/ debris flows
increased
decreased

drought impacts
increased
decreased

impacts of cyclones, rain storms
increased
decreased

emission of carbon and greenhouse gases
increased
decreased

fire risk
increased
decreased

wind velocity
increased
decreased

micro-climate
worsened
improved

Off-site impacts
downstream flooding (undesired)
increased
reduced

damage on neighbours' fields
increased
reduced

damage on public/ private infrastructure
increased
reduced

Cost-benefit analysis

Benefits compared with establishment costs
Short-term returns
very negative
very positive

Long-term returns
very negative
very positive

Benefits compared with maintenance costs
Short-term returns
very negative
very positive

Long-term returns
very negative
very positive

Climate change

Gradual climate change
annual temperature increase

not well at all
very well
seasonal temperature increase

not well at all
very well
Season: dry season
annual rainfall decrease

not well at all
very well
seasonal rainfall decrease

not well at all
very well
Season: wet/ rainy season
Climate-related extremes (disasters)
local thunderstorm

not well at all
very well
drought

not well at all
very well
general (river) flood

not well at all
very well
landslide

not well at all
very well
epidemic diseases

not well at all
very well

Adoption and adaptation

Percentage of land users in the area who have adopted the Technology
  • single cases/ experimental
  • 1-10%
  • 11-50%
  • > 50%
Of all those who have adopted the Technology, how many have done so without receiving material incentives?
  • 0-10%
  • 11-50%
  • 51-90%
  • 91-100%
Has the Technology been modified recently to adapt to changing conditions?
  • Yes
  • No
To which changing conditions?
  • climatic change/ extremes
  • changing markets
  • labour availability (e.g. due to migration)

Conclusions and lessons learnt

Strengths: land user's view
  • None
  • None
  • None
Strengths: compiler’s or other key resource person’s view
  • None
  • None
  • None
Weaknesses/ disadvantages/ risks: land user's viewhow to overcome
  • None
  • None
Weaknesses/ disadvantages/ risks: compiler’s or other key resource person’s viewhow to overcome
  • None
  • None
  • None

References

Compiler
  • Donia Mühlematter
Editors
  • Hichem Khemiri
Reviewer
  • Alexandra Gavilano
  • Donia Mühlematter
Date of documentation: May 16, 2018
Last update: Aug. 21, 2019
Resource persons
Full description in the WOCAT database
Linked SLM data
Documentation was faciliated by
Institution Project
Links to relevant information which is available online
This work is licensed under Creative Commons Attribution-NonCommercial-ShareaAlike 4.0 International