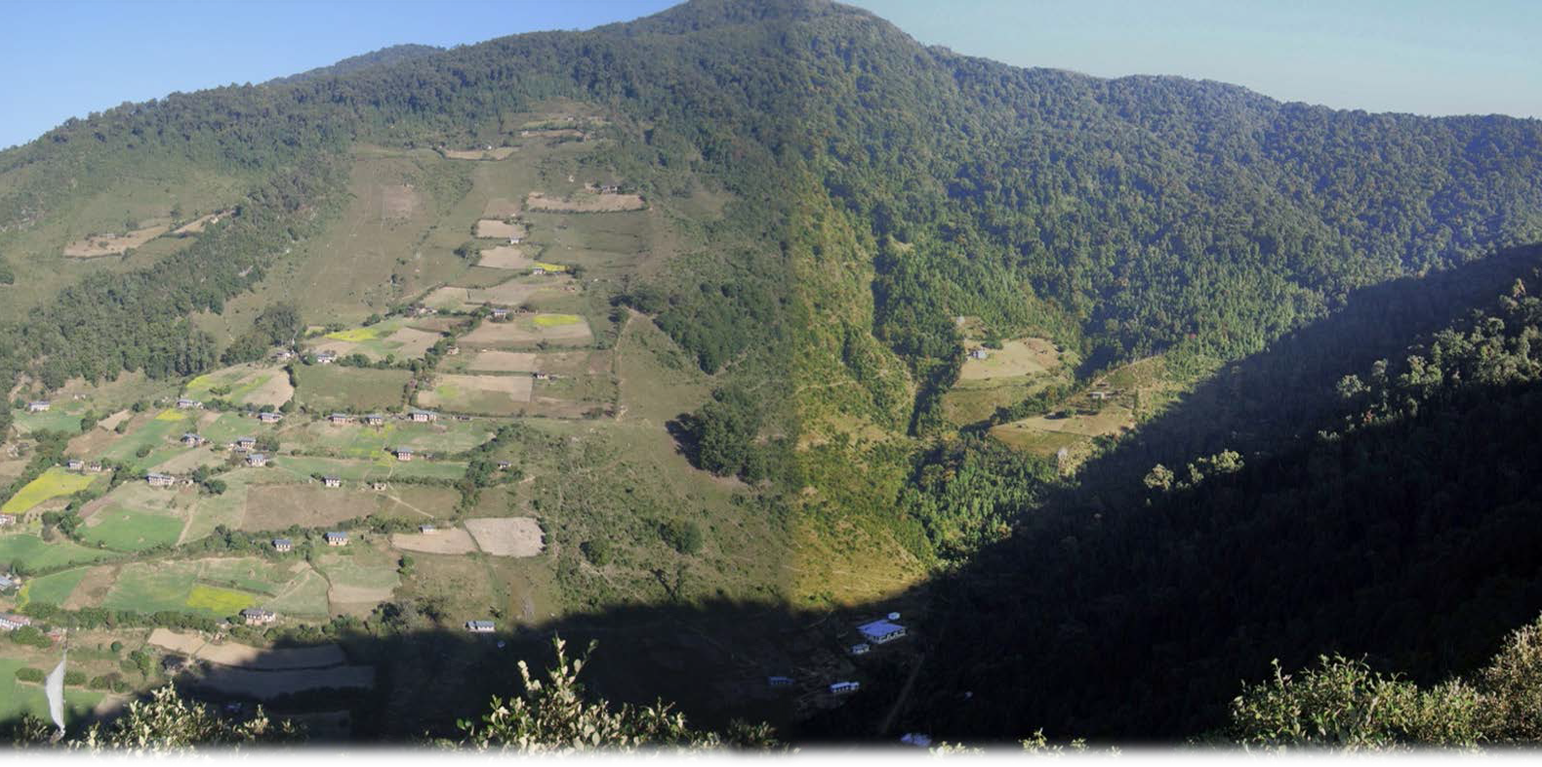
Yakpugang village where the water source protection has been established (Damcho Zam)

Water Source Protection (Bhutan)

Chhu Ka Soongchop (ཆུ་བརྐ་སྲུང་སྐྱོབ།)

Description

Water source protection involves protecting lakes, rivers, springs, or man-made reservoirs to avoid water pollution and damage by livestock and wild animals. In the past, the emphasis was on fencing and improving vegetation cover at the discharge point itself, but a recent focus is on groundwater recharge areas.

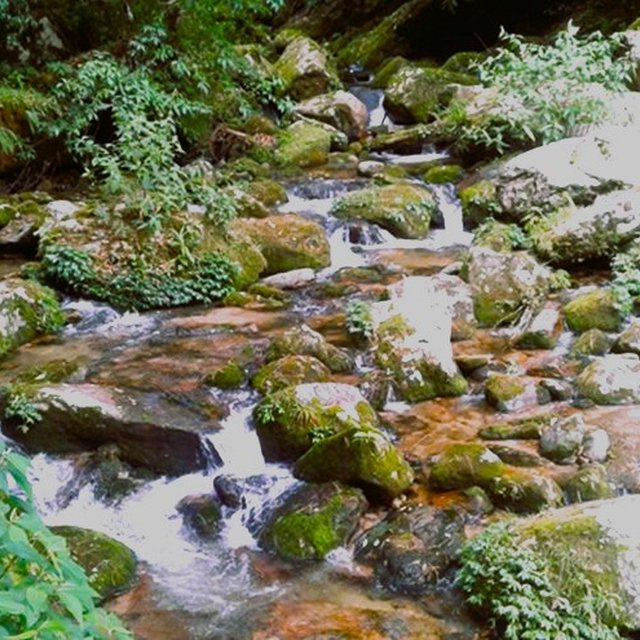
Water source protection involves protecting lakes, rivers, springs or man-made reservoirs to avoid water pollution and damage by livestock and wild animals. In the past this included fencing and enhancing vegetation cover at the discharge point – that is, where the water starts flowing. However, today, water source protection also focuses on improving groundwater recharge areas. The water source protection technology has many benefits. In addition to providing a clean and regular supply of drinking and irrigation water, it also enhances the vegetation cover of the catchment area.
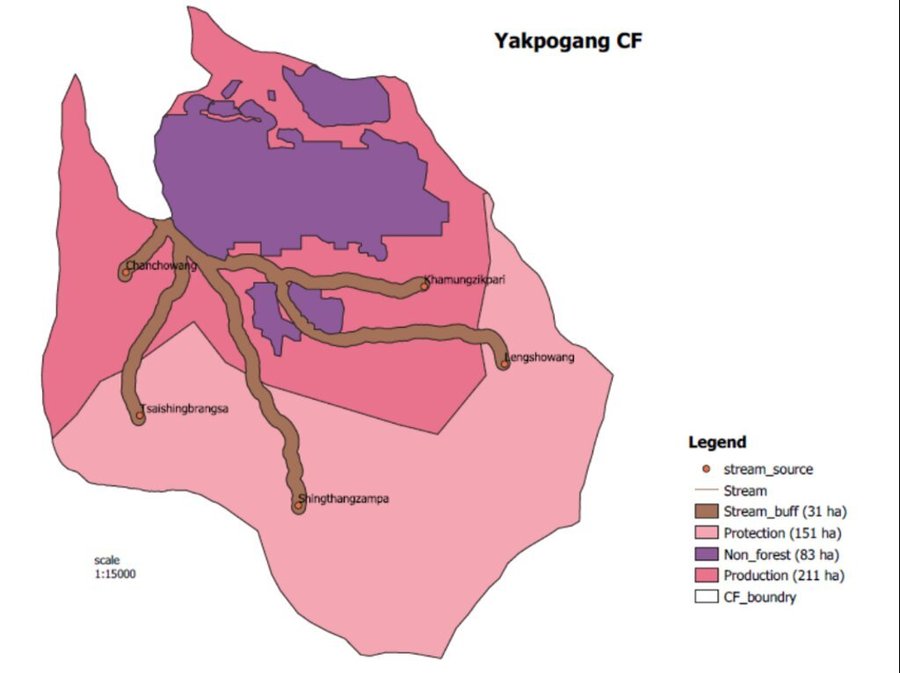
Strategies target maintaining adequate water levels in underground water reservoirs to ensure a continuous flow of streams and springs. In Yakpugang Community Forest, the technology has been applied specifically in the southern mountainous part of the village. An area of 638 acres (255 hectares) has been established as the recharge zone, and three springs have been identified for source protection. Native tree species have been planted annually in the degraded watershed to improve forest conditions. The main purpose is to protect the quality and quantity of the water for both drinking and irrigation purposes. The technology is supported by an approach that involves collective efforts of the community who realize that if their drinking and irrigation water supply is to be sustainable, they must work together.
The main purpose is to ensure a continuous supply of water for drinking and irrigation to the community. This is achieved through managing the catchment areas where rainwater soaks through the ground to reach a groundwater reservoir, and one of the key interventions is protecting the water sources from wild animals and livestock.
The water source protection technology involves 1) meeting different stakeholders, 2) signing agreements between the stakeholders, 3) site selection and survey, 4) planting of native tree species, and 5) conducting annual monitoring and evaluation. Inputs like fencing materials, planting materials, and human resources are required for the implementation and maintenance of the technology.
The technology is liked because it helps provide a continuous supply of both clean drinking and irrigation water. Furthermore, protecting water sources by the community is rewarded in monetary form by the nearby town as part of the Payment for Environmental Services (PES). This incentive helps the community to generate income which is ploughed back into the improvement and maintenance of water sources. What is disliked is the reduction in grazing land since the land users are not allowed to graze their cattle inside the water source areas.

Location

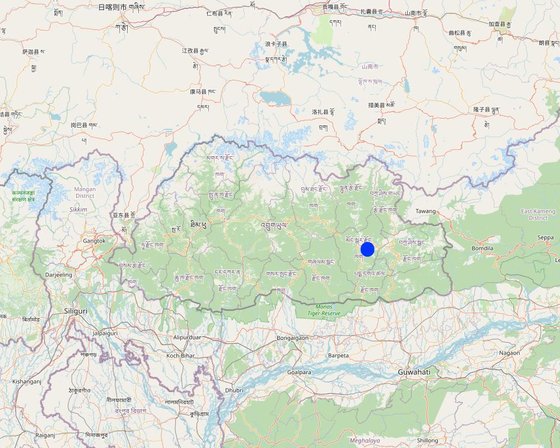
Location: Yakpugang village, Mongar Dzongkhag (District), Bhutan

No. of Technology sites analysed: 2-10 sites

Geo-reference of selected sites
  • 91.29394, 27.25762
  • 91.29394, 27.2535
  • 91.29291, 27.24808

Spread of the Technology: applied at specific points/ concentrated on a small area

In a permanently protected area?: No

Date of implementation: 2007; less than 10 years ago (recently)

Type of introduction
Water Source (Tashi Phuntsho, Kuensel)
One of the stream of the PES in Tsirang (Divisional Forest Office (DFO), Tsirang)

Classification of the Technology

Main purpose
  • improve production
  • reduce, prevent, restore land degradation
  • conserve ecosystem
  • protect a watershed/ downstream areas – in combination with other Technologies
  • preserve/ improve biodiversity
  • reduce risk of disasters
  • adapt to climate change/ extremes and its impacts
  • mitigate climate change and its impacts
  • create beneficial economic impact
  • create beneficial social impact
Land use
Land use mixed within the same land unit: No

  • Cropland
    • Annual cropping: vegetables - leafy vegetables (salads, cabbage, spinach, other), vegetables - root vegetables (carrots, onions, beet, other), Chillies
    • Tree and shrub cropping: pome fruits (apples, pears, quinces, etc.), stone fruits (peach, apricot, cherry, plum, etc)
    Number of growing seasons per year: 1
    Is intercropping practiced? No
    Is crop rotation practiced? Yes
  • Waterways, waterbodies, wetlands - Drainage lines, waterways
    Main products/ services: Irrigation channels for farming and drinking water pipes

Water supply
  • rainfed
  • mixed rainfed-irrigated
  • full irrigation

Purpose related to land degradation
  • prevent land degradation
  • reduce land degradation
  • restore/ rehabilitate severely degraded land
  • adapt to land degradation
  • not applicable
Degradation addressed
  • soil erosion by water - Wt: loss of topsoil/ surface erosion, Wg: gully erosion/ gullying
  • water degradation - Ha: aridification, Hs: change in quantity of surface water, Hp: decline of surface water quality
SLM group
  • improved ground/ vegetation cover
  • irrigation management (incl. water supply, drainage)
  • surface water management (spring, river, lakes, sea)
SLM measures
  • vegetative measures - V1: Tree and shrub cover, V2: Grasses and perennial herbaceous plants

Technical drawing

Technical specifications
GIS map of the recharge zone of the Yakpugang spings
Yakpugang village, Mongar Gewog (Block), Mongar Dzongkhag (District), Bhutan
Author: Ugyen Norten

Establishment and maintenance: activities, inputs and costs

Calculation of inputs and costs
  • Costs are calculated: per Technology unit (unit: Recharge zone of 638 acres (255 hectares) volume, length: 638 acres (255 hectares))
  • Currency used for cost calculation: n.a.
  • Exchange rate (to USD): 1 USD = 82.08
  • Average wage cost of hired labour per day: 1000
Most important factors affecting the costs
None.
Establishment activities
  1. Community meeting (Timing/ frequency: Conducted several times)
  2. Survey of the recharge zone and site selection (Timing/ frequency: The survey took around 2 to 3 weeks)
  3. Agreement between the stakeholders (Timing/ frequency: Agreement done thrice)
  4. Native tree species plantation around the watershed (Timing/ frequency: Based on a specified date and each individuals from household came)
Total establishment costs (estimation)
258500.0
Maintenance activities
  1. Clearing of the water source (Timing/ frequency: Thrice annually)
Maintenance inputs and costs (per Recharge zone of 638 acres (255 hectares))
Specify input Unit Quantity Costs per Unit (n.a.) Total costs per input (n.a.) % of costs borne by land users
Labour
Community Forest members person/day. 102.0

Natural environment

Average annual rainfall
  • < 250 mm
  • 251-500 mm
  • 501-750 mm
  • 751-1,000 mm
  • 1,001-1,500 mm
  • 1,501-2,000 mm
  • 2,001-3,000 mm
  • 3,001-4,000 mm
  • > 4,000 mm
Agro-climatic zone
  • humid
  • sub-humid
  • semi-arid
  • arid
Specifications on climate
The data was used from the nearest weather station of the National Center for Hydrology and Meteorology (NCHM).
Name of the meteorological station: https://www.nchm.gov.bt/home/pageMenu/906
Warm temperate zone
Slope
  • flat (0-2%)
  • gentle (3-5%)
  • moderate (6-10%)
  • rolling (11-15%)
  • hilly (16-30%)
  • steep (31-60%)
  • very steep (>60%)
Landforms
  • plateau/plains
  • ridges
  • mountain slopes
  • hill slopes
  • footslopes
  • valley floors
Altitude
  • 0-100 m a.s.l.
  • 101-500 m a.s.l.
  • 501-1,000 m a.s.l.
  • 1,001-1,500 m a.s.l.
  • 1,501-2,000 m a.s.l.
  • 2,001-2,500 m a.s.l.
  • 2,501-3,000 m a.s.l.
  • 3,001-4,000 m a.s.l.
  • > 4,000 m a.s.l.
Technology is applied in
  • convex situations
  • concave situations
  • not relevant
Soil depth
  • very shallow (0-20 cm)
  • shallow (21-50 cm)
  • moderately deep (51-80 cm)
  • deep (81-120 cm)
  • very deep (> 120 cm)
Soil texture (topsoil)
  • coarse/ light (sandy)
  • medium (loamy, silty)
  • fine/ heavy (clay)
Soil texture (> 20 cm below surface)
  • coarse/ light (sandy)
  • medium (loamy, silty)
  • fine/ heavy (clay)
Topsoil organic matter content
  • high (>3%)
  • medium (1-3%)
  • low (<1%)
Groundwater table
  • on surface
  • < 5 m
  • 5-50 m
  • > 50 m
Availability of surface water
  • excess
  • good
  • medium
  • poor/ none
Water quality (untreated)
  • good drinking water
  • poor drinking water (treatment required)
  • for agricultural use only (irrigation)
  • unusable
Water quality refers to: surface water
Is salinity a problem?
  • Yes
  • No

Occurrence of flooding
  • Yes
  • No
Species diversity
  • high
  • medium
  • low
Habitat diversity
  • high
  • medium
  • low

Characteristics of land users applying the Technology

Market orientation
  • subsistence (self-supply)
  • mixed (subsistence/ commercial)
  • commercial/ market
Off-farm income
  • less than 10% of all income
  • 10-50% of all income
  • > 50% of all income
Relative level of wealth
  • very poor
  • poor
  • average
  • rich
  • very rich
Level of mechanization
  • manual work
  • animal traction
  • mechanized/ motorized
Sedentary or nomadic
  • Sedentary
  • Semi-nomadic
  • Nomadic
Individuals or groups
  • individual/ household
  • groups/ community
  • cooperative
  • employee (company, government)
Gender
  • women
  • men
Age
  • children
  • youth
  • middle-aged
  • elderly
Area used per household
  • < 0.5 ha
  • 0.5-1 ha
  • 1-2 ha
  • 2-5 ha
  • 5-15 ha
  • 15-50 ha
  • 50-100 ha
  • 100-500 ha
  • 500-1,000 ha
  • 1,000-10,000 ha
  • > 10,000 ha
Scale
  • small-scale
  • medium-scale
  • large-scale
Land ownership
  • state
  • company
  • communal/ village
  • group
  • individual, not titled
  • individual, titled
Land use rights
  • open access (unorganized)
  • communal (organized)
  • leased
  • individual
Water use rights
  • open access (unorganized)
  • communal (organized)
  • leased
  • individual
Access to services and infrastructure
health

poor
good
education

poor
good
technical assistance

poor
good
employment (e.g. off-farm)

poor
good
markets

poor
good
energy

poor
good
roads and transport

poor
good
drinking water and sanitation

poor
good
financial services

poor
good

Impacts

Socio-economic impacts
Crop production
decreased
increased

Quantity before SLM: 15 baskets of maize
Quantity after SLM: 20 to 25 baskets maize
There has been an increase in the amount of maize, which has been credited to the increase in the amount of water than in the past.

crop quality
decreased
increased


According to the land user, crop quality has been relatively better after the implementation of the technology than in the past.

risk of production failure
increased
decreased


Due to the presence of water in the community, production has decreased.

product diversity
decreased
increased

Quantity before SLM: maize and some other cereals and vegetables were grown
Quantity after SLM: maize together with cole crops, tubers and fruits are grown

production area (new land under cultivation/ use)
decreased
increased

Quantity before SLM: 1 acres
Quantity after SLM: 1.5 acres
In the past, the lack of water would lead the land users to keeping some of the land fallow.

drinking water availability
decreased
increased

Quantity before SLM: Water would be scarce periodically
Quantity after SLM: Water is now available throughout the community
Drinking water availability has increased compared to the past. This is mainly due to the protection of water sources. In addition, now community members also go for regular clearing of irrigation channels, drinking water pipelines, and sources to keep the supply steady.

drinking water quality
decreased
increased


Quality in terms of cleanliness of drinking water was reported to have enhanced because in the past nearby streams from where they get their drinking water used to get polluted by rainwater, animals, etc.

water availability for livestock
decreased
increased

Quantity before SLM: Water would be taken to the nearby streams
Quantity after SLM: Water is now provided near there house
Since supply is continuous the water availability for livestock also increased.

water quality for livestock
decreased
increased


Water for livestock are also improved than in the past.

irrigation water availability
decreased
increased

Quantity before SLM: Focused more on growing crops requiring less water
Quantity after SLM: Now grows variety of diverse crops
Since the water flow is continuous, there is enough water to carry out multiple cropping.

irrigation water quality
decreased
increased


Water quality for irrigation is better than the past

farm income
decreased
increased

Quantity before SLM: focuses mostly on commercialising maize
Quantity after SLM: now commercialises diverse vegetable crops as well

Socio-cultural impacts
food security/ self-sufficiency
reduced
improved


The availability of water in the community, allowed for the land users to grow a diverse vegetable crops in large amount.

health situation
worsened
improved

Quantity before SLM: Community members prone to water related disease
Quantity after SLM: Water is relatively cleaner

land use/ water rights
worsened
improved


Agreement for water source protection is conducted after every end of the agreement year, where water use rights are also discussed.

Ecological impacts
water quantity
decreased
increased

Quantity before SLM: water from the source would dry up most of the times
Quantity after SLM: water in the water source is almost always filled.

water quality
decreased
increased

Quantity before SLM: Would be dirty due to wild animals and grazing cattle
Quantity after SLM: Since water source is protected, water is relatively cleaner

drought impacts
increased
decreased

Quantity before SLM: in the past, drought would occur periodically
Quantity after SLM: Even during the absence of rain, water is still available

Off-site impacts
groundwater/ river pollution
increased
reduced

Quantity before SLM: Would normally be polluted due to wild animals and grazing cattles
Quantity after SLM: Water is now clean and also drinkable

Cost-benefit analysis

Benefits compared with establishment costs
Short-term returns
very negative
very positive

Long-term returns
very negative
very positive

Benefits compared with maintenance costs
Short-term returns
very negative
very positive

Long-term returns
very negative
very positive

The income earned from the project goes into community development and the community forest, and the expense for the project is already funded.

Climate change

Gradual climate change
annual temperature increase

not well at all
very well
annual rainfall increase

not well at all
very well
Climate-related extremes (disasters)
local rainstorm

not well at all
very well
local thunderstorm

not well at all
very well
local hailstorm

not well at all
very well
local windstorm

not well at all
very well
drought

not well at all
very well
forest fire

not well at all
very well
land fire

not well at all
very well
general (river) flood

not well at all
very well
flash flood

not well at all
very well
landslide

not well at all
very well

Adoption and adaptation

Percentage of land users in the area who have adopted the Technology
  • single cases/ experimental
  • 1-10%
  • 11-50%
  • > 50%
Of all those who have adopted the Technology, how many have done so without receiving material incentives?
  • 0-10%
  • 11-50%
  • 51-90%
  • 91-100%
Number of households and/ or area covered
102 households
Has the Technology been modified recently to adapt to changing conditions?
  • Yes
  • No
To which changing conditions?
  • climatic change/ extremes
  • changing markets
  • labour availability (e.g. due to migration)

Conclusions and lessons learnt

Strengths: land user's view
  • Continuous supply of both drinking water and irrigation water
  • Water is supplied to Mongar town, and income is earned from it under Payment for Environmental Services (PES) arrangement b
  • Has helped in community development and improvement of community forest
Strengths: compiler’s or other key resource person’s view
  • Water quality is preserved, and pollution and contamination of the water sources are prevented.
  • The plantation of native tree species helps conserve the ecosystem.
  • Long-term sustainability and enhanced climate resilience of the water source
Weaknesses/ disadvantages/ risks: land user's viewhow to overcome
  • Decreased grazing land Shift the grazing area outside the community forest or establish improved pasture land in their registered land
Weaknesses/ disadvantages/ risks: compiler’s or other key resource person’s viewhow to overcome

References

Compiler
  • ONGPO LEPCHA
Editors
  • Haka Drukpa
Reviewer
  • William Critchley
  • Rima Mekdaschi Studer
Date of documentation: July 10, 2023
Last update: Feb. 24, 2024
Resource persons
Full description in the WOCAT database
Linked SLM data
Documentation was faciliated by
Institution Project
Key references
  • Norten, U. (2021). Impact of Water Management strategies- Payment for Ecosystem Services (PES) in Bhutan. International Journal of Science and Innovative Research, 2(8), 109-144.: https://ijesir.org/wp-content/uploads/2021/11/0100072IJESIRnew.pdf
  • WWF. (2017). Valuing Ecosystem Services in Chamkharchhu Sub Basin: Mapping Sediment Using InVEST. WWF.: https://wwfasia.awsassets.panda.org/downloads/final_invest_report_final_draft_may_17_spread_compressed_2.pdf
This work is licensed under Creative Commons Attribution-NonCommercial-ShareaAlike 4.0 International