
Multi-Canopy Agroforestry [Uganda]
- Creation:
- Update:
- Compiler: Bernard Fungo
- Editors: JOY TUKAHIRWA, Kamugisha Rick Nelson, betty adoch, Sunday Balla Amale
- Reviewers: Drake Mubiru, Nicole Harari, Udo Höggel
Pito Yen Ki Labolo Ki mwanyi Ka ngig yat mapatpat
technologies_2148 - Uganda
View sections
Expand all Collapse all1. General information
1.2 Contact details of resource persons and institutions involved in the assessment and documentation of the Technology
Key resource person(s)
land user:
Otto Bosco
+256773392188
Omoro District Farmers
Ongako sub county, Omoro District
Uganda
Name of project which facilitated the documentation/ evaluation of the Technology (if relevant)
Scaling-up SLM practices by smallholder farmers (IFAD)Name of the institution(s) which facilitated the documentation/ evaluation of the Technology (if relevant)
Uganda Landcare Network (ULN) - Uganda1.3 Conditions regarding the use of data documented through WOCAT
When were the data compiled (in the field)?
11/05/2017
The compiler and key resource person(s) accept the conditions regarding the use of data documented through WOCAT:
Yes
1.4 Declaration on sustainability of the described Technology
Is the Technology described here problematic with regard to land degradation, so that it cannot be declared a sustainable land management technology?
No
2. Description of the SLM Technology
2.1 Short description of the Technology
Definition of the Technology:
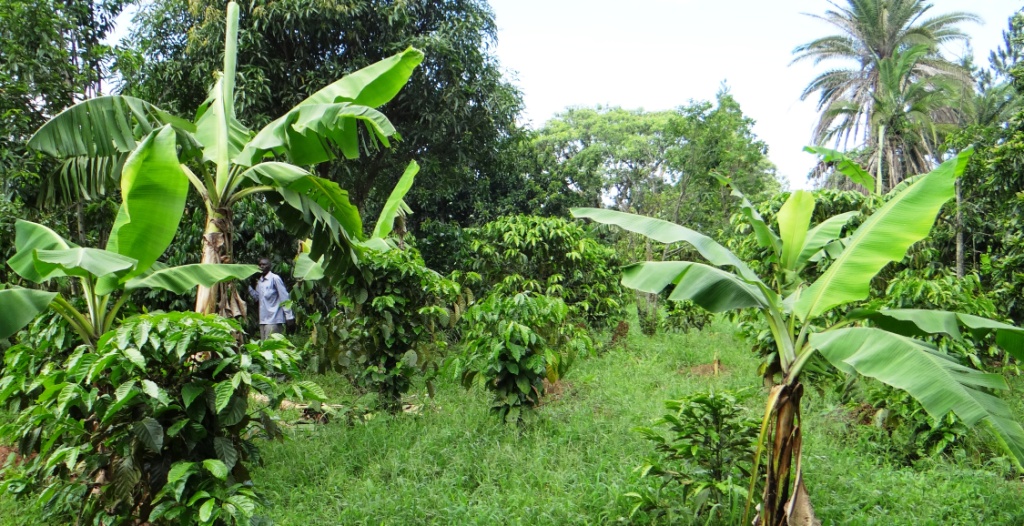
Trees of various sizes are integrated with crops such as coffee and/or banana, maize and beans such that each group of plants occupies a specific vertical position and competition for vertical space is minimized
2.2 Detailed description of the Technology
Description:
In multicanopy agroforestry, annual crops that include maize, beans and shrub species such Calliandra and Sesbania are integrated so as to occupy the lower vertical spaces. The next height is occupied by taller crops such as coffee, cocoa and bananas while the highest layer is occupied by tall trees such as Maesopsis eminii, Makhamia lutea and Ficus nantalesis. This arrangement ensures that as much land as possible is utilized.
The upper strata of a multi-layered planting is called the overstory, or canopy. The trees that make up this layer play the key role in creating the understory. The shady environment in the understory (i) Reduces evapotranspiration (evaporation of water through the leaves and branches of the plant), conserving moisture in the plants and reducing water use (ii) Buffers crops from temperature extremes and fluctuations (iii) Protects crops from winds (iv) Suppresses many invasive problem weeds, which tend to prefer open conditions and full sun and (v) Supports a range of beneficial soil microlife that do not thrive in the open. On the other hand, understory crops should (i) tolerate partial shade (ii) exploit, at least partially, different soil horizons than the overstory trees (iii) be less tall than the overstory trees when mature (although some trees may be planned to use the shade as seedlings, but eventually overtake and become part of the upper layer) (iv) be less susceptible than the overstory trees to diseases they may have in common and (v) not involve damage to the overstory trees during cultivation or harvest of understory crops. The most important consideration when implementing this technology is that the various components of the plant system have to be compatible.
Management should be done to reduce competition for vertical and horizontal space. The number of trees per acre is 50% less compared with timber or fruit trees planted alone. Spacing should be planned to provide the most optimal environment for the understory, and minimize competition for space, light, and nutrients. The species growth rate, rooting patterns, and other factors should be taken into account when planning.
Required management activities include weeding, pruning, and thinning. Weeding is usually done twice every season mainly to take care of the annual crops such as maize and beans. Pruning is done whenever the farmer sees that light intensity from the upper canopy is no longer enough to support the understory crops. Usually, once a year is appropriate. Pruning is also done to reduce the risk of old branches falling and damaging crops and other farm structures. Thinning is done to reduce the number of seedlings from the soil ground.
The technology increases biodiversity on-farm, and protects the environment from degradation, soil loss, and wind break. This diversity has the advantage of reducing pest and disease incidence. The mixed fruits and trees provide timber and fuel wood, shade for coffee and banana, and keep the soil moist. It also acts as wind break which protects crops, farm structures and reduce soil loss by wind. It is a source of income to land user, provides food, improves the ecosystem, and leguminous plants fix nitrogen in the soil.
The technology is generally cheap to establish because the main inputs needed include tree seedlings, which were raised by the land user with the exception of the coffee seedlings and banana suckers which were obtained from outside. Labour is usually entirely family-based. The economic benefits are difficult to quantify due to the complex nature of the interaction among system components.
The potential limitations of understory intercropping include (i) Shortage of scientific study and information about tree/understory crop interactions (ii) Risk of unforeseen competition or allelopathic effects (iii) Greater complexity in management of multiple species and multiple products and (iv) Potential damage to overstory from harvest of the understory, or vice-versa.
Implementing multi-canopy agroforestry requires skills that are usually developed over long periods of time by farmers who observe the various interactions among the components and manage (especially the trees) to reduce the competition without compromising the benefits.
2.3 Photos of the Technology
Media Gallery
2.4 Videos of the Technology
Date:
24/4/2017
Location:
Omoro
2.5 Country/ region/ locations where the Technology has been applied and which are covered by this assessment
Country:
Uganda
Region/ State/ Province:
Northern
Further specification of location:
Omoro District
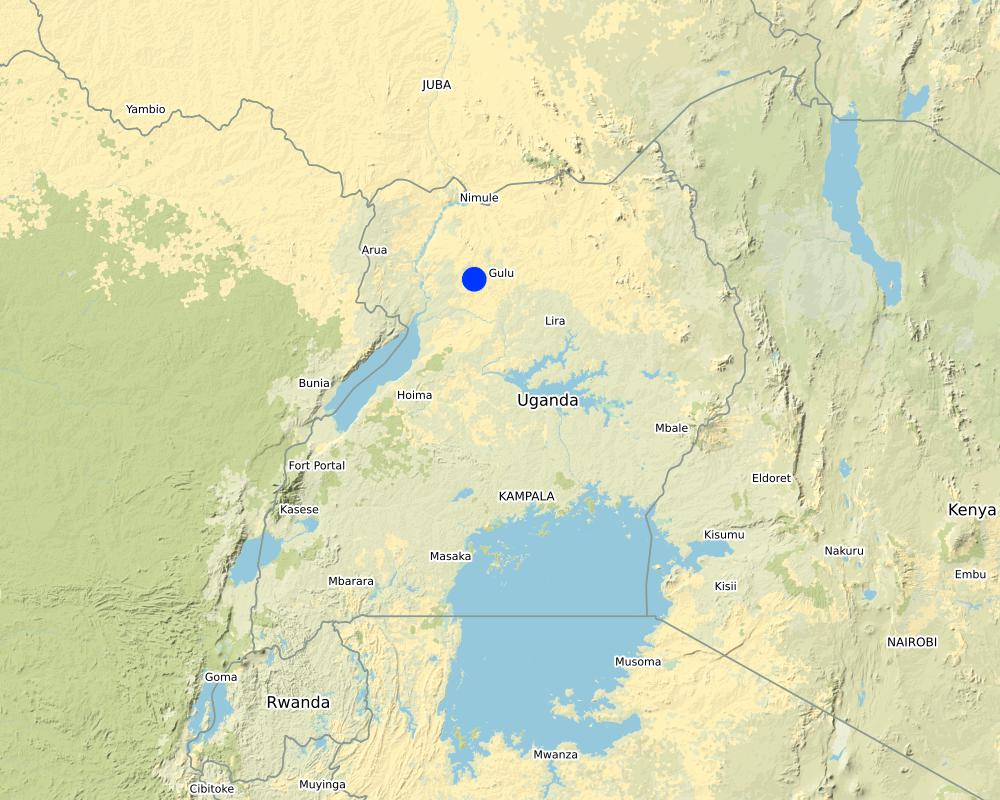
Map
×2.6 Date of implementation
Indicate year of implementation:
1998
2.7 Introduction of the Technology
Specify how the Technology was introduced:
- as part of a traditional system (> 50 years)
3. Classification of the SLM Technology
3.1 Main purpose(s) of the Technology
- improve production
- reduce, prevent, restore land degradation
- conserve ecosystem
- preserve/ improve biodiversity
- reduce risk of disasters
- adapt to climate change/ extremes and its impacts
- mitigate climate change and its impacts
- create beneficial economic impact
- create beneficial social impact
3.2 Current land use type(s) where the Technology is applied

Cropland
- Annual cropping
- Perennial (non-woody) cropping
- Tree and shrub cropping
Main crops (cash and food crops):
Banana, coffee and fruits trees, maize, beans
Forest/ woodlands
(Semi-)natural forests/ woodlands:
- Selective felling
- Dead wood/ prunings removal
Tree plantation, afforestation:
- Mixed varieties
Products and services:
- Timber
- Fuelwood
- Fruits and nuts
- Nature conservation/ protection
- Protection against natural hazards
3.3 Further information about land use
Water supply for the land on which the Technology is applied:
- rainfed
Number of growing seasons per year:
- 2
3.4 SLM group to which the Technology belongs
- agroforestry
- windbreak/ shelterbelt
3.5 Spread of the Technology
Specify the spread of the Technology:
- evenly spread over an area
If the Technology is evenly spread over an area, indicate approximate area covered:
- < 0.1 km2 (10 ha)
3.6 SLM measures comprising the Technology

agronomic measures
- A1: Vegetation/ soil cover
- A2: Organic matter/ soil fertility

vegetative measures
- V1: Tree and shrub cover
- V2: Grasses and perennial herbaceous plants

management measures
- M3: Layout according to natural and human environment
- M5: Control/ change of species composition
3.7 Main types of land degradation addressed by the Technology

soil erosion by water
- Wt: loss of topsoil/ surface erosion
soil erosion by wind
- Et: loss of topsoil

physical soil deterioration
- Pc: compaction
- Pi: soil sealing
- Pw: waterlogging
3.8 Prevention, reduction, or restoration of land degradation
Specify the goal of the Technology with regard to land degradation:
- prevent land degradation
- reduce land degradation
4. Technical specifications, implementation activities, inputs, and costs
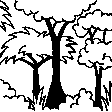
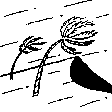
4.1 Technical drawing of the Technology
Author:
Food and Nutrition Bulletin Volume 07, Number 3, 1985
Date:
24/4/2017
4.2 Technical specifications/ explanations of technical drawing
- 20 to 30 meters between trees
- 3 meters between between coffee or banana plants
- Beans or soybeans can be planted between coffee/banana plants
- Trees are pruned to leave about one half of the crown
4.3 General information regarding the calculation of inputs and costs
Specify how costs and inputs were calculated:
- per Technology area
Indicate size and area unit:
2 acres
other/ national currency (specify):
Uganda Shillings
Indicate exchange rate from USD to local currency (if relevant): 1 USD =:
3500.0
Indicate average wage cost of hired labour per day:
5000
4.4 Establishment activities
| Activity | Type of measure | Timing | |
|---|---|---|---|
| 1. | Preparing of the nursery bed | Structural | At the beginning of the season |
| 2. | Transplanting | Vegetative | At the start of the rainy season |
| 3. | Weeding | Agronomic | One month after planting |
| 4. | Prunning of trees | Agronomic | Once every year |
| 5. | Harvesting of annual crops | Agronomic | Every season |
4.5 Costs and inputs needed for establishment
| Specify input | Unit | Quantity | Costs per Unit | Total costs per input | % of costs borne by land users | |
|---|---|---|---|---|---|---|
| Labour | Preparing of the nursery bed | Mandays | 30.0 | 5000.0 | 150000.0 | 100.0 |
| Labour | Transplanting | Mandays | 12.0 | 5000.0 | 60000.0 | 100.0 |
| Labour | Weeding | Mandays | 12.0 | 5000.0 | 60000.0 | 100.0 |
| Labour | Prunning of trees | Mandays | 15.0 | 5000.0 | 75000.0 | 100.0 |
| Plant material | Seedlings | Number | 100.0 | 3000.0 | 300000.0 | 100.0 |
| Total costs for establishment of the Technology | 645000.0 | |||||
If land user bore less than 100% of costs, indicate who covered the remaining costs:
The cost is generally handled by the family
4.6 Maintenance/ recurrent activities
| Activity | Type of measure | Timing/ frequency | |
|---|---|---|---|
| 1. | Weeding | Agronomic | Every season |
| 2. | Pruning | Agronomic | Once a year |
Comments:
Most activities are managed by the family
4.7 Costs and inputs needed for maintenance/ recurrent activities (per year)
| Specify input | Unit | Quantity | Costs per Unit | Total costs per input | % of costs borne by land users | |
|---|---|---|---|---|---|---|
| Labour | Weeding | Mandays | 30.0 | 5000.0 | 150000.0 | 100.0 |
| Labour | Pruning | Mandays | 15.0 | 5000.0 | 75000.0 | 100.0 |
| Total costs for maintenance of the Technology | 225000.0 | |||||
4.8 Most important factors affecting the costs
Describe the most determinate factors affecting the costs:
Pruning becasue this involves aiming at high tree branches, which is risky and therefore, costly
5. Natural and human environment
5.1 Climate
Annual rainfall
- < 250 mm
- 251-500 mm
- 501-750 mm
- 751-1,000 mm
- 1,001-1,500 mm
- 1,501-2,000 mm
- 2,001-3,000 mm
- 3,001-4,000 mm
- > 4,000 mm
Agro-climatic zone
- humid
One long major rainy season with simple dry spell in between and followed by dry season from December to March
5.2 Topography
Slopes on average:
- flat (0-2%)
- gentle (3-5%)
- moderate (6-10%)
- rolling (11-15%)
- hilly (16-30%)
- steep (31-60%)
- very steep (>60%)
Landforms:
- plateau/plains
- ridges
- mountain slopes
- hill slopes
- footslopes
- valley floors
Altitudinal zone:
- 0-100 m a.s.l.
- 101-500 m a.s.l.
- 501-1,000 m a.s.l.
- 1,001-1,500 m a.s.l.
- 1,501-2,000 m a.s.l.
- 2,001-2,500 m a.s.l.
- 2,501-3,000 m a.s.l.
- 3,001-4,000 m a.s.l.
- > 4,000 m a.s.l.
Indicate if the Technology is specifically applied in:
- not relevant
Comments and further specifications on topography:
The land is generally flat and the technology take place toward the valley
5.3 Soils
Soil depth on average:
- very shallow (0-20 cm)
- shallow (21-50 cm)
- moderately deep (51-80 cm)
- deep (81-120 cm)
- very deep (> 120 cm)
Soil texture (topsoil):
- medium (loamy, silty)
Soil texture (> 20 cm below surface):
- medium (loamy, silty)
Topsoil organic matter:
- medium (1-3%)
5.4 Water availability and quality
Ground water table:
5-50 m
Availability of surface water:
medium
Water quality (untreated):
for agricultural use only (irrigation)
Is water salinity a problem?
No
Is flooding of the area occurring?
No
5.5 Biodiversity
Species diversity:
- medium
Habitat diversity:
- medium
5.6 Characteristics of land users applying the Technology
Sedentary or nomadic:
- Sedentary
Market orientation of production system:
- subsistence (self-supply)
Off-farm income:
- > 50% of all income
Relative level of wealth:
- average
Individuals or groups:
- individual/ household
Level of mechanization:
- manual work
Gender:
- women
- men
Age of land users:
- youth
- middle-aged
Indicate other relevant characteristics of the land users:
Small animal keeping and farmer managed natural regeneration.
5.7 Average area of land owned or leased by land users applying the Technology
- < 0.5 ha
- 0.5-1 ha
- 1-2 ha
- 2-5 ha
- 5-15 ha
- 15-50 ha
- 50-100 ha
- 100-500 ha
- 500-1,000 ha
- 1,000-10,000 ha
- > 10,000 ha
Is this considered small-, medium- or large-scale (referring to local context)?
- medium-scale
Comments:
All space within the plot is utilized
5.8 Land ownership, land use rights, and water use rights
Land ownership:
- individual, not titled
Land use rights:
- individual
Water use rights:
- communal (organized)
5.9 Access to services and infrastructure
health:
- poor
- moderate
- good
education:
- poor
- moderate
- good
employment (e.g. off-farm):
- poor
- moderate
- good
markets:
- poor
- moderate
- good
energy:
- poor
- moderate
- good
roads and transport:
- poor
- moderate
- good
drinking water and sanitation:
- poor
- moderate
- good
financial services:
- poor
- moderate
- good
6. Impacts and concluding statements
6.1 On-site impacts the Technology has shown
Socio-economic impacts
Production
crop production
wood production
forest/ woodland quality
non-wood forest production
risk of production failure
product diversity
production area
land management
energy generation
Water availability and quality
drinking water availability
drinking water quality
water availability for livestock
water quality for livestock
Income and costs
expenses on agricultural inputs
farm income
diversity of income sources
economic disparities
workload
Socio-cultural impacts
food security/ self-sufficiency
health situation
SLM/ land degradation knowledge
Ecological impacts
Water cycle/ runoff
surface runoff
excess water drainage
groundwater table/ aquifer
evaporation
Soil
soil moisture
soil cover
soil loss
soil accumulation
soil crusting/ sealing
soil compaction
nutrient cycling/ recharge
soil organic matter/ below ground C
Biodiversity: vegetation, animals
Vegetation cover
biomass/ above ground C
plant diversity
pest/ disease control
Climate and disaster risk reduction
flood impacts
landslides/ debris flows
impacts of cyclones, rain storms
fire risk
wind velocity
micro-climate
6.2 Off-site impacts the Technology has shown
groundwater/ river pollution
buffering/ filtering capacity
wind transported sediments
impact of greenhouse gases
Comments regarding impact assessment:
No down stream flooding
6.3 Exposure and sensitivity of the Technology to gradual climate change and climate-related extremes/ disasters (as perceived by land users)
Climate-related extremes (disasters)
Meteorological disasters
| How does the Technology cope with it? | |
|---|---|
| tropical storm | very well |
| extra-tropical cyclone | very well |
| local rainstorm | very well |
| local thunderstorm | very well |
| local hailstorm | very well |
| local snowstorm | very well |
| local sandstorm/ duststorm | very well |
| local windstorm | very well |
| tornado | not known |
Climatological disasters
| How does the Technology cope with it? | |
|---|---|
| heatwave | very well |
| cold wave | not known |
| extreme winter conditions | not known |
| drought | very well |
| forest fire | very well |
| land fire | very well |
Hydrological disasters
| How does the Technology cope with it? | |
|---|---|
| general (river) flood | very well |
| flash flood | very well |
| storm surge/ coastal flood | not known |
| landslide | not known |
| avalanche | not known |
Biological disasters
| How does the Technology cope with it? | |
|---|---|
| epidemic diseases | very well |
| insect/ worm infestation | very well |
6.4 Cost-benefit analysis
How do the benefits compare with the establishment costs (from land users’ perspective)?
Short-term returns:
slightly positive
Long-term returns:
positive
How do the benefits compare with the maintenance/ recurrent costs (from land users' perspective)?
Short-term returns:
positive
Long-term returns:
very positive
6.5 Adoption of the Technology
- 1-10%
Of all those who have adopted the Technology, how many have did so spontaneously, i.e. without receiving any material incentives/ payments?
- 90-100%
6.6 Adaptation
Has the Technology been modified recently to adapt to changing conditions?
No
6.7 Strengths/ advantages/ opportunities of the Technology
| Strengths/ advantages/ opportunities in the land user’s view |
|---|
| Diversify the food and income sources of the household |
| Protection of the system from climate extremes especially drought and strong winds |
| Strengths/ advantages/ opportunities in the compiler’s or other key resource person’s view |
|---|
| Improved and sustainable land management |
6.8 Weaknesses/ disadvantages/ risks of the Technology and ways of overcoming them
| Weaknesses/ disadvantages/ risks in the land user’s view | How can they be overcome? |
|---|---|
| High labour requirements coupled with shortage of labour due to rural-urban migration of the youth |
7. References and links
7.1 Methods/ sources of information
- field visits, field surveys
2
- interviews with land users
2
- interviews with SLM specialists/ experts
1
7.2 References to available publications
Title, author, year, ISBN:
Agroforestry coffee practices in relation to productivity and erosion control, 2010
Available from where? Costs?
https://pdfs.semanticscholar.org/482c/b4d3cebf27f52f638ec10255f55724736a83.pdf?_ga=2.82063123.426798158.1589367611-1455465451.1589367611
7.3 Links to relevant information which is available online
Title/ description:
Inside Agroforestry
URL:
https://nac.unl.edu/documents/insideagroforestry/IA_vol23issue1.pdfIn
Links and modules
Expand all Collapse allLinks
No links
Modules
No modules