Green cover in orchards [Italy]
- Creation:
- Update:
- Compiler: Nicola Dal Ferro
- Editor: –
- Reviewers: Fabian Ottiger, Alexandra Gavilano
Inerbimento permanente interfilare frutteti
technologies_1290 - Italy
View sections
Expand all Collapse all1. General information
1.2 Contact details of resource persons and institutions involved in the assessment and documentation of the Technology
Key resource person(s)
SLM specialist:
SLM specialist:
Morari Francesco
University of Padova
Italy
1.3 Conditions regarding the use of data documented through WOCAT
The compiler and key resource person(s) accept the conditions regarding the use of data documented through WOCAT:
Yes
2. Description of the SLM Technology
2.1 Short description of the Technology
Definition of the Technology:
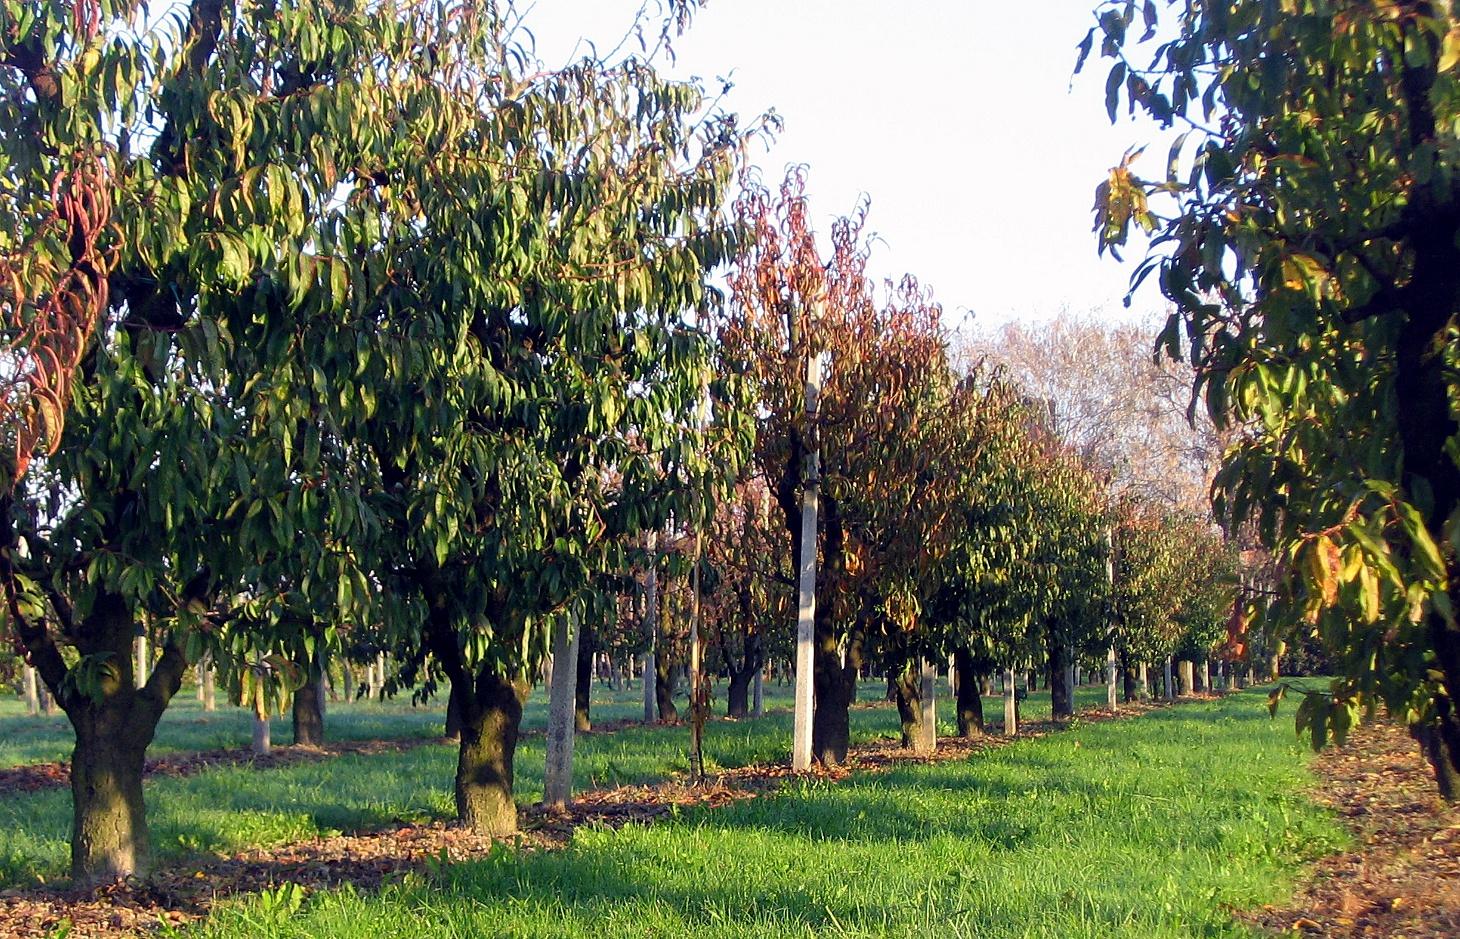
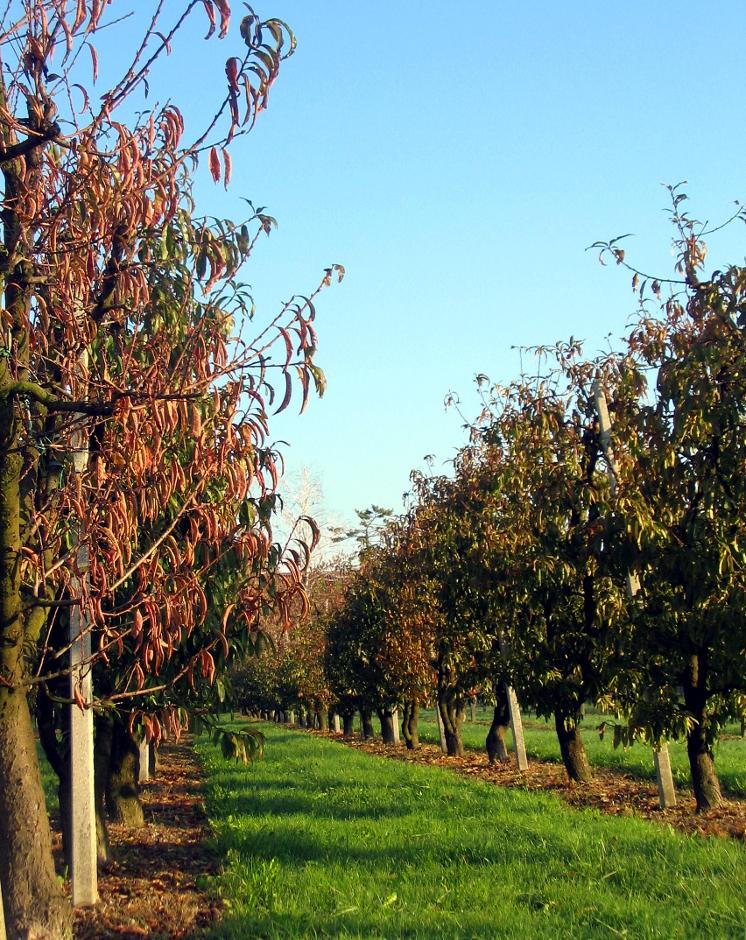
Perennial grasses in orchards and vineyards between rows to provide permanent soil cover
2.2 Detailed description of the Technology
Description:
The Veneto region has a strong tradition of fruit production, estimated in ca. 4% of total turnover in the agricultural sector. A sustainable fruit orchard management has the ambition to combine fruit production with the maintenance of soil fertility. The increase or preservation of soil fertility can be supported by means of soil management techniques, such as green cover. Compared with systems that does not use a permanent soil protection, green cover provides long-term agronomical and environmental benefits due to a reduction of negative impacts on agro-ecosystems. The technology is an effective practice to provide a natural supply of mineral elements to the soil surface, while the stabilisation of root system improves the soil physical properties. Moreover, the permanent soil cover prevents water erosion and limits the leaching of nutrients (particularly nitrates) and pesticides.
Purpose of the Technology: The purpose of adopting a permanent green cover in orchards is the prevention of soil and water degradation, especially soil erosion by heavy rainfall events and water. Secondary purpose is restoring soil biodiversity through the soil protection from pesticides, heavy machinery equipment and loss of soil structure.
Establishment / maintenance activities and inputs: Green cover comprises naturally occurring, or sown, perennial grasses which form the permanent soil cover. The stabilisation of an herbaceous covering over the years allows the passage of machinery after rainfall events by improving the efficiency of farming operations. Due to the competition with fruit trees for nutrients, during the first 2-3 years following orchard plantations the soil is handled without a continuous cover or with a large strip of bare soil around the row. After system stabilisation, green vegetation is periodically cut, depending on the seasonal variability, and left on the soil surface as mulch.
Natural / human environment: If water is not a limiting factor for fruit production, the permanent vegetation cover is the best way to improve soil physical properties and generally soil fertility with a low economic investment. Moreover the technology acts as a filter for water depuration due to a reduction of water runoff and the consequent deposition of suspended solids sediment-bound nutrients.
2.3 Photos of the Technology
Media Gallery
2.5 Country/ region/ locations where the Technology has been applied and which are covered by this assessment
Country:
Italy
Region/ State/ Province:
Italy
Further specification of location:
Veneto region
2.6 Date of implementation
If precise year is not known, indicate approximate date:
- 10-50 years ago
2.7 Introduction of the Technology
Specify how the Technology was introduced:
- through land users' innovation
3. Classification of the SLM Technology
3.2 Current land use type(s) where the Technology is applied
Land use mixed within the same land unit:
Yes
Specify mixed land use (crops/ grazing/ trees):
- Agroforestry

Cropland
- Annual cropping
- Perennial (non-woody) cropping
- Tree and shrub cropping
Annual cropping - Specify crops:
- fodder crops - clover
- fodder crops - grasses
Perennial (non-woody) cropping - Specify crops:
- flower crops - perennial
Tree and shrub cropping - Specify crops:
- pome fruits (apples, pears, quinces, etc.)
- stone fruits (peach, apricot, cherry, plum, etc)
- kiwi
Number of growing seasons per year:
- 1
Specify:
Longest growing period in days: 210 Longest growing period from month to month: March to OctoberSecond longest growing period in days: 180
Comments:
Major cash crop perennial cropping: Apple, pear, peach, kiwi
Grass species: fescue, ryegrass, orchard grass, clover
Major land use problems (compiler’s opinion): Soils in the Veneto region generally suffer from a loss of soil organic matter (SOM) that is strongly affected by their natural texture and climatic conditions. In tree cropping systems, where permanent green cover is not applied, the problem of loss of soil fertility is associated with degradation of water resources due to sediment transportation and contaminations by excessive nutrients and pesticides.
3.5 SLM group to which the Technology belongs
- improved ground/ vegetation cover
- cross-slope measure
3.6 SLM measures comprising the Technology

agronomic measures
- A3: Soil surface treatment

vegetative measures
- V2: Grasses and perennial herbaceous plants
Comments:
Main measures: vegetative measures
Secondary measures: agronomic measures
Type of agronomic measures: mulching
Type of vegetative measures: scattered / dispersed
3.7 Main types of land degradation addressed by the Technology

biological degradation
- Bc: reduction of vegetation cover
water degradation
- Hp: decline of surface water quality
Comments:
Main type of degradation addressed: Bc: reduction of vegetation cover, Hp: decline of surface water quality
Main causes of degradation: soil management, population pressure
3.8 Prevention, reduction, or restoration of land degradation
Specify the goal of the Technology with regard to land degradation:
- prevent land degradation
- reduce land degradation
Comments:
Main goals: mitigation / reduction of land degradation
Secondary goals: prevention of land degradation
4. Technical specifications, implementation activities, inputs, and costs
4.1 Technical drawing of the Technology
Technical specifications (related to technical drawing):
Representation of an apple orchard with complete soil cover. Green cover around the trees is sometimes devitalised since the grass cutting is a time-consuming labour.
Location: Veneto region
Technical knowledge required for field staff / advisors: low
Technical knowledge required for land users: low
Main technical functions: control of raindrop splash, control of dispersed runoff: retain / trap, control of dispersed runoff: impede / retard, improvement of ground cover
Secondary technical functions: control of concentrated runoff: retain / trap, control of concentrated runoff: impede / retard, increase of surface roughness, increase in organic matter, increase in nutrient availability (supply, recycling,…), improvement of water quality, buffering / filtering water
Mulching
Material/ species: Grass mowing
Quantity/ density: 3 times/y
Scattered / dispersed
Vegetative material: G : grass
Grass species: fescue, ryegrass, orchard grass, clover
Author:
Nicola Dal Ferro
4.3 Establishment activities
| Activity | Timing (season) | |
|---|---|---|
| 1. | Establishment of grass cover | |
| 2. | Grass cutting |
4.4 Costs and inputs needed for establishment
| Specify input | Unit | Quantity | Costs per Unit | Total costs per input | % of costs borne by land users | |
|---|---|---|---|---|---|---|
| Labour | Grass cutting | ha | 1.0 | 100.0 | 100.0 | 100.0 |
| Plant material | Seeds | ha | 1.0 | 330.0 | 330.0 | 100.0 |
| Total costs for establishment of the Technology | 430.0 | |||||
| Total costs for establishment of the Technology in USD | 430.0 | |||||
4.5 Maintenance/ recurrent activities
| Activity | Timing/ frequency | |
|---|---|---|
| 1. | Green cover maintenance: cutting and mulching 2/4 times per year during growing season | |
| 2. | Weed control around trees |
4.6 Costs and inputs needed for maintenance/ recurrent activities (per year)
| Specify input | Unit | Quantity | Costs per Unit | Total costs per input | % of costs borne by land users | |
|---|---|---|---|---|---|---|
| Labour | Green cover cutting | ha | 1.0 | 100.0 | 100.0 | 100.0 |
| Equipment | Green cover maintenance: cutting and mulching | ha | 1.0 | 305.0 | 305.0 | 100.0 |
| Fertilizers and biocides | Biocides | ha | 1.0 | 63.0 | 63.0 | |
| Total costs for maintenance of the Technology | 468.0 | |||||
| Total costs for maintenance of the Technology in USD | 468.0 | |||||
4.7 Most important factors affecting the costs
Describe the most determinate factors affecting the costs:
Labour of grass cutting/mulching is the major cost component for SLT maintenance.
5. Natural and human environment
5.1 Climate
Annual rainfall
- < 250 mm
- 251-500 mm
- 501-750 mm
- 751-1,000 mm
- 1,001-1,500 mm
- 1,501-2,000 mm
- 2,001-3,000 mm
- 3,001-4,000 mm
- > 4,000 mm
Agro-climatic zone
- sub-humid
Thermal climate class: temperate
5.2 Topography
Slopes on average:
- flat (0-2%)
- gentle (3-5%)
- moderate (6-10%)
- rolling (11-15%)
- hilly (16-30%)
- steep (31-60%)
- very steep (>60%)
Landforms:
- plateau/plains
- ridges
- mountain slopes
- hill slopes
- footslopes
- valley floors
Altitudinal zone:
- 0-100 m a.s.l.
- 101-500 m a.s.l.
- 501-1,000 m a.s.l.
- 1,001-1,500 m a.s.l.
- 1,501-2,000 m a.s.l.
- 2,001-2,500 m a.s.l.
- 2,501-3,000 m a.s.l.
- 3,001-4,000 m a.s.l.
- > 4,000 m a.s.l.
5.3 Soils
Soil depth on average:
- very shallow (0-20 cm)
- shallow (21-50 cm)
- moderately deep (51-80 cm)
- deep (81-120 cm)
- very deep (> 120 cm)
Soil texture (topsoil):
- coarse/ light (sandy)
- medium (loamy, silty)
Topsoil organic matter:
- medium (1-3%)
- low (<1%)
If available, attach full soil description or specify the available information, e.g. soil type, soil PH/ acidity, Cation Exchange Capacity, nitrogen, salinity etc.
Soil fertility is low-medium
Soil drainage/infiltration is medium
Soil water storage is capacity medium
5.4 Water availability and quality
Ground water table:
< 5 m
Availability of surface water:
good
Water quality (untreated):
good drinking water
Comments and further specifications on water quality and quantity:
Groundwater table: <5m a.s.l. (The area surrounding the Venice lagoon (1240 km2) is even below the sea level (down to -2 m) and currently cultivated due to land reclamation. As a result water table is kept artificially low)
Water quality (untreated): Good drinking water (groundwater) and for agricultural use only (surface water can be used for agricultural purposes but not as drinking water)
5.5 Biodiversity
Species diversity:
- medium
Comments and further specifications on biodiversity:
High population density, infrastructures and intensive agriculture practices affect the state of biodiversity.
5.6 Characteristics of land users applying the Technology
Market orientation of production system:
- commercial/ market
Relative level of wealth:
- average
Individuals or groups:
- individual/ household
Level of mechanization:
- mechanized/ motorized
Indicate other relevant characteristics of the land users:
Land users applying the Technology are mainly common / average land users
Population density: 200-500 persons/km2
Annual population growth: 0.5% - 1%
100% of the land users are average wealthy.
5.7 Average area of land used by land users applying the Technology
- < 0.5 ha
- 0.5-1 ha
- 1-2 ha
- 2-5 ha
- 5-15 ha
- 15-50 ha
- 50-100 ha
- 100-500 ha
- 500-1,000 ha
- 1,000-10,000 ha
- > 10,000 ha
Is this considered small-, medium- or large-scale (referring to local context)?
- medium-scale
5.8 Land ownership, land use rights, and water use rights
Land use rights:
- individual
5.9 Access to services and infrastructure
health:
- poor
- moderate
- good
education:
- poor
- moderate
- good
technical assistance:
- poor
- moderate
- good
employment (e.g. off-farm):
- poor
- moderate
- good
markets:
- poor
- moderate
- good
energy:
- poor
- moderate
- good
roads and transport:
- poor
- moderate
- good
drinking water and sanitation:
- poor
- moderate
- good
financial services:
- poor
- moderate
- good
6. Impacts and concluding statements
6.1 On-site impacts the Technology has shown
Socio-economic impacts
Production
fodder production
land management
Socio-cultural impacts
conflict mitigation
Ecological impacts
Water cycle/ runoff
water quality
surface runoff
Soil
soil cover
soil loss
Biodiversity: vegetation, animals
habitat diversity
Other ecological impacts
Competition for water and nutrients
6.2 Off-site impacts the Technology has shown
buffering/ filtering capacity
6.3 Exposure and sensitivity of the Technology to gradual climate change and climate-related extremes/ disasters (as perceived by land users)
Gradual climate change
Gradual climate change
| Season | increase or decrease | How does the Technology cope with it? | |
|---|---|---|---|
| annual temperature | increase | well |
Climate-related extremes (disasters)
Meteorological disasters
| How does the Technology cope with it? | |
|---|---|
| local rainstorm | well |
Climatological disasters
| How does the Technology cope with it? | |
|---|---|
| drought | not well |
Hydrological disasters
| How does the Technology cope with it? | |
|---|---|
| general (river) flood | well |
Other climate-related consequences
Other climate-related consequences
| How does the Technology cope with it? | |
|---|---|
| reduced growing period | well |
6.4 Cost-benefit analysis
How do the benefits compare with the establishment costs (from land users’ perspective)?
{'template': 'raw', 'additional_translations': {}, 'key': 'Short-term returns', 'values': ['positive']}Long-term returns:
positive
How do the benefits compare with the maintenance/ recurrent costs (from land users' perspective)?
Short-term returns:
positive
Long-term returns:
positive
6.5 Adoption of the Technology
Of all those who have adopted the Technology, how many did so spontaneously, i.e. without receiving any material incentives/ payments?
- 91-100%
Comments:
100% of land user families have adopted the Technology without any external material support
6.7 Strengths/ advantages/ opportunities of the Technology
| Strengths/ advantages/ opportunities in the compiler’s or other key resource person’s view |
|---|
|
Prevents soil surface degradation How can they be sustained / enhanced? Maintain soil cover |
|
Improves soil biodiversity How can they be sustained / enhanced? Reduction/replacement of impactful pesticides on the environment |
|
Improves water quality How can they be sustained / enhanced? Reduction/replacement of impactful pesticides on the environment |
6.8 Weaknesses/ disadvantages/ risks of the Technology and ways of overcoming them
| Weaknesses/ disadvantages/ risks in the compiler’s or other key resource person’s view | How can they be overcome? |
|---|---|
| Competition for nutrients during the first 2/3 years after planting | Application of SLT only 2/3 years after fruit tree planting |
| Green cover competes for water resources depending on climate and season | Adoption of mulching and irrigation during very dry seasons |
7. References and links
7.1 Methods/ sources of information
Links and modules
Expand all Collapse allLinks
No links
Modules
No modules