Planted Vegetative Strips (PVS) [Philippines]
- Creation:
- Update:
- Compiler: Philippine Overview of Conservation Approaches and Technologies
- Editor: –
- Reviewers: Deborah Niggli, Alexandra Gavilano
technologies_1105 - Philippines
View sections
Expand all Collapse all1. General information
1.2 Contact details of resource persons and institutions involved in the assessment and documentation of the Technology
Key resource person(s)
SLM specialist:
Crisologo Victor
Cagayan Valley Integrated Agricultural Resources Research Center (CVIARRC)
Philippines
1.3 Conditions regarding the use of data documented through WOCAT
The compiler and key resource person(s) accept the conditions regarding the use of data documented through WOCAT:
Yes
1.4 Declaration on sustainability of the described Technology
Is the Technology described here problematic with regard to land degradation, so that it cannot be declared a sustainable land management technology?
No
2. Description of the SLM Technology
2.1 Short description of the Technology
Definition of the Technology:
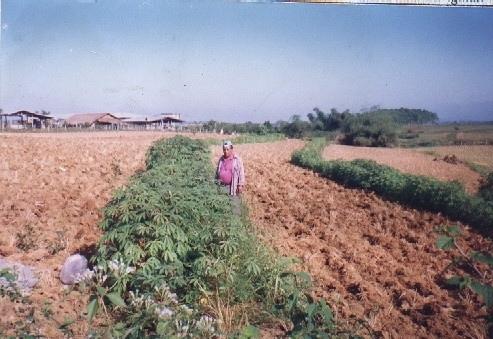
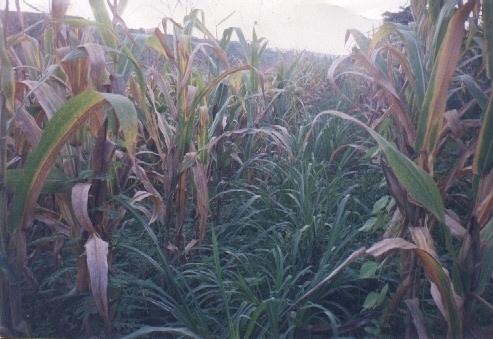
Planting of economic crops/forages in strips along the contour to control soil loss through erosion.
2.2 Detailed description of the Technology
Description:
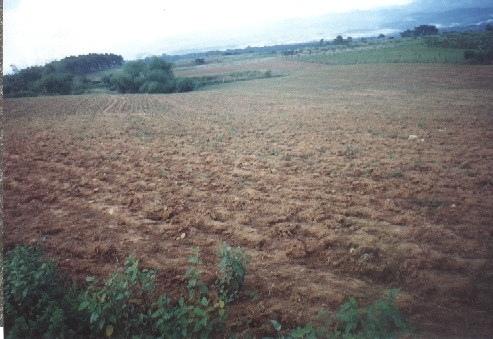
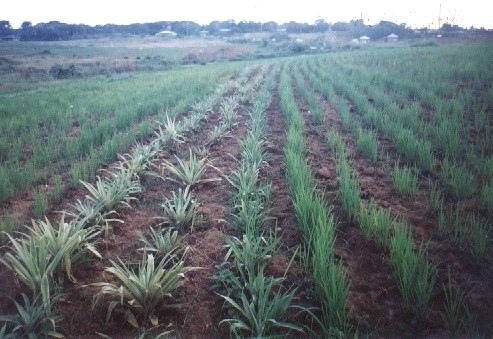
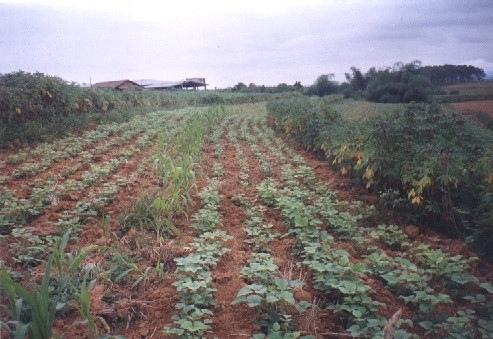
The technology was introduced in the upland corn growing areas in Isabela province. The province is one of the main corn growing areas in the Philippines. As a means of minimizing/controlling soil erosion, economic crops like cassava and pineapple and forage grasses are planted in strips along the contour. Cassava and pineapple strips are established together with forage grass. When the cassava and pineapple is harvested, the forage will continue to provide protection against soil erosion. Planting of cassava is done yearly, while the replanting cycle for pineapple is 2 to 3 years. In some cases, forage grass is grown alone. It is more or less permanent and it is trimmed regularly. Overtime, natural terraces are formed and soil erosion is minimized. The system is advatageous in the economic benefit can be gained from both the alley crops is there on the contour strips.
2.3 Photos of the Technology
Media Gallery
2.5 Country/ region/ locations where the Technology has been applied and which are covered by this assessment
Country:
Philippines
Region/ State/ Province:
Isabela
Further specification of location:
Isabela
Specify the spread of the Technology:
- evenly spread over an area
If the Technology is evenly spread over an area, specify area covered (in km2):
2.5
If precise area is not known, indicate approximate area covered:
- 1-10 km2
Comments:
Total area covered by the SLM Technology is 2.5 km2.
The technology was introduced in the upland corn growing area of Isabela. It was project-initiated
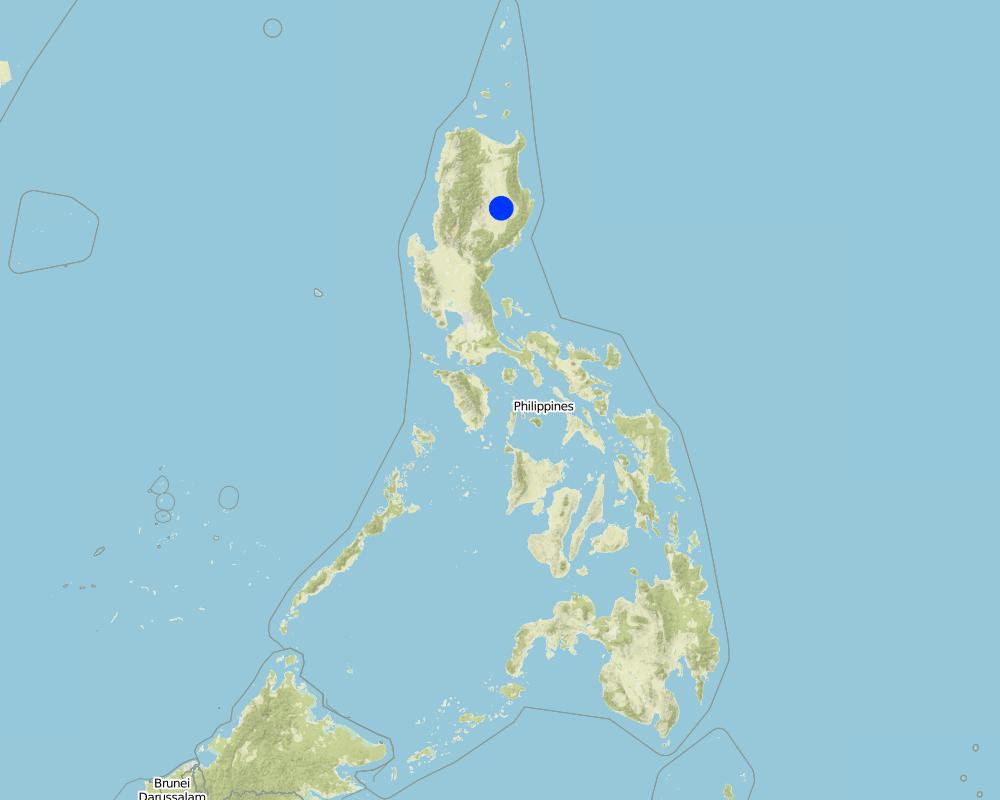
Map
×2.6 Date of implementation
If precise year is not known, indicate approximate date:
- less than 10 years ago (recently)
2.7 Introduction of the Technology
Specify how the Technology was introduced:
- through projects/ external interventions
Comments (type of project, etc.):
Introduced by extension staff
3. Classification of the SLM Technology
3.1 Main purpose(s) of the Technology
- reduce, prevent, restore land degradation
3.2 Current land use type(s) where the Technology is applied

Cropland
- Annual cropping
Number of growing seasons per year:
- 2
Specify:
Longest growing period in days: 240, Longest growing period from month to month: May - Dec; Second longest growing period in days: 180,Second longest growing period from month to month: Jun - Nov
Comments:
Major land use problems (compiler’s opinion): Severe soil erosion and fertility decline caused by intensive cropping (soil mining)
Major land use problems (land users’ perception): Productivity decline - increased application of fertilizers to obtain the same yield level.
3.5 SLM group to which the Technology belongs
- cross-slope measure
3.6 SLM measures comprising the Technology

agronomic measures
- A1: Vegetation/ soil cover
- A3: Soil surface treatment

vegetative measures
- V2: Grasses and perennial herbaceous plants
Comments:
Type of agronomic measures: contour planting / strip cropping, contour tillage
3.7 Main types of land degradation addressed by the Technology

soil erosion by water
- Wt: loss of topsoil/ surface erosion

chemical soil deterioration
- Cn: fertility decline and reduced organic matter content (not caused by erosion)
3.8 Prevention, reduction, or restoration of land degradation
Specify the goal of the Technology with regard to land degradation:
- prevent land degradation
4. Technical specifications, implementation activities, inputs, and costs
4.1 Technical drawing of the Technology
Technical specifications (related to technical drawing):
Artist impression about planted vegetative strips (PVS) technology
Location: Isabela
Technical knowledge required for field staff / advisors: moderate
Technical knowledge required for land users: moderate
Main technical functions: control of dispersed runoff: impede / retard
Secondary technical functions: reduction of slope angle, reduction of slope length
Contour planting / strip cropping
Material/ species: seeds/seedlings
Quantity/ density: 4000
Remarks: in strips along the contour
Contour tillage
Remarks: strip cropping
Vegetative measure: contour
Vegetative material: G : grass
Number of plants per (ha): 4000
Vertical interval between rows / strips / blocks (m): 1
Spacing between rows / strips / blocks (m): 4
Vertical interval within rows / strips / blocks (m): 0.5
Width within rows / strips / blocks (m): 1.2
Vegetative measure: in rows
Vegetative material: G : grass
Number of plants per (ha): 4000
Vertical interval between rows / strips / blocks (m): 1
Spacing between rows / strips / blocks (m): 4
Vertical interval within rows / strips / blocks (m): 0.5
Width within rows / strips / blocks (m): 1.2
Vegetative measure: Vegetative material: G : grass
Perennial crops species: pineapple
Grass species: napier
Other species: cassava
Slope (which determines the spacing indicated above): 8.00%
If the original slope has changed as a result of the Technology, the slope today is (see figure below): 3.00%
Author:
Boyet Yambot-BSWM
4.2 General information regarding the calculation of inputs and costs
other/ national currency (specify):
Philippine Peso
If relevant, indicate exchange rate from USD to local currency (e.g. 1 USD = 79.9 Brazilian Real): 1 USD =:
50.0
Indicate average wage cost of hired labour per day:
2.00
4.3 Establishment activities
| Activity | Timing (season) | |
|---|---|---|
| 1. | contouring | dry season |
| 2. | planting of vegetative strips (PVS) | onset of wet season |
| 3. | planting of alley crops | June/October |
4.4 Costs and inputs needed for establishment
| Specify input | Unit | Quantity | Costs per Unit | Total costs per input | % of costs borne by land users | |
|---|---|---|---|---|---|---|
| Labour | labour | ha | 1.0 | 20.0 | 20.0 | 100.0 |
| Equipment | animal traction | ha | 1.0 | 12.0 | 12.0 | 100.0 |
| Plant material | seeds | ha | 1.0 | 80.0 | 80.0 | 100.0 |
| Plant material | seedlings | ha | 1.0 | 32.0 | 32.0 | 100.0 |
| Total costs for establishment of the Technology | 144.0 | |||||
| Total costs for establishment of the Technology in USD | 2.88 | |||||
4.5 Maintenance/ recurrent activities
| Activity | Timing/ frequency | |
|---|---|---|
| 1. | Planting of vegetative strips (PVS) | onset of rainy season / once |
| 2. | Planting of alley crops | June/October / twice a year |
| 3. | Contouring | dry season / once |
| 4. | pruning/trimming (grass) | regular /every 2 weeks |
| 5. | fertilization (pineapple) | onset of rainy season /once a year |
4.6 Costs and inputs needed for maintenance/ recurrent activities (per year)
| Specify input | Unit | Quantity | Costs per Unit | Total costs per input | % of costs borne by land users | |
|---|---|---|---|---|---|---|
| Labour | labour | ha | 1.0 | 40.0 | 40.0 | 100.0 |
| Total costs for maintenance of the Technology | 40.0 | |||||
| Total costs for maintenance of the Technology in USD | 0.8 | |||||
Comments:
The total area to be used for PVS which is approximately 2000 square meters.
4.7 Most important factors affecting the costs
Describe the most determinate factors affecting the costs:
Labor and inputs costs are the main factors involved.
5. Natural and human environment
5.1 Climate
Annual rainfall
- < 250 mm
- 251-500 mm
- 501-750 mm
- 751-1,000 mm
- 1,001-1,500 mm
- 1,501-2,000 mm
- 2,001-3,000 mm
- 3,001-4,000 mm
- > 4,000 mm
Agro-climatic zone
- humid
Thermal climate class: tropics
5.2 Topography
Slopes on average:
- flat (0-2%)
- gentle (3-5%)
- moderate (6-10%)
- rolling (11-15%)
- hilly (16-30%)
- steep (31-60%)
- very steep (>60%)
Landforms:
- plateau/plains
- ridges
- mountain slopes
- hill slopes
- footslopes
- valley floors
Altitudinal zone:
- 0-100 m a.s.l.
- 101-500 m a.s.l.
- 501-1,000 m a.s.l.
- 1,001-1,500 m a.s.l.
- 1,501-2,000 m a.s.l.
- 2,001-2,500 m a.s.l.
- 2,501-3,000 m a.s.l.
- 3,001-4,000 m a.s.l.
- > 4,000 m a.s.l.
5.3 Soils
Soil depth on average:
- very shallow (0-20 cm)
- shallow (21-50 cm)
- moderately deep (51-80 cm)
- deep (81-120 cm)
- very deep (> 120 cm)
Soil texture (topsoil):
- medium (loamy, silty)
Topsoil organic matter:
- medium (1-3%)
- low (<1%)
5.6 Characteristics of land users applying the Technology
Market orientation of production system:
- mixed (subsistence/ commercial)
- commercial/ market
Off-farm income:
- > 50% of all income
Relative level of wealth:
- average
- rich
Indicate other relevant characteristics of the land users:
Population density: 50-100 persons/km2
Annual population growth: 2% - 3%
60% of the land users are very rich and own 60% of the land.
4% of the land users are rich and own 15% of the land.
1% of the land users are average wealthy and own 10% of the land.
20% of the land users are poor and own 10% of the land.
Off-farm income specification: Trading, working in other farms, carpentry or a family member working abroad
5.7 Average area of land used by land users applying the Technology
- < 0.5 ha
- 0.5-1 ha
- 1-2 ha
- 2-5 ha
- 5-15 ha
- 15-50 ha
- 50-100 ha
- 100-500 ha
- 500-1,000 ha
- 1,000-10,000 ha
- > 10,000 ha
Comments:
Land subdivision due to inheritance
5.8 Land ownership, land use rights, and water use rights
Land ownership:
- individual, titled
Land use rights:
- individual
6. Impacts and concluding statements
6.1 On-site impacts the Technology has shown
Socio-economic impacts
Production
crop production
fodder production
Comments/ specify:
Napier grass for work animals
fodder quality
Comments/ specify:
Napier grass for work animals
wood production
Comments/ specify:
from the PVS
Income and costs
economic disparities
workload
Comments/ specify:
PVS serves as barrier for field operation
Socio-cultural impacts
national institutions
Comments/ specify:
created awareness
Ecological impacts
Water cycle/ runoff
surface runoff
Quantity before SLM:
70
Quantity after SLM:
40
Soil
soil moisture
soil cover
soil loss
Quantity before SLM:
50
Quantity after SLM:
10
Biodiversity: vegetation, animals
pest/ disease control
Comments/ specify:
PVS can harbor pests
Other ecological impacts
Soil fertility
Production of extra food crops
Comments/ specify:
from the PVS
6.2 Off-site impacts the Technology has shown
downstream siltation
6.4 Cost-benefit analysis
How do the benefits compare with the establishment costs (from land users’ perspective)?
Short-term returns:
neutral/ balanced
Long-term returns:
positive
How do the benefits compare with the maintenance/ recurrent costs (from land users' perspective)?
Short-term returns:
slightly positive
Long-term returns:
positive
6.5 Adoption of the Technology
Of all those who have adopted the Technology, how many did so spontaneously, i.e. without receiving any material incentives/ payments?
- 91-100%
Comments:
100% of land user families have adopted the Technology without any external material support
20 land user families have adopted the Technology without any external material support
There is a moderate trend towards spontaneous adoption of the Technology. They can clearly see the benefit of adapting SWC practices in terms of added benefits (additional products, ecological)
6.7 Strengths/ advantages/ opportunities of the Technology
| Strengths/ advantages/ opportunities in the land user’s view |
|---|
| Training and provision of planting materials/inputs |
| Strengths/ advantages/ opportunities in the compiler’s or other key resource person’s view |
|---|
| Easy to establish and not capital intensive |
6.8 Weaknesses/ disadvantages/ risks of the Technology and ways of overcoming them
| Weaknesses/ disadvantages/ risks in the land user’s view | How can they be overcome? |
|---|---|
| PVS can harbor pests (e.g. rats) | Proper maintenance/cleanliness |
| Interfere with cultivation | Align PVS in a straight manner if the contour allows |
| Need additional capital | Provisions of incentives (e.g. subsidized inputs) |
| Weaknesses/ disadvantages/ risks in the compiler’s or other key resource person’s view | How can they be overcome? |
|---|---|
| Low effectivity of some PVS species/materials | Supplementary control measures (mulching, temporary barriers) |
| Yearly establishment (e.g. cassava) | Consider perennial species as PVS (e.g. forage grass) |
| Competition for nutrient and water | Application of fertilizer and use of water harvesting techniques. |
7. References and links
7.1 Methods/ sources of information
- field visits, field surveys
- interviews with land users
When were the data compiled (in the field)?
24/08/2001
Links and modules
Expand all Collapse allLinks
No links
Modules
No modules