Index Based Livestock Insurance
(Kenya)
IBLI
Description
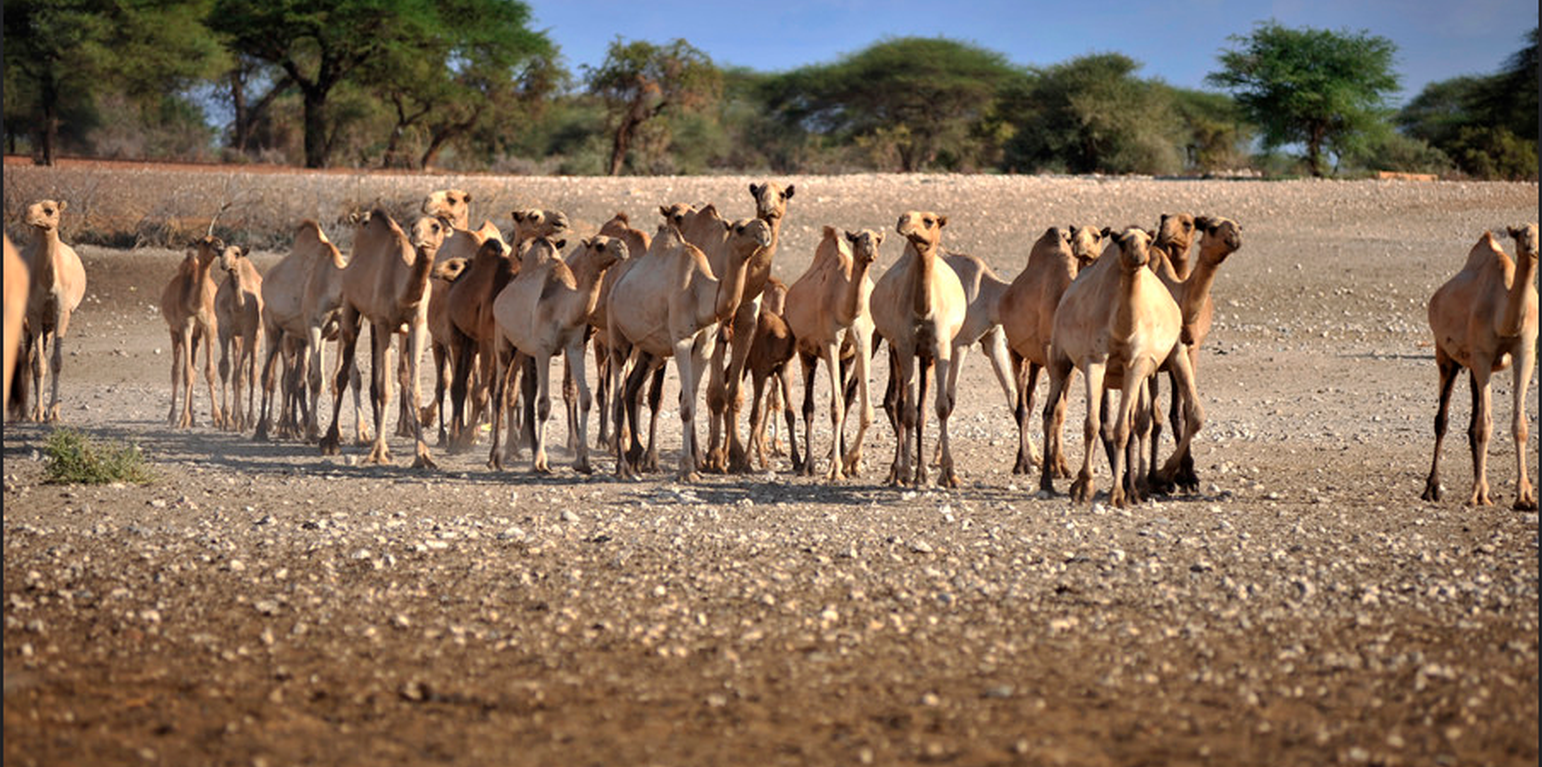
Index-Based Livestock Insurance (IBLI) is a product that was designed to help protect pastoralists and their livestock against the effects of prolonged forage scarcity. IBLI triggers payments to pastoralists when the forage situation deteriorates to levels considered to be severe, compared with historical conditions.
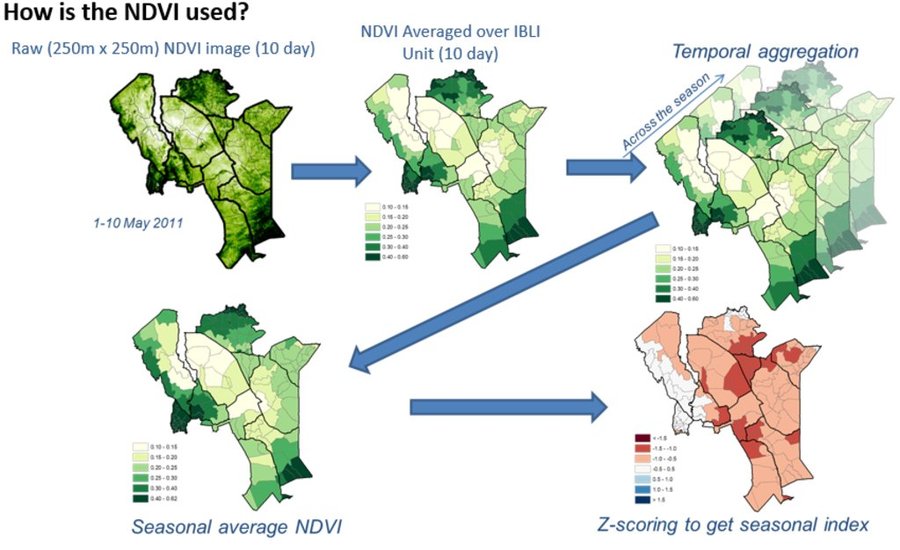
In the event of severe seasonal drought, forage and grazing resources are depleted and livestock may die because of starvation. Index Based Livestock Insurance (IBLI) is a technology applied in the provision of forage based livestock (asset) insurance protection. IBLI uses Normalized Difference Vegetation Index (NDVI), a satellite-derived indicator of the amount and vigour of vegetation, based on the observed level of photosynthetic activity (Tucker et al., 2005). NDVI is derived from 10-day composites of 250m filtered eMODIS processed by the United States National Aeronautics and Space Administration (NASA) and transformed by The Earth Resources Observation Systems (EROS) Data Center (EDC) of the US Geological Survey (USGS). NDVI data from the AQUA satellite platform are available from July 2002 to present at https://lta.cr.usgs.gov/emodis.
In the case of IBLI, the index is a deviation of cumulative forage availability (ZCumNDVI) in the insured season. It measures forage conditions over a defined time period and compares the observed NDVI over a particular season, with the observed NDVI over a given historical period (e.g. 15 years). A set threshold below which payouts must be made is called the trigger level. In this example, when the forage situation in a given season is worse than the 20th worst season in the last 15 years (30 seasons), a payout is triggered. In other words, IBLI will compensate if the forage conditions fall below the worst 20th percentile of seasonal forage levels cumulated over the historical drought seasons in the past 15 years. IBLI therefore uses this satellite-based vegetation index to measure forage availability and to trigger timely payouts to pastoralists based on the costs of providing supplementary feeds to the animals for the specific season that a drought is triggered.
For precision and proper administration each insured county is broken down into smaller units of insurance. These are referred to as Unit Areas of Insurance (UAIs). Each UAI represents a geographical area whose forage availability index data are aggregated as one unit for insurance purposes. The identification of the geographic areas that constitute UAIs is a key step in IBLI contract design. This is because the use of average NDVI over insurable units is based on the premise that drought is a covariate shock and that pastoral communities affected in a particular area are deemed to suffer in equal measure. Thus, for accuracy and acceptability, the index should be tightly correlated with forage scarcity and reflect conditions on the ground. Also, forage access should be relatively homogeneous for herders residing in the same insurable unit. The process of demarcating UAIs is known as clustering. It is done through a combination of active participatory community engagement with scientific methods.
Insured pastoralists are not always paid when there is drought. They are only paid when drought is so severe that the amount of forage falls below the strike level. Insured pastoralists will not receive payments if the forage availability is more than the strike level. This is an annual policy which covers forage availability as measured by satellite Normalized Difference Vegetation Index (NDVI) in up to 2 rainy seasons as per the bimodal rain patterns in northern Kenya. Pastoralists who do not hold insurance contracts are not covered, and therefore do not receive payments, even if they live in the same UAIs as those who have insured their livestock.
Lieu
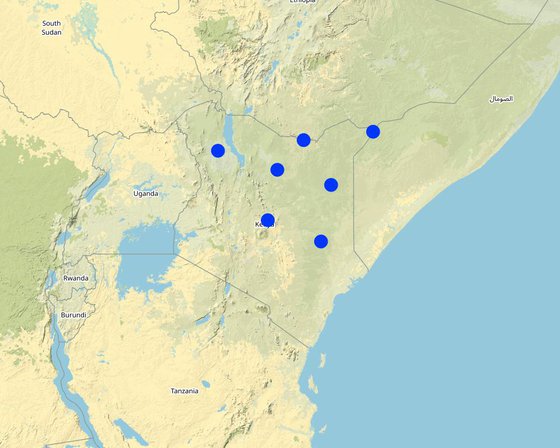
Lieu: Kenya
Nbr de sites de la Technologie analysés: 2-10 sites
Géo-référence des sites sélectionnés
-
35.63652, 3.05989
-
37.96562, 2.31365
-
40.08598, 1.72076
-
39.00932, 3.47669
-
41.72294, 3.80562
-
39.67949, -0.49822
-
37.59508, 0.33855
Diffusion de la Technologie: répartie uniformément sur une zone (approx. 100-1 000 km2)
Dans des zones protégées en permanence ?:
Date de mise en oeuvre: il y a moins de 10 ans (récemment)
Type d'introduction
-
grâce à l'innovation d'exploitants des terres
-
dans le cadre d'un système traditionnel (> 50 ans)
-
au cours d'expérimentations / de recherches
-
par le biais de projets/ d'interventions extérieures
Credits to ILRI
Credits to ILRI
Classification de la Technologie
Principal objectif
-
améliorer la production
-
réduire, prévenir, restaurer les terres dégradées
-
préserver l'écosystème
-
protéger un bassin versant/ des zones situées en aval - en combinaison avec d'autres technologies
-
conserver/ améliorer la biodiversité
-
réduire les risques de catastrophes
-
s'adapter au changement et aux extrêmes climatiques et à leurs impacts
-
atténuer le changement climatique et ses impacts
-
créer un impact économique positif
-
créer un impact social positif
L'utilisation des terres
-
Pâturages
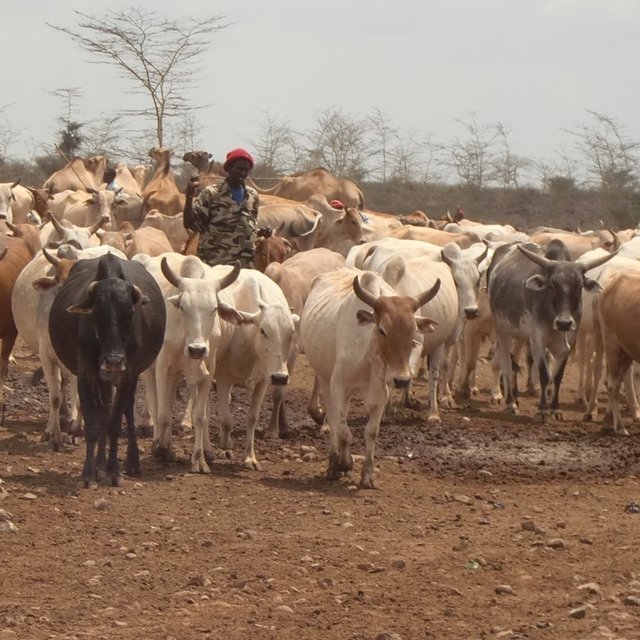
- Nomadisme
- Pastoralisme de type semi-nomade
Type d'animal: caprine, chameaux, ovins, cattle
Approvisionnement en eau
-
pluvial
-
mixte: pluvial-irrigué
-
pleine irrigation
But relatif à la dégradation des terres
-
prévenir la dégradation des terres
-
réduire la dégradation des terres
-
restaurer/ réhabiliter des terres sévèrement dégradées
-
s'adapter à la dégradation des terres
-
non applicable
Dégradation des terres traité
Groupe de GDT
-
pastoralisme et gestion des pâturages
Dessin technique
Spécifications techniques
Picture 1 &2: Monthly NDVI for each insured unit in a month is derived by averaging the 10-day NDVI values for each Insured Unit over the three 10-days periods in each month, where the 10-day NDVI value for each Insured Unit is derived by averaging the pixel-level NDVI of all the pixels that fall within the insured unit boundary.
Picture 3: An accumulation of monthly NDVI over the critical months of each season starting from the beginning of the season (March for LRLD and October for SRSD).
Picture 4: There is a representation of a cumulation of monthly NDVI (CumNDVI) which represents the evolution of green vegetation and can be used as a proxy of the green biomass that has developed, and as such a proxy of the available forage across the season.
Picture 5: Deviation of Cumulative NDVI from normal conditions of the particular season and insured unit (ZCumNDVI) - is derived by
subtracting CumNDVI derived for each season and each insured unit by the long-term historical average value and dividing by long-term historical standard deviation of the particular season (SRSD or LRLD) in each
insured unit. ZCumNDVI thus measures the deviation from the historical mean,
expressed as a standard deviation. A positive ZCumNDVI value therefore indicates above normal vegetation cover while negative ZNDVI value indicates below normal vegetation. The purpose of this transformation is to provide an indicator that expresses current forage conditions in comparison to average forage conditions for each specific insurance unit
at the prescribed period within the season.
NOTE: The delineations used in this figure are just for purposes of illustration, assuming Kenya as an entire unit. However, IBLI used smaller delineated units which can be seen in the lines with lighter shade within the map.
Mise en œuvre et entretien : activités, intrants et coûts
Calcul des intrants et des coûts
- Les coûts sont calculés :
- Monnaie utilisée pour le calcul des coûts : sans objet
- Taux de change (en dollars américains - USD) : 1 USD = n.d.
- Coût salarial moyen de la main-d'oeuvre par jour : n.d.
Facteurs les plus importants affectant les coûts
sans objet
Activités de mise en place/ d'établissement
n.a.
Activités récurrentes d'entretien
n.a.
Environnement naturel
Précipitations annuelles
-
< 250 mm
-
251-500 mm
-
501-750 mm
-
751-1000 mm
-
1001-1500 mm
-
1501-2000 mm
-
2001-3000 mm
-
3001-4000 mm
-
> 4000 mm
Zones agro-climatiques
-
humide
-
subhumide
-
semi-aride
-
aride
Spécifications sur le climat
Nom de la station météorologique : Kenya Meteorological Department
Pentes moyennes
-
plat (0-2 %)
-
faible (3-5%)
-
modéré (6-10%)
-
onduleux (11-15%)
-
vallonné (16-30%)
-
raide (31-60%)
-
très raide (>60%)
Reliefs
-
plateaux/ plaines
-
crêtes
-
flancs/ pentes de montagne
-
flancs/ pentes de colline
-
piémonts/ glacis (bas de pente)
-
fonds de vallée/bas-fonds
Zones altitudinales
-
0-100 m
-
101-500 m
-
501-1000 m
-
1001-1500 m
-
1501-2000 m
-
2001-2500 m
-
2501-3000 m
-
3001-4000 m
-
> 4000 m
La Technologie est appliquée dans
-
situations convexes
-
situations concaves
-
non pertinent
Profondeurs moyennes du sol
-
très superficiel (0-20 cm)
-
superficiel (21-50 cm)
-
modérément profond (51-80 cm)
-
profond (81-120 cm)
-
très profond (>120 cm)
Textures du sol (de la couche arable)
-
grossier/ léger (sablonneux)
-
moyen (limoneux)
-
fin/ lourd (argile)
Textures du sol (> 20 cm sous la surface)
-
grossier/ léger (sablonneux)
-
moyen (limoneux)
-
fin/ lourd (argile)
Matière organique de la couche arable
-
abondant (>3%)
-
moyen (1-3%)
-
faible (<1%)
Profondeur estimée de l’eau dans le sol
-
en surface
-
< 5 m
-
5-50 m
-
> 50 m
Disponibilité de l’eau de surface
-
excès
-
bonne
-
moyenne
-
faible/ absente
Qualité de l’eau (non traitée)
-
eau potable
-
faiblement potable (traitement nécessaire)
-
uniquement pour usage agricole (irrigation)
-
eau inutilisable
La qualité de l'eau fait référence à:
La salinité de l'eau est-elle un problème ?
Présence d'inondations
Caractéristiques des exploitants des terres appliquant la Technologie
Orientation du système de production
-
subsistance (auto-approvisionnement)
-
exploitation mixte (de subsistance/ commerciale)
-
commercial/ de marché
Revenus hors exploitation
-
moins de 10% de tous les revenus
-
10-50% de tous les revenus
-
> 50% de tous les revenus
Niveau relatif de richesse
-
très pauvre
-
pauvre
-
moyen
-
riche
-
très riche
Niveau de mécanisation
-
travail manuel
-
traction animale
-
mécanisé/ motorisé
Sédentaire ou nomade
-
Sédentaire
-
Semi-nomade
-
Nomade
Individus ou groupes
-
individu/ ménage
-
groupe/ communauté
-
coopérative
-
employé (entreprise, gouvernement)
Âge
-
enfants
-
jeunes
-
personnes d'âge moyen
-
personnes âgées
Superficie utilisée par ménage
-
< 0,5 ha
-
0,5-1 ha
-
1-2 ha
-
2-5 ha
-
5-15 ha
-
15-50 ha
-
50-100 ha
-
100-500 ha
-
500-1 000 ha
-
1 000-10 000 ha
-
> 10 000 ha
Échelle
-
petite dimension
-
moyenne dimension
-
grande dimension
Propriété foncière
-
état
-
entreprise
-
communauté/ village
-
groupe
-
individu, sans titre de propriété
-
individu, avec titre de propriété
Droits d’utilisation des terres
-
accès libre (non organisé)
-
communautaire (organisé)
-
loué
-
individuel
Droits d’utilisation de l’eau
-
accès libre (non organisé)
-
communautaire (organisé)
-
loué
-
individuel
Accès aux services et aux infrastructures
emploi (par ex. hors exploitation)
eau potable et assainissement
Impact
Impacts socio-économiques
Impacts socioculturels
sécurité alimentaire/ autosuffisance
situation des groupes socialement et économiquement désavantagés (genre, âge, statut, ethnie, etc.)
Impacts écologiques
impacts de la sécheresse
en augmentation
en baisse
Impacts hors site
Reduction of livestock mortality as a result of forage scarcity due to drought.
Analyse coûts-bénéfices
Bénéfices par rapport aux coûts de mise en place
Rentabilité à court terme
très négative
très positive
Rentabilité à long terme
très négative
très positive
Bénéfices par rapport aux coûts d'entretien
Rentabilité à court terme
très négative
très positive
Rentabilité à long terme
très négative
très positive
Changement climatique
Changements climatiques progressifs
précipitations annuelles décroît
pas bien du tout
très bien
Extrêmes climatiques (catastrophes)
pas bien du tout
très bien
pas bien du tout
très bien
Adoption et adaptation de la Technologie
Pourcentage d'exploitants des terres ayant adopté la Technologie dans la région
-
cas isolés/ expérimentaux
-
1-10%
-
11-50%
-
> 50%
Parmi tous ceux qui ont adopté la Technologie, combien d'entre eux l'ont fait spontanément, à savoir sans recevoir aucune incitation matérielle ou aucun paiement ?
-
0-10%
-
11-50%
-
51-90%
-
91-100%
Nombre de ménages et/ou superficie couverte
over 25,000 households
La Technologie a-t-elle été récemment modifiée pour s'adapter à l'évolution des conditions ?
A quel changement ?
-
changements/ extrêmes climatiques
-
évolution des marchés
-
la disponibilité de la main-d'œuvre (par ex., en raison de migrations)
Conclusions et enseignements tirés
Points forts: point de vue de l'exploitant des terres
-
The use NDVI for forage monitoring in provision of IBLI eliminates the high costs of loss verification which would otherwise be expensive and consuming in the case of vast and remote ASALs of Kenya.
Points forts: point de vue du compilateur ou d'une autre personne-ressource clé
-
IBLI contract design is based on robust scientific design which is easily verifiable hence boosting trust in the product.
Faiblesses/ inconvénients/ risques: point de vue de l'exploitant des terrescomment surmonter
-
A key concern of index-insurance products is that there might occur variances in perceived loss versus the actual payouts (basis risk)
Proper contract design should be backed with ground truthing efforts together with awareness creation.
Faiblesses/ inconvénients/ risques: point de vue du compilateur ou d'une autre personne-ressource clécomment surmonter
-
Basis risk is a weakness with IBLI as they could arise differences in perceived level of forage scarcity by the clients,
vis a vis the index trigger level indicated by the NDVI data. Increased precision in contract design alongside proper capacity and awareness creation to the pastoralists can help mitigate this challenge.
Références
Examinateur
-
Alexandra Gavilano
-
Rima Mekdaschi Studer
-
Donia Mühlematter
-
Hanspeter Liniger
-
Joana Eichenberger
Date de mise en oeuvre: 24 janvier 2018
Dernière mise à jour: 2 novembre 2021
Personnes-ressources
-
Duncan Collins Khalai - Spécialiste GDT
Description complète dans la base de données WOCAT
Données de GDT correspondantes
La documentation a été facilitée par
Institution
- ILRI International Livestock Research Institute (ILRI) - Kenya
Projet
- Book project: Guidelines to Rangeland Management in Sub-Saharan Africa (Rangeland Management)
- Index Based Livestock Insurance, Kenya (IBLI)
Références clés
-
Chelang'a et. al 2017:
-
Tucker et al., 2005:
Liens vers des informations pertinentes disponibles en ligne