Holistic demonstration [India]
- Creation:
- Update:
- Compiler: Unknown User
- Editor: –
- Reviewers: Fabian Ottiger, Alexandra Gavilano
Samagra Jalanayan Abhivrudhi Pratyakshike (Kannada)
technologies_1084 - India
View sections
Expand all Collapse all1. General information
1.3 Conditions regarding the use of data documented through WOCAT
The compiler and key resource person(s) accept the conditions regarding the use of data documented through WOCAT:
Yes
2. Description of the SLM Technology
2.1 Short description of the Technology
Definition of the Technology:
Holistic demonstration includes integrated cultivation of Agri-Horti-Silvi technologies. Along with the Soil & water Conservation structures suitable to the site.
2.2 Detailed description of the Technology
Description:
Holistic demonstration was taken in the upper reach, middle reach and lower reach (2 hectares each) in a village in the watershed. The demonstration units includes soil & water consercvation structures also. Crop demonstration with integrated pest management, seed treatment, pitcher irrigation practices, varietal trails were implemented to increase the overall per capita income of the farmer. However, the suitable SWC was according to the site of lower reach/ upper reach or middle reach. The plot was accommodated with suitable field crops, horticultural species either on the bunds or in the fiels itself and some fodder crops, some forestry species etc.
Purpose of the Technology: The demonstration units now serve as the units of awareness brining in understanding the holistic approach and also to encourage the other farmers to replicate the same in their fields.
Establishment / maintenance activities and inputs: (1) site selection with concerned farmer, (2) design and preparation of estimates by the project staff, (3) discussion with the VWDC and community, (4) discussion regarding contribution with the farmer (5) layout and construction by the project staff with the contribution from the concerned farmers.
Natural / human environment: This technology was taken up in the semi arid condition and in the erratic rainfall condition.
2.3 Photos of the Technology
Media Gallery
2.5 Country/ region/ locations where the Technology has been applied and which are covered by this assessment
Country:
India
Region/ State/ Province:
Karnataka
Further specification of location:
Chitapur taluk of Gulbarga district
Specify the spread of the Technology:
- evenly spread over an area
If the Technology is evenly spread over an area, specify area covered (in km2):
0.12
If precise area is not known, indicate approximate area covered:
- < 0.1 km2 (10 ha)
Comments:
Total area covered by the SLM Technology is 0.12 km2.
The technology area comprises of 2 ha area each in upper reach, middle reach and lower reach in a village of the watershed. In this area cultivation of agri-horti-silvi practices, agronomic trials, in-situ conservation etc were taken with active involvement of the the farmers.
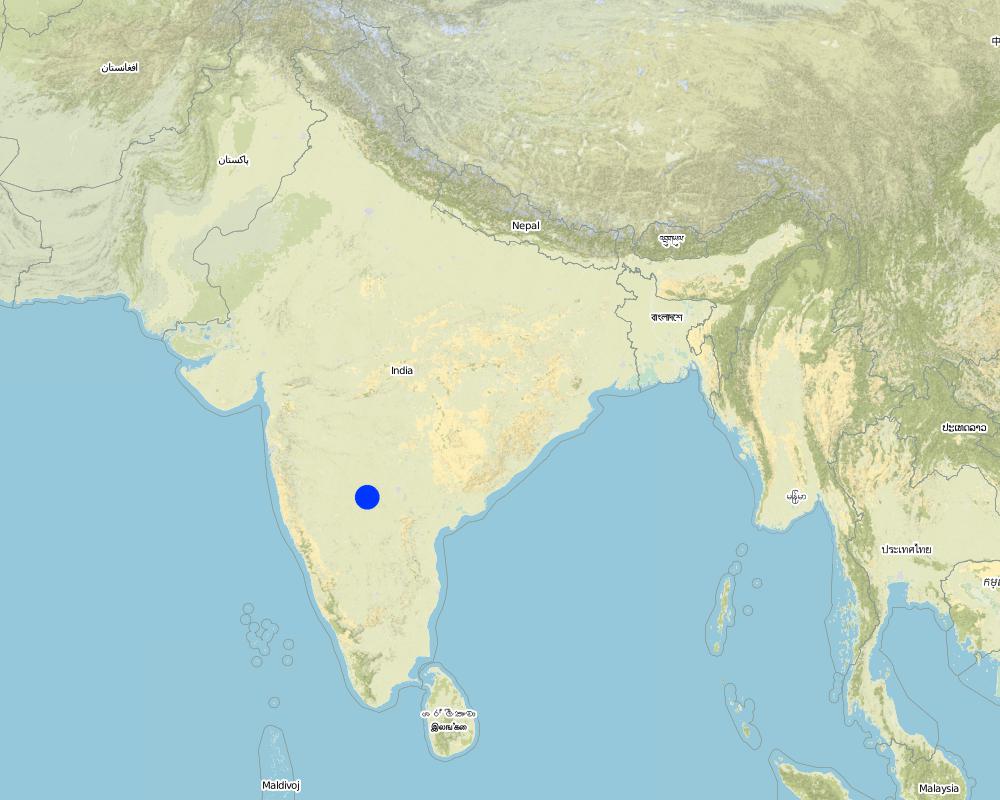
Map
×2.6 Date of implementation
If precise year is not known, indicate approximate date:
- more than 50 years ago (traditional)
2.7 Introduction of the Technology
Specify how the Technology was introduced:
- through projects/ external interventions
Comments (type of project, etc.):
Mainly from the SWC specialist
3. Classification of the SLM Technology
3.1 Main purpose(s) of the Technology
- improve production
- reduce, prevent, restore land degradation
3.2 Current land use type(s) where the Technology is applied
Land use mixed within the same land unit:
Yes
Specify mixed land use (crops/ grazing/ trees):
- Agro-silvopastoralism

Cropland
- Annual cropping
- Perennial (non-woody) cropping
- Tree and shrub cropping
Annual cropping - Specify crops:
- cereals - sorghum
- fodder crops - grasses
- legumes and pulses - other
- legumes and pulses - peas
- seed crops - sesame, poppy, mustard, other
Perennial (non-woody) cropping - Specify crops:
- medicinal, aromatic, pesticidal plants - perennial
Tree and shrub cropping - Specify crops:
- citrus
- fruits, other
- mango, mangosteen, guava
- pome fruits (apples, pears, quinces, etc.)
- Tree croppisapota (cf. Sapotaceae family), drumstick (cf. Moringa oleifera), Tamarind, Gliricidia (Gliricidia sepium perennial, medium-sized (2-15 m high) legume tree) pongama (legume)
Number of growing seasons per year:
- 2
Specify:
Longest growing period in days: 120 Longest growing period from month to month: Jun - Oct Second longest growing period in days: 120 Second longest growing period from month to month: Nov - Feb

Grazing land
Extensive grazing:
- Semi-nomadic pastoralism
- cattle
Forest/ woodlands
- Tree plantation, afforestation
Type of tree:
- Azadirachta indica
- Bamboo bamboo
- Tectona grandis
Products and services:
- Timber
- Fuelwood
- Fruits and nuts
- Nature conservation/ protection
Comments:
Major land use problems (compiler’s opinion): Crop land : Low yields due to erosion, less soil moisture, shallow to medium soils. Poor and erratic rainfall, water holding capacity is less.
Major land use problems (land users’ perception): Crop land - Uncertain rainfall, more soil loss and poor yields.
Semi-nomadism / pastoralism: the village cattle are let free for grazing on the common land for some time in the day and they go back and then I is again stall feeding.
Plantation forestry: Yes
Other type of forest: others (scattered)
Type of cropping system and major crops comments: During kharif (monsoon) season the main crop is redgram (Tur), in addition few cereals were taken, followed by jowar in the major rabi (post-monsoon) crop. No cultivation was o\bserved in summer, farmer are now cultivating vegetable and fruit crop,
Trees/ shrubs species: Neem, Glyricdia, Pongamia, Bamboo
Fruit trees / shrubs species: Mango. Tamarind, Lime, Sapota, Clustard apple
Grass species: Napiar
3.4 Water supply
Water supply for the land on which the Technology is applied:
- rainfed
Comments:
Water supply: Also mixed rainfed - irrigated and post-flooding (both ranked 2)
3.5 SLM group to which the Technology belongs
- minimal soil disturbance
- integrated pest and disease management (incl. organic agriculture)
- irrigation management (incl. water supply, drainage)
3.6 SLM measures comprising the Technology
3.7 Main types of land degradation addressed by the Technology

soil erosion by water
- Wt: loss of topsoil/ surface erosion
- Wg: gully erosion/ gullying
Comments:
Main type of degradation addressed: Wg: gully erosion / gullying
Secondary types of degradation addressed: Wt: loss of topsoil / surface erosion
Main causes of degradation: other natural causes (avalanches, volcanic eruptions, mud flows, highly susceptible natural resources, extreme topography, etc.) specify, poverty / wealth (lack of captial)
Secondary causes of degradation: other human induced causes (specify) (other (migration)), labour availability (lack of labour, cost of labour), education, access to knowledge and support services (lack of knowledge)
3.8 Prevention, reduction, or restoration of land degradation
Specify the goal of the Technology with regard to land degradation:
- reduce land degradation
- restore/ rehabilitate severely degraded land
Comments:
Main goals: mitigation / reduction of land degradation
Secondary goals: rehabilitation / reclamation of denuded land
4. Technical specifications, implementation activities, inputs, and costs
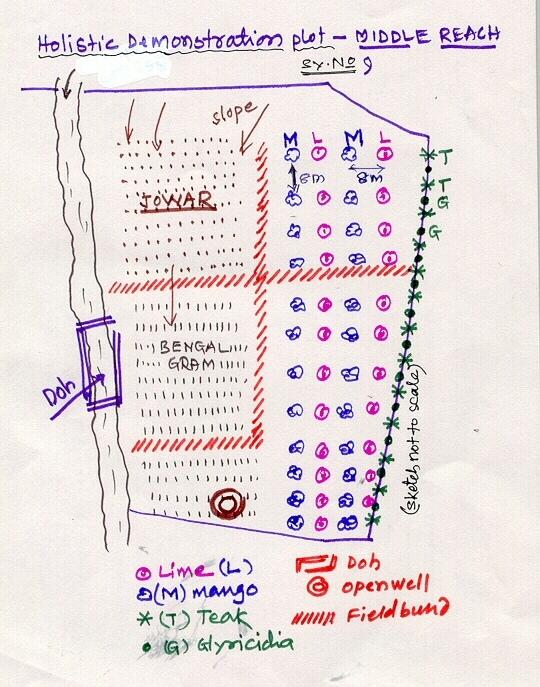
4.1 Technical drawing of the Technology
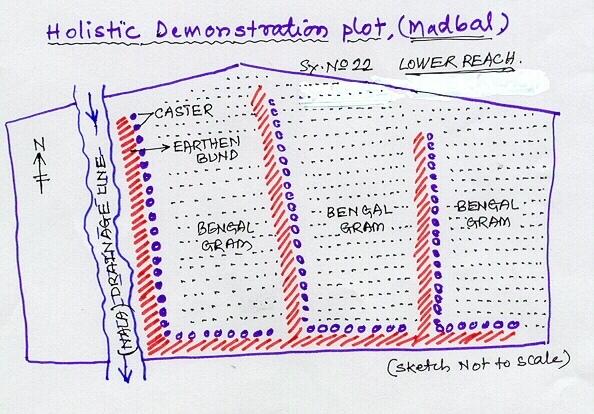
Technical specifications (related to technical drawing):
Lower Reach holistic demonstration plot showing various soil & moisture conservation structures, field crops and bund stabilization by vegetation.
Location: Bennur-B nala watershed Chitapur taluk. Chitapur taluk, Gulbarga District (Karnataka state
Date: 20.4.2004
Technical knowledge required for field staff / advisors: high
Technical knowledge required for land users: high
Main technical functions: increase in organic matter, water harvesting / increase water supply, increase in soil fertility
Secondary technical functions: control of dispersed runoff: retain / trap, control of concentrated runoff: retain / trap, improvement of ground cover, sediment retention / trapping, sediment harvesting
Mixed cropping / intercropping
Material/ species: saplings
Quantity/ density: 100
Remarks: layout
Contour planting / strip cropping
Material/ species: sapplings
Quantity/ density: 360
Remarks: layout
Legume inter-planting
Quantity/ density: 200
Remarks: layout
Agronomic measure: others (vermicompost)
Material/ species: material
Minimum tillage
Remarks: material
Aligned: -contour
Vegetative material: G : grass
Number of plants per (ha): 100
Vertical interval between rows / strips / blocks (m): 1
Vertical interval within rows / strips / blocks (m): 0.5
Scattered / dispersed
Vegetative material: T : trees / shrubs
Number of plants per (ha): 500
Trees/ shrubs species: Neem, Glyricdia, Pongamia, Bamboo
Fruit trees / shrubs species: Mango. Tamarind, Lime, Sapota, Clustard apple
Grass species: Napiar
Slope (which determines the spacing indicated above): 3.00%
If the original slope has changed as a result of the Technology, the slope today is (see figure below): 2.00%
Gradient along the rows / strips: 1.00%
Dam/ pan/ pond
Vertical interval between structures (m): 4
Spacing between structures (m): 50
Depth of ditches/pits/dams (m): 3
Width of ditches/pits/dams (m): 12
Length of ditches/pits/dams (m): 12
Height of bunds/banks/others (m): 3
Width of bunds/banks/others (m): 12
Length of bunds/banks/others (m): 12
Bund/ bank: semi-circular/V shaped trapezoidal
Vertical interval between structures (m): 4
Spacing between structures (m): 50
Depth of ditches/pits/dams (m): 0
Width of ditches/pits/dams (m): 3
Length of ditches/pits/dams (m): 50
Height of bunds/banks/others (m): 0.9
Width of bunds/banks/others (m): 3
Length of bunds/banks/others (m): 50
Structural measure: pit, sediment sand / trap
Vertical interval between structures (m): 1
Spacing between structures (m): 30-40
Depth of ditches/pits/dams (m): 0.3
Width of ditches/pits/dams (m): 0.3
Length of ditches/pits/dams (m): 6
Height of bunds/banks/others (m): 0.9
Width of bunds/banks/others (m): 3
Length of bunds/banks/others (m): 50
Structural measure: other (brushwood dam)
Vertical interval between structures (m): 1
Spacing between structures (m): 80
Depth of ditches/pits/dams (m): 0
Width of ditches/pits/dams (m): 1
Length of ditches/pits/dams (m): 6
Height of bunds/banks/others (m): 0.9
Width of bunds/banks/others (m): 0
Length of bunds/banks/others (m): 0
Slope (which determines the spacing indicated above): 1%
If the original slope has changed as a result of the Technology, the slope today is: 2%
Lateral gradient along the structure: 1%
For water harvesting: the ratio between the area where the harvested water is applied and the total area from which water is collected is: 1:10
Vegetation is used for stabilisation of structures.
Change of land use type: Multidimensional participatory holistic farming system, fallow to cultivable land
Author:
GK Ron, JPO KWDP Danida Bijapu
4.2 General information regarding the calculation of inputs and costs
other/ national currency (specify):
Rupees
If relevant, indicate exchange rate from USD to local currency (e.g. 1 USD = 79.9 Brazilian Real): 1 USD =:
46.0
Indicate average wage cost of hired labour per day:
0.73
4.3 Establishment activities
| Activity | Timing (season) | |
|---|---|---|
| 1. | Digging of pits | Sumer |
| 2. | Procurement of seed/ seedlings | Before rainy season |
| 3. | Sowing of grass, shrub seeds | After first shower |
| 4. | Planting of sappling | After first shower |
| 5. | Survey/ layout | April |
| 6. | Excavation of ditches | may |
| 7. | Transportation of stones to the site | May |
| 8. | Construction of bunds, farm pond | may |
| 9. | Construction of brushwood dam, doh | June |
| 10. | Training, capacity building of the farmer | february - March |
| 11. | Establishment of sructural measures | April-June |
| 12. | establishment of vegetative measures | July-September |
4.4 Costs and inputs needed for establishment
| Specify input | Unit | Quantity | Costs per Unit | Total costs per input | % of costs borne by land users | |
|---|---|---|---|---|---|---|
| Labour | Labour | ha | 1.0 | 510.0 | 510.0 | 10.0 |
| Plant material | Seeds | ha | 1.0 | 114.0 | 114.0 | 3.0 |
| Plant material | Seedlings | ha | 1.0 | 169.0 | 169.0 | 74.0 |
| Fertilizers and biocides | fertilizer | ha | 1.0 | 157.0 | 157.0 | |
| Fertilizers and biocides | Biocides | ha | 1.0 | 76.0 | 76.0 | |
| Fertilizers and biocides | Compost/manure | ha | 1.0 | 15.0 | 15.0 | 10.0 |
| Construction material | Stone | ha | 1.0 | 110.0 | 110.0 | 3.0 |
| Construction material | Wood | ha | 1.0 | 10.0 | 10.0 | 3.0 |
| Construction material | Earth | ha | 1.0 | 26.0 | 26.0 | 2.0 |
| Other | Pitcher pots | ha | 1.0 | 72.0 | 72.0 | |
| Total costs for establishment of the Technology | 1259.0 | |||||
| Total costs for establishment of the Technology in USD | 27.37 | |||||
Comments:
Duration of establishment phase: 36 month(s)
4.5 Maintenance/ recurrent activities
| Activity | Timing/ frequency | |
|---|---|---|
| 1. | Mulching | Summer / each cropping season |
| 2. | Across slope ploughing | Summer / each cropping season |
| 3. | In-situ maisture conservation | before sowing / |
| 4. | Watering | summer /once in 10 days |
| 5. | Weeding, mulching | 2-3 months after planting /twice in a year |
| 6. | Re-seeding of grass/ shrub | before first shower /up to 2 years |
| 7. | casualty replacement | before first shower /1, 2, and 3rd years |
| 8. | fencing | during sumer period /every summer season of 2nd, 3rd and 4th year |
| 9. | Repair of breaches in bund | July to september/as required |
| 10. | Desilting of traps | October-November/annual |
| 11. | Refresher interaction with farmer | / seasonally |
| 12. | Rgular meetings | / as and when required |
4.6 Costs and inputs needed for maintenance/ recurrent activities (per year)
| Specify input | Unit | Quantity | Costs per Unit | Total costs per input | % of costs borne by land users | |
|---|---|---|---|---|---|---|
| Labour | Labour | ha | 1.0 | 51.0 | 51.0 | 100.0 |
| Plant material | Seeds | ha | 1.0 | 11.1 | 11.1 | 100.0 |
| Plant material | Seedlings | ha | 1.0 | 16.9 | 16.9 | 100.0 |
| Fertilizers and biocides | Fertilizer | ha | 1.0 | 15.7 | 15.7 | |
| Fertilizers and biocides | Biocides | ha | 1.0 | 7.6 | 7.6 | |
| Construction material | Stone | ha | 1.0 | 11.0 | 11.0 | 100.0 |
| Construction material | Wood | ha | 1.0 | 1.0 | 1.0 | 100.0 |
| Construction material | Earth | ha | 1.0 | 2.6 | 2.6 | 100.0 |
| Other | Pitcher pots | ha | 1.0 | 7.2 | 7.2 | 100.0 |
| Total costs for maintenance of the Technology | 124.1 | |||||
| Total costs for maintenance of the Technology in USD | 2.7 | |||||
4.7 Most important factors affecting the costs
Describe the most determinate factors affecting the costs:
Non availability of stones, boulders
5. Natural and human environment
5.1 Climate
Annual rainfall
- < 250 mm
- 251-500 mm
- 501-750 mm
- 751-1,000 mm
- 1,001-1,500 mm
- 1,501-2,000 mm
- 2,001-3,000 mm
- 3,001-4,000 mm
- > 4,000 mm
Specifications/ comments on rainfall:
750-800 mm
5.2 Topography
Slopes on average:
- flat (0-2%)
- gentle (3-5%)
- moderate (6-10%)
- rolling (11-15%)
- hilly (16-30%)
- steep (31-60%)
- very steep (>60%)
Landforms:
- plateau/plains
- ridges
- mountain slopes
- hill slopes
- footslopes
- valley floors
Altitudinal zone:
- 0-100 m a.s.l.
- 101-500 m a.s.l.
- 501-1,000 m a.s.l.
- 1,001-1,500 m a.s.l.
- 1,501-2,000 m a.s.l.
- 2,001-2,500 m a.s.l.
- 2,501-3,000 m a.s.l.
- 3,001-4,000 m a.s.l.
- > 4,000 m a.s.l.
Comments and further specifications on topography:
Altitudinal zone: 101-500 m a.s.l. (422.8 m a.s.l.)
Landforms: Plateu/plains (3-4% slope, ranked 1), ridges (ranked 2)
Slopes on average: Gentle (3-4%)
5.3 Soils
Soil depth on average:
- very shallow (0-20 cm)
- shallow (21-50 cm)
- moderately deep (51-80 cm)
- deep (81-120 cm)
- very deep (> 120 cm)
Soil texture (topsoil):
- coarse/ light (sandy)
- medium (loamy, silty)
Topsoil organic matter:
- low (<1%)
If available, attach full soil description or specify the available information, e.g. soil type, soil PH/ acidity, Cation Exchange Capacity, nitrogen, salinity etc.
Soil depth on average: Moderately deep (60 cm, ranked 1) and deep (ranked 2)
Soil fertility: Medium (eroded soils)
Topsoil organic matter: Low (absence of vegetation)
Soil drainage/infiltration: Poor (high run-off from stony surface)
Soil water storage capacity: Very low
5.6 Characteristics of land users applying the Technology
Market orientation of production system:
- subsistence (self-supply)
- mixed (subsistence/ commercial)
Off-farm income:
- less than 10% of all income
Relative level of wealth:
- very poor
- poor
Indicate other relevant characteristics of the land users:
Population density: 50-100 persons/km2
Annual population growth: 0.5% - 1%
7% of the land users are average wealthy and own 26% of the land.
65% of the land users are poor and own 58% of the land.
28% of the land users are poor and own 16% of the land.
Off-farm income specification: Off season employment
5.7 Average area of land used by land users applying the Technology
- < 0.5 ha
- 0.5-1 ha
- 1-2 ha
- 2-5 ha
- 5-15 ha
- 15-50 ha
- 50-100 ha
- 100-500 ha
- 500-1,000 ha
- 1,000-10,000 ha
- > 10,000 ha
Comments:
Average area of land owned or leased by land users applying the Technology:
Cropland: 0.5-1 ha: Joint farmers, land shared by brothers (ranked 1), 1-2 ha (ranked 2), 2-5 ha (ranked 3)
Grazing land: 0.5-1 ha: Not much grazing land is available in the village.
5.8 Land ownership, land use rights, and water use rights
Land ownership:
- individual, titled
Land use rights:
- individual
6. Impacts and concluding statements
6.1 On-site impacts the Technology has shown
Socio-economic impacts
Production
crop production
Comments/ specify:
Drought from last 3 years
fodder production
fodder quality
wood production
production area
Comments/ specify:
SWC takes small piece of cultivable land
Income and costs
farm income
Socio-cultural impacts
community institutions
Comments/ specify:
Village watershed development committee, users groups etc.
national institutions
SLM/ land degradation knowledge
conflict mitigation
Comments/ specify:
Project support is expected by most of the farmers at a time.
Ecological impacts
Soil
soil moisture
soil cover
Comments/ specify:
Area was previously barren
soil loss
Comments/ specify:
Good vegetative cover
Biodiversity: vegetation, animals
biomass/ above ground C
Comments/ specify:
Ground cover established with vegetative hedges.
Climate and disaster risk reduction
wind velocity
Other ecological impacts
Soil fertility
Comments/ specify:
Introduction of legume species (glyricidia)
Biodiversity
Waterlogging
Comments/ specify:
Not a genereal problem. But only on this plot.
6.2 Off-site impacts the Technology has shown
reliable and stable stream flows in dry season
downstream flooding
Comments/ specify:
In-situ conservation
wind transported sediments
Comments/ specify:
Establishment of ground covers
6.4 Cost-benefit analysis
How do the benefits compare with the establishment costs (from land users’ perspective)?
Short-term returns:
neutral/ balanced
Long-term returns:
positive
How do the benefits compare with the maintenance/ recurrent costs (from land users' perspective)?
Short-term returns:
positive
Long-term returns:
positive
6.5 Adoption of the Technology
If available, quantify (no. of households and/ or area covered):
452
Of all those who have adopted the Technology, how many did so spontaneously, i.e. without receiving any material incentives/ payments?
- 0-10%
Comments:
60% of land user families have adopted the Technology with external material support
417 land user families have adopted the Technology with external material support
Comments on acceptance with external material support: survey results
5% of land user families have adopted the Technology without any external material support
35 land user families have adopted the Technology without any external material support
Comments on spontaneous adoption: survey results
There is a moderate trend towards spontaneous adoption of the Technology
Comments on adoption trend: Overall returns fro\m the piece of land is increased owing to horticulture and agriculture crops. Biomass increases. This is seen by other farmers and they are motivated to go for its adaption.
6.7 Strengths/ advantages/ opportunities of the Technology
| Strengths/ advantages/ opportunities in the land user’s view |
|---|
|
Economic sustainability How can they be sustained / enhanced? vegetative and green manure vermicompost etc. |
| Strengths/ advantages/ opportunities in the compiler’s or other key resource person’s view |
|---|
|
Effective SWC How can they be sustained / enhanced? maibntenance by the individual farmers |
|
water harvesting How can they be sustained / enhanced? Desilting structure |
|
Integrated approach How can they be sustained / enhanced? regular contact |
|
increased production How can they be sustained / enhanced? Integrated cultivation |
6.8 Weaknesses/ disadvantages/ risks of the Technology and ways of overcoming them
| Weaknesses/ disadvantages/ risks in the land user’s view | How can they be overcome? |
|---|---|
| Production (benefits) adversly affected due to drought. | Due to longer dry spel in the area (last three years) |
| Weaknesses/ disadvantages/ risks in the compiler’s or other key resource person’s view | How can they be overcome? |
|---|---|
| Non-availability of agricultural improved seed material at local level | by linkage of VWDCs with the Agricultural Research Station and Krishi Vignyan Kendra. |
| conflicts | demands by more number of farmers could not be met by the project at a time. |
7. References and links
7.1 Methods/ sources of information
Links and modules
Expand all Collapse allLinks
No links
Modules
No modules