Contour "V" Ditch [India]
- Creation:
- Update:
- Compiler: Biranchi Mohapatra
- Editor: –
- Reviewer: Fabian Ottiger
Samapatana V nala
technologies_1478 - India
View sections
Expand all Collapse all1. General information
1.2 Contact details of resource persons and institutions involved in the assessment and documentation of the Technology
SLM specialist:
1.3 Conditions regarding the use of data documented through WOCAT
When were the data compiled (in the field)?
15/10/2006
The compiler and key resource person(s) accept the conditions regarding the use of data documented through WOCAT:
Yes
2. Description of the SLM Technology
2.1 Short description of the Technology
Definition of the Technology:
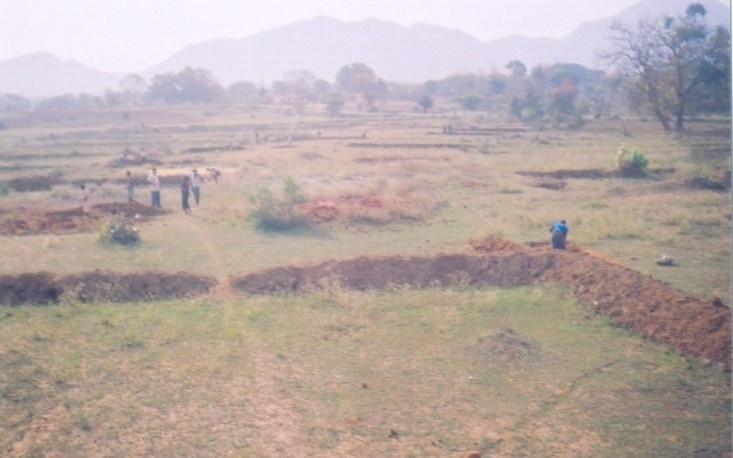
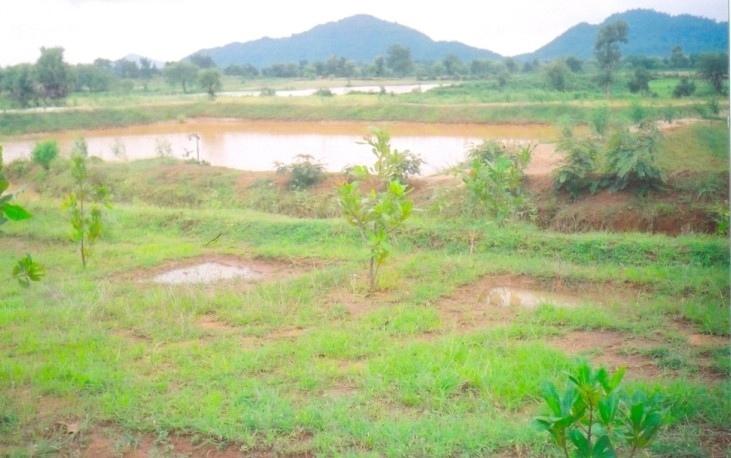
V-ahaped sturcture on contour line in order to check sheet/reel erosion and for moisture retension.
2.2 Detailed description of the Technology
Description:
V-shaped structures on contour line .The size of the V ditch varies according to slope, depth of soil and soil texture. The V-ditch can be laid eithr in staggered or continuous. Purpose- 1. To control sheet and reel erosion 2. Retention of in situ soil moisture 3. To increase vegetative cover. Establishment/maintenance -- 1. Bunding, 2. Terracing, 3. Turfing, 4. Provisioin of outlets in contour lines. Environment:- Bio-Physical-1-Cropland-Annual 2. Grazing land-Extensive, 3. Forest, Socio-Economic- 1. land ownership-User Group (32 Members) 2. Land use rights-Usufructary Rights.
2.3 Photos of the Technology
Media Gallery
2.5 Country/ region/ locations where the Technology has been applied and which are covered by this assessment
Country:
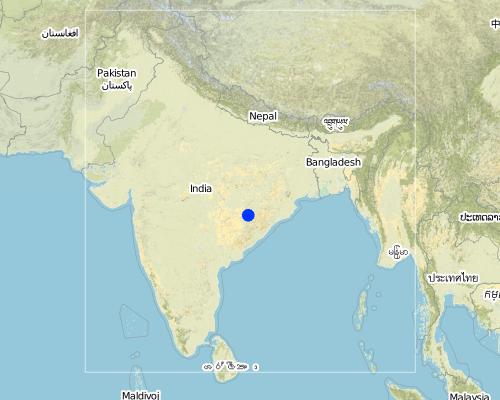
India
Region/ State/ Province:
Orissa
Further specification of location:
Orissa/Nuapada
Map
×2.6 Date of implementation
If precise year is not known, indicate approximate date:
- less than 10 years ago (recently)
2.7 Introduction of the Technology
Specify how the Technology was introduced:
- through projects/ external interventions
Comments (type of project, etc.):
Integarted Watershed Development Project (World bank aided) in Khandhamal and Ganjam districts of Orissa
3. Classification of the SLM Technology
3.1 Main purpose(s) of the Technology
- reduce, prevent, restore land degradation
3.2 Current land use type(s) where the Technology is applied

Cropland
- Annual cropping
- Perennial (non-woody) cropping
- Tree and shrub cropping
Main crops (cash and food crops):
Major food crop perennial cropping: Arhar
Major cash crop tree and shrub cropping: Cashew nut
Comments:
Major land use problems (compiler’s opinion): (i) Sheet & rill erosion (ii) Low Moisture status.
Major land use problems (land users’ perception): (i) Erosion (ii) Vegetation survival (iii) Low productivity of land
Type of cropping system and major crops comments: No
3.3 Further information about land use
Water supply for the land on which the Technology is applied:
- rainfed
Number of growing seasons per year:
- 2
Specify:
Longest growing period in days: 150Longest growing period from month to month: Jun - OctSecond longest growing period in days: 75Second longest growing period from month to month: Nov - Jan
3.4 SLM group to which the Technology belongs
- cross-slope measure
- water harvesting
3.5 Spread of the Technology
Comments:
Total area covered by the SLM Technology is 0.14 m2.
3.6 SLM measures comprising the Technology
3.7 Main types of land degradation addressed by the Technology

soil erosion by water
- Wt: loss of topsoil/ surface erosion
- Wo: offsite degradation effects
Comments:
Main type of degradation addressed: Wt: loss of topsoil / surface erosion
Secondary types of degradation addressed: Wo: offsite degradation effects
Main causes of degradation: deforestation / removal of natural vegetation (incl. forest fires), other human induced causes (specify) (agricultural causes), education, access to knowledge and support services (lack of knowledge)
Secondary causes of degradation: over-exploitation of vegetation for domestic use, overgrazing, droughts, land tenure (land subdivision), Land alienation
3.8 Prevention, reduction, or restoration of land degradation
Specify the goal of the Technology with regard to land degradation:
- reduce land degradation
4. Technical specifications, implementation activities, inputs, and costs
4.1 Technical drawing of the Technology
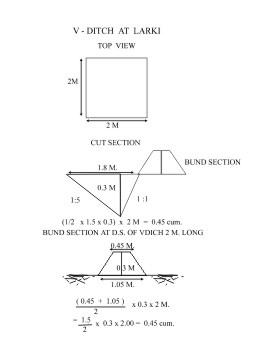
4.2 Technical specifications/ explanations of technical drawing
V-Ditch technical drawing
Location: QTInd16TechDraw.jpg
Technical knowledge required for field staff / advisors: moderate
Technical knowledge required for land users: low
Main technical functions: control of dispersed runoff: retain / trap
Secondary technical functions: control of dispersed runoff: impede / retard, increase of infiltration, increase / maintain water stored in soil, increase in soil fertility
Vegetative measure: Turfing of bund
Vegetative material: G : grass
Vertical interval between rows / strips / blocks (m): 2
Spacing between rows / strips / blocks (m): 1
Vertical interval within rows / strips / blocks (m): 2
Width within rows / strips / blocks (m): 1.5
Vegetative measure: Vegetative material: G : grass
Vegetative measure: Vegetative material: G : grass
Vegetative measure: Vegetative material: G : grass
Grass species: Vetiver/Berunbuta
Slope (which determines the spacing indicated above): 8.00%
If the original slope has changed as a result of the Technology, the slope today is (see figure below): 6.00%
Gradient along the rows / strips: 0.00%
Structural measure: Contour V ditch
Vertical interval between structures (m): 2
Spacing between structures (m): 1
Depth of ditches/pits/dams (m): average
Width of ditches/pits/dams (m): 2
Length of ditches/pits/dams (m): 1.5
Height of bunds/banks/others (m): 0.3
Width of bunds/banks/others (m): Bottom=0.8 Top=0.2
Length of bunds/banks/others (m): 1.5
Construction material (earth): Soil excavated from the ditches are used to construct banks/bunds
Slope (which determines the spacing indicated above): 8%
If the original slope has changed as a result of the Technology, the slope today is: 6%
Lateral gradient along the structure: 0%
Vegetation is used for stabilisation of structures.
4.3 General information regarding the calculation of inputs and costs
other/ national currency (specify):
Rupee
Indicate exchange rate from USD to local currency (if relevant): 1 USD =:
50.0
Indicate average wage cost of hired labour per day:
1.00
4.4 Establishment activities
| Activity | Type of measure | Timing | |
|---|---|---|---|
| 1. | Local grass barrier | Vegetative | On the onset of monsoon |
| 2. | Cashew plantation | Vegetative | During rainy season |
| 3. | Survey & layout | Structural | Before onset of monsoon. |
| 4. | Digging of pit & construction of earthen bund | Structural | Premonsoon. |
| 5. | Stone pitching on upstream slope of pit | Structural | Premonsoon. |
| 6. | grass turffing | Structural | monsoon |
4.5 Costs and inputs needed for establishment
| Specify input | Unit | Quantity | Costs per Unit | Total costs per input | % of costs borne by land users | |
|---|---|---|---|---|---|---|
| Labour | Labour | ha | 1.0 | 35.0 | 35.0 | |
| Construction material | Stone | ha | 1.0 | 5.0 | 5.0 | |
| Total costs for establishment of the Technology | 40.0 | |||||
Comments:
Duration of establishment phase: 12 month(s)
4.6 Maintenance/ recurrent activities
| Activity | Type of measure | Timing/ frequency | |
|---|---|---|---|
| 1. | Mini tillage | Agronomic | khariff / annual |
| 2. | Cover cropping | Agronomic | khariff / annual |
| 3. | Weeding | Vegetative | After rooting /Six months |
| 4. | Soil work | Vegetative | After rooting /Six months |
| 5. | Manuring | Vegetative | During rainy season /Twice in a year. |
| 6. | Fire Control measures | Vegetative | During winter season /annual |
| 7. | Turfing of bund with grass | Structural | during rain/annual |
| 8. | De-silting of pits | Structural | before onset of monsoon/annual |
| 9. | Maintaining upstream & down stream arrrangement | Structural | before onset of monsoon/annual |
| 10. | Re-arrangement of displaced stone | Structural | before onset of monsoon/annual |
4.7 Costs and inputs needed for maintenance/ recurrent activities (per year)
Comments:
Length and cross section of the strucutre, stone availability.
4.8 Most important factors affecting the costs
Describe the most determinate factors affecting the costs:
Labour availability, Availability of grass/stone , Transportation facility.
5. Natural and human environment
5.1 Climate
Annual rainfall
- < 250 mm
- 251-500 mm
- 501-750 mm
- 751-1,000 mm
- 1,001-1,500 mm
- 1,501-2,000 mm
- 2,001-3,000 mm
- 3,001-4,000 mm
- > 4,000 mm
Specify average annual rainfall (if known), in mm:
1250.00
Agro-climatic zone
- semi-arid
5.2 Topography
Slopes on average:
- flat (0-2%)
- gentle (3-5%)
- moderate (6-10%)
- rolling (11-15%)
- hilly (16-30%)
- steep (31-60%)
- very steep (>60%)
Landforms:
- plateau/plains
- ridges
- mountain slopes
- hill slopes
- footslopes
- valley floors
Altitudinal zone:
- 0-100 m a.s.l.
- 101-500 m a.s.l.
- 501-1,000 m a.s.l.
- 1,001-1,500 m a.s.l.
- 1,501-2,000 m a.s.l.
- 2,001-2,500 m a.s.l.
- 2,501-3,000 m a.s.l.
- 3,001-4,000 m a.s.l.
- > 4,000 m a.s.l.
Comments and further specifications on topography:
Landforms: Also mountain slopes and ridges
5.3 Soils
Soil depth on average:
- very shallow (0-20 cm)
- shallow (21-50 cm)
- moderately deep (51-80 cm)
- deep (81-120 cm)
- very deep (> 120 cm)
Soil texture (topsoil):
- coarse/ light (sandy)
- medium (loamy, silty)
Topsoil organic matter:
- medium (1-3%)
If available, attach full soil description or specify the available information, e.g. soil type, soil PH/ acidity, Cation Exchange Capacity, nitrogen, salinity etc.
Soil fertility: Medium
Soil drainage/infiltration: Medium
Soil water storage capacity: Medium (ranked 1) and high (ranked 2)
5.6 Characteristics of land users applying the Technology
Market orientation of production system:
- subsistence (self-supply)
Off-farm income:
- > 50% of all income
Relative level of wealth:
- very poor
- poor
Level of mechanization:
- manual work
Indicate other relevant characteristics of the land users:
Population density: 100-200 persons/km2
Annual population growth: 1% - 2%
10% of the land users are average wealthy and own 50% of the land.
20% of the land users are poor and own 30% of the land.
70% of the land users are poor and own 20% of the land.
Level of mechanization: Manual work (100% of the activities are performed manuall)
Market orientation: Subsistence (All crops are for self consumption presently)
5.7 Average area of land owned or leased by land users applying the Technology
- < 0.5 ha
- 0.5-1 ha
- 1-2 ha
- 2-5 ha
- 5-15 ha
- 15-50 ha
- 50-100 ha
- 100-500 ha
- 500-1,000 ha
- 1,000-10,000 ha
- > 10,000 ha
5.8 Land ownership, land use rights, and water use rights
Land ownership:
- state
- individual, titled
Land use rights:
- leased
- individual
6. Impacts and concluding statements
6.1 On-site impacts the Technology has shown
Socio-economic impacts
Production
crop production
fodder production
Comments/ specify:
Nil
fodder quality
Comments/ specify:
Nil
product diversity
Comments/ specify:
Cover crop, Agro forestry,Fruit crops and Tuber crops taken up
Income and costs
farm income
Comments/ specify:
Rs. 500/- per Ha. Rs. 10/- per day
workload
Comments/ specify:
Needs maintenance timely.
Socio-cultural impacts
community institutions
Comments/ specify:
Users groups formed and functioning.
SLM/ land degradation knowledge
Comments/ specify:
By the users
conflict mitigation
Comments/ specify:
Community mobilisation is requirede to solve conflicts.
Ecological impacts
Water cycle/ runoff
surface runoff
Quantity before SLM:
65
Quantity after SLM:
40
excess water drainage
Comments/ specify:
Crops grown and supplemental irrigation
Soil
soil moisture
Comments/ specify:
Waste weir disposal
soil loss
Comments/ specify:
Vegetation established
Biodiversity: vegetation, animals
plant diversity
Comments/ specify:
Due to fertility
6.2 Off-site impacts the Technology has shown
downstream flooding
downstream siltation
groundwater/ river pollution
wind transported sediments
6.4 Cost-benefit analysis
How do the benefits compare with the establishment costs (from land users’ perspective)?
Short-term returns:
neutral/ balanced
Long-term returns:
positive
How do the benefits compare with the maintenance/ recurrent costs (from land users' perspective)?
Short-term returns:
positive
Long-term returns:
very positive
6.5 Adoption of the Technology
If available, quantify (no. of households and/ or area covered):
34
Of all those who have adopted the Technology, how many have did so spontaneously, i.e. without receiving any material incentives/ payments?
- 0-10%
Comments:
15% of land user families have adopted the Technology with external material support
32 land user families have adopted the Technology with external material support
Comments on acceptance with external material support: survey results
5% of land user families have adopted the Technology without any external material support
2 land user families have adopted the Technology without any external material support
Comments on spontaneous adoption: survey results
6.7 Strengths/ advantages/ opportunities of the Technology
| Strengths/ advantages/ opportunities in the land user’s view |
|---|
|
Low cost Simple technology User friendly Affordable How can they be sustained / enhanced? Guidance on cropping practices |
| Strengths/ advantages/ opportunities in the compiler’s or other key resource person’s view |
|---|
|
Based on traditional practices Low Cost Farmers can maintain Coserve insitu soil moisture Conserve the most vluable top soil How can they be sustained / enhanced? Involve people in planning Involve farmers while executing Place suitable disposal system in right places Regular maintenance Establishment of vegetative measures Adoption of proper cropping practices by the farmers |
6.8 Weaknesses/ disadvantages/ risks of the Technology and ways of overcoming them
| Weaknesses/ disadvantages/ risks in the land user’s view | How can they be overcome? |
|---|---|
| Apprehend getting benefits which will suffice their livelihoods | Off farm activities tomake them financially sound. |
| Weaknesses/ disadvantages/ risks in the compiler’s or other key resource person’s view | How can they be overcome? |
|---|---|
| Conflicts in future among farmers | Exposure on group dynamics and management of common property |
| Mobilisation of DWF and developemnt of corpus fund | Community organisation to generate corpus fund |
Links and modules
Expand all Collapse allLinks
No links
Modules
No modules