Stone wall check dam [Ethiopia]
- Creation:
- Update:
- Compiler: Simon Bach
- Editor: –
- Reviewers: Fabian Ottiger, Alexandra Gavilano
Yedengay Keter (Amharic)
technologies_1526 - Ethiopia
View sections
Expand all Collapse all1. General information
1.2 Contact details of resource persons and institutions involved in the assessment and documentation of the Technology
Key resource person(s)
SLM specialist:
Bach Simon
Centre for Development and Environment (CDE), University of Bern
Switzerland
SLM specialist:
Ayele Habtamu
Haramaya University
Ethiopia
Name of the institution(s) which facilitated the documentation/ evaluation of the Technology (if relevant)
Haramaya University (HU) - Ethiopia1.3 Conditions regarding the use of data documented through WOCAT
The compiler and key resource person(s) accept the conditions regarding the use of data documented through WOCAT:
Yes
2. Description of the SLM Technology
2.1 Short description of the Technology
Definition of the Technology:
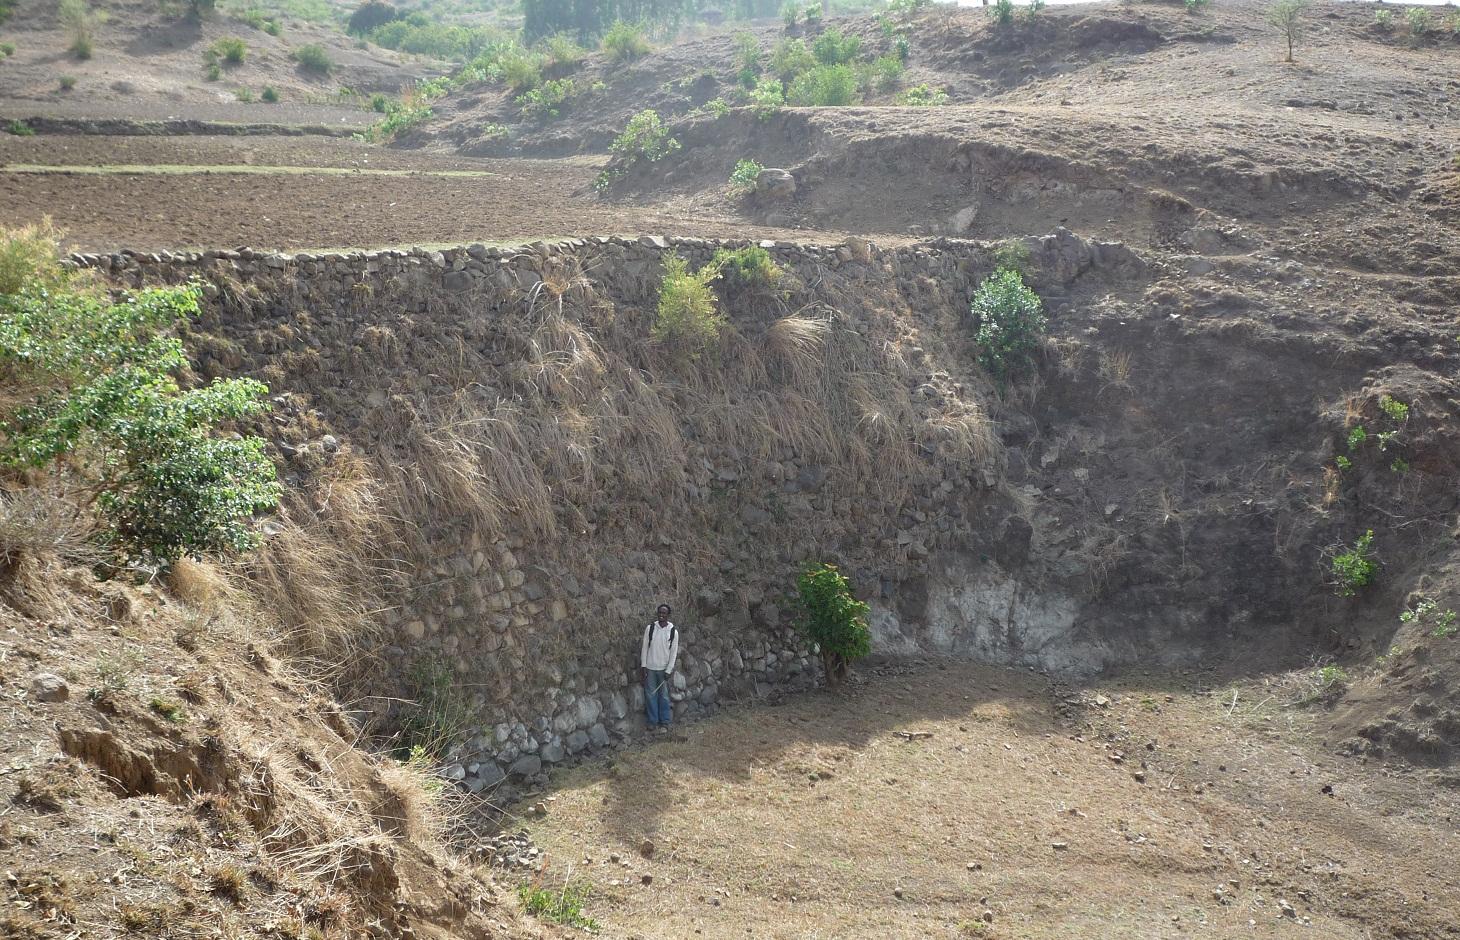
Stone wall check dams are built across a gully to collect alluvial soil and hinder further gully erosion.
2.2 Detailed description of the Technology
Description:
During the 1980s stone walls and terraces were introduced in Ethiopia in order to combat soil erosion. The technology of stone walls or terraces is used to stabilize hills or to refill gullies also in Bati, Ethiopia. Stone walls can form a very strong check dam to rehabilitate gullies even several meters deep.
Purpose of the Technology: Although stone walls can be used for different purposes, this case study is focusing on stone walls used to combat gully erosion. Farmers in the Bati region often use stone walls to rehabilitate gullies if the material is easily accessible, otherwise they may search for alternatives.
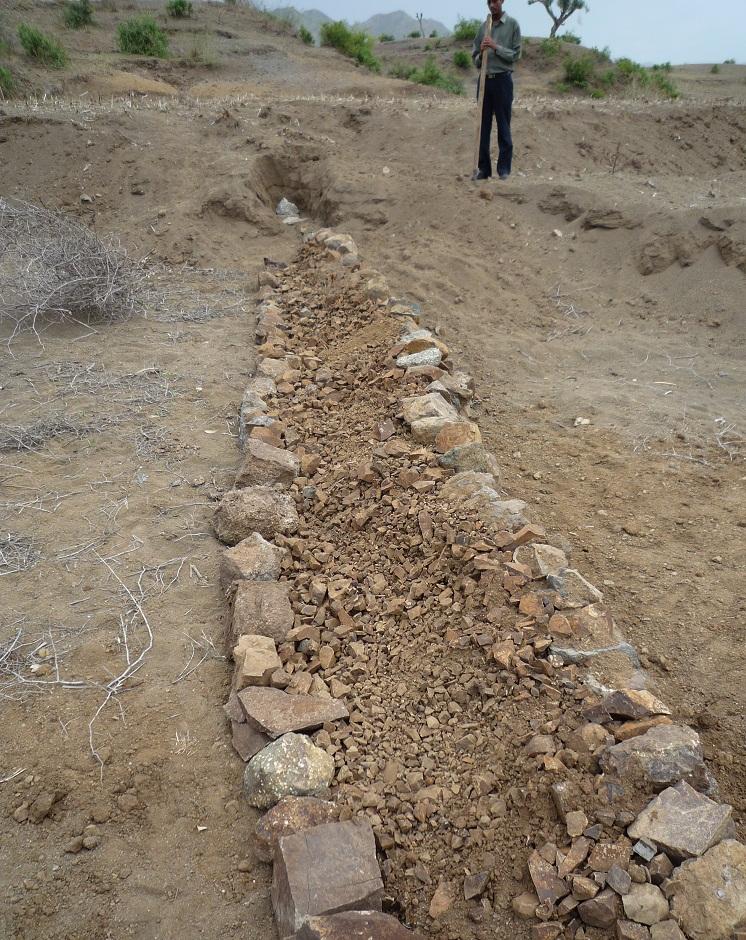
Establishment / maintenance activities and inputs: Following procedure is undertaken to build a stone wall check dam: After breaking the stones in the source-area they are transported to the target-area either by hand, by camels or by donkeys, depending on the distance. After digging a foundation for the wall of approximately 30 cm depth, the gap between two rows of big stones 1 m apart is filled up with smaller stones and gravel. These actions are repeated until the desired height and width of the wall are reached
Natural / human environment: The case study site, Bati, lays in an semiarid climatic zone on 1600 m a.s.l. Rainfalls are erratic and the rain sum per year is between 500-1000 mm. The landscape is very hilly with rather steep slopes. As almost in all Ethiopia, the area has a high population density and growth. The agricultural sector is very dominant and lead by a lot of small scale farming with a lot of livestock and small plots of cropland.
2.3 Photos of the Technology
Media Gallery
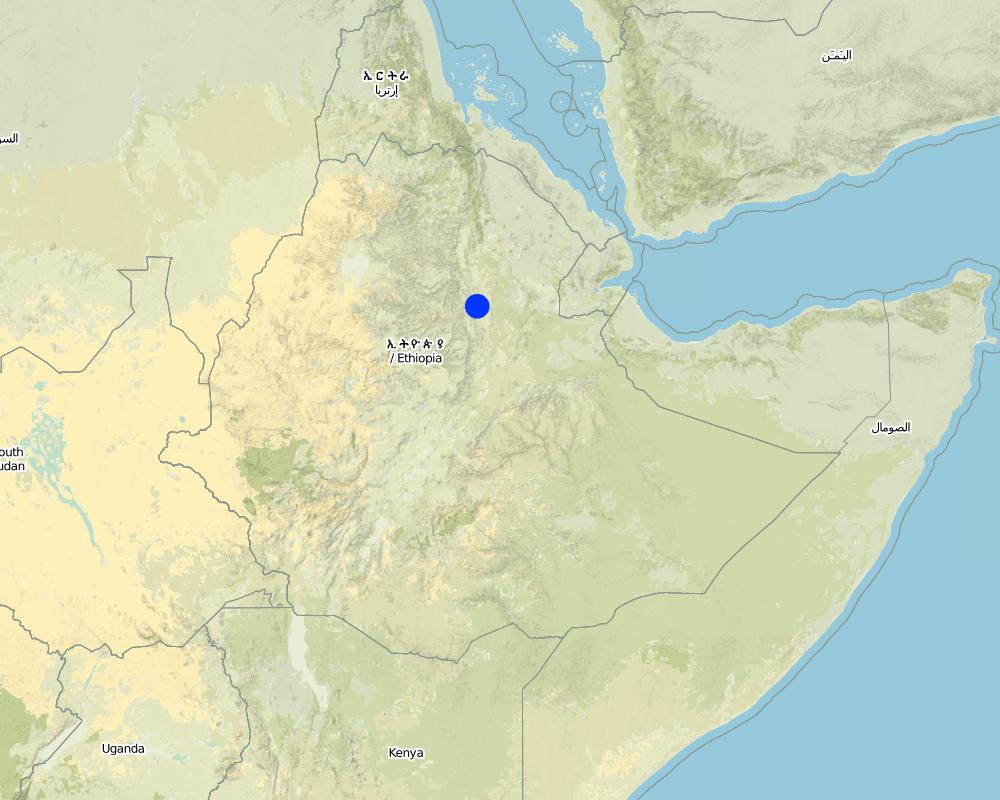
2.5 Country/ region/ locations where the Technology has been applied and which are covered by this assessment
Country:
Ethiopia
Region/ State/ Province:
Ethiopia / Amhara Region
Further specification of location:
Bati
Comments:
Total area covered by the SLM Technology is 0.6 km2.
Size of the case study watershed.
Map
×2.6 Date of implementation
If precise year is not known, indicate approximate date:
- 10-50 years ago
2.7 Introduction of the Technology
Specify how the Technology was introduced:
- through projects/ external interventions
Comments (type of project, etc.):
Soil and water conservation measures, including stone wall check dams, were mainly introduced to land users during the 1980s by the government. Sometimes the technology is not adequately performed though. In recent years the local Agricultural Office is teaching farmers how to correctly build soil and water conservation measures not only on a technology basis but to take care of an integrated watershed management.
3. Classification of the SLM Technology
3.1 Main purpose(s) of the Technology
- reduce, prevent, restore land degradation
3.2 Current land use type(s) where the Technology is applied

Cropland
- Annual cropping
Annual cropping - Specify crops:
- cereals - sorghum
- corn
Specify:
Longest growing period in days: 90 Longest growing period from month to month: June until September

Grazing land
- Mixed farming
Animal type:
- camels
- cattle - dairy
- goats
- poultry
- sheep
- (Goat/sheep are main meat source (in household or on market))
Comments:
Livestock density (if relevant):
> 100 LU /km2
Major land use problems (compiler’s opinion): Deforestation, overgrazing, cultivation of erosion-sensitive areas or steep slopes.
Major land use problems (land users’ perception): Too much soil loss and land degradation, no vegetation cover and poor soil moisture.
Grazingland comments: Livestock is not fenced in. Children herd the animals and watch out that they do not browse through crop fields. In off-farming season crop residues are collected from the field and stored next to the field. Animals are allowed to eat the still remaining residues on the field. After that, the animals are fed by the collected crop residues.
Livestock is grazing on crop residues
3.4 Water supply
Water supply for the land on which the Technology is applied:
- mixed rainfed-irrigated
Comments:
Water supply: Also rainfed
3.5 SLM group to which the Technology belongs
- cross-slope measure
3.6 SLM measures comprising the Technology
structural measures
- S1: Terraces
- S5: Dams, pans, ponds
- S6: Walls, barriers, palisades, fences
Comments:
Main measures: structural measures
3.7 Main types of land degradation addressed by the Technology

soil erosion by water
- Wt: loss of topsoil/ surface erosion
- Wg: gully erosion/ gullying
Comments:
Main type of degradation addressed: Wg: gully erosion / gullying
Secondary types of degradation addressed: Wt: loss of topsoil / surface erosion
Main causes of degradation: deforestation / removal of natural vegetation (incl. forest fires) (Deforestation for the past 30 years.), over-exploitation of vegetation for domestic use (Wood collection for cooking and construction.), overgrazing (50% of the watershed area are cultivated - big grazing pressure on remaining land), other human induced causes (specify) (Cultivation of very steep slopes.), change of seasonal rainfall (Erratic rainfall.), Heavy / extreme rainfall (intensity/amounts) (If there is rain, it is intensive.), population pressure (High population pressure.), poverty / wealth (Poor facilities.)
Secondary causes of degradation: soil management (Poor soil management practices and lack of awareness.), crop management (annual, perennial, tree/shrub) (Annual cropping.), droughts (The research area is considered rather dry.), land tenure (If the land is rented, it is poorly managed.), inputs and infrastructure: (roads, markets, distribution of water points, other, …) (Poor access to fertilizer. Bad infrastructures.), education, access to knowledge and support services (Lack of awareness for soil degradation.), Low productivity of the land (As a consequence seeking for new/larger areas to increase production.)
3.8 Prevention, reduction, or restoration of land degradation
Specify the goal of the Technology with regard to land degradation:
- reduce land degradation
- restore/ rehabilitate severely degraded land
Comments:
Secondary goals: mitigation / reduction of land degradation
4. Technical specifications, implementation activities, inputs, and costs
4.1 Technical drawing of the Technology
Technical specifications (related to technical drawing):
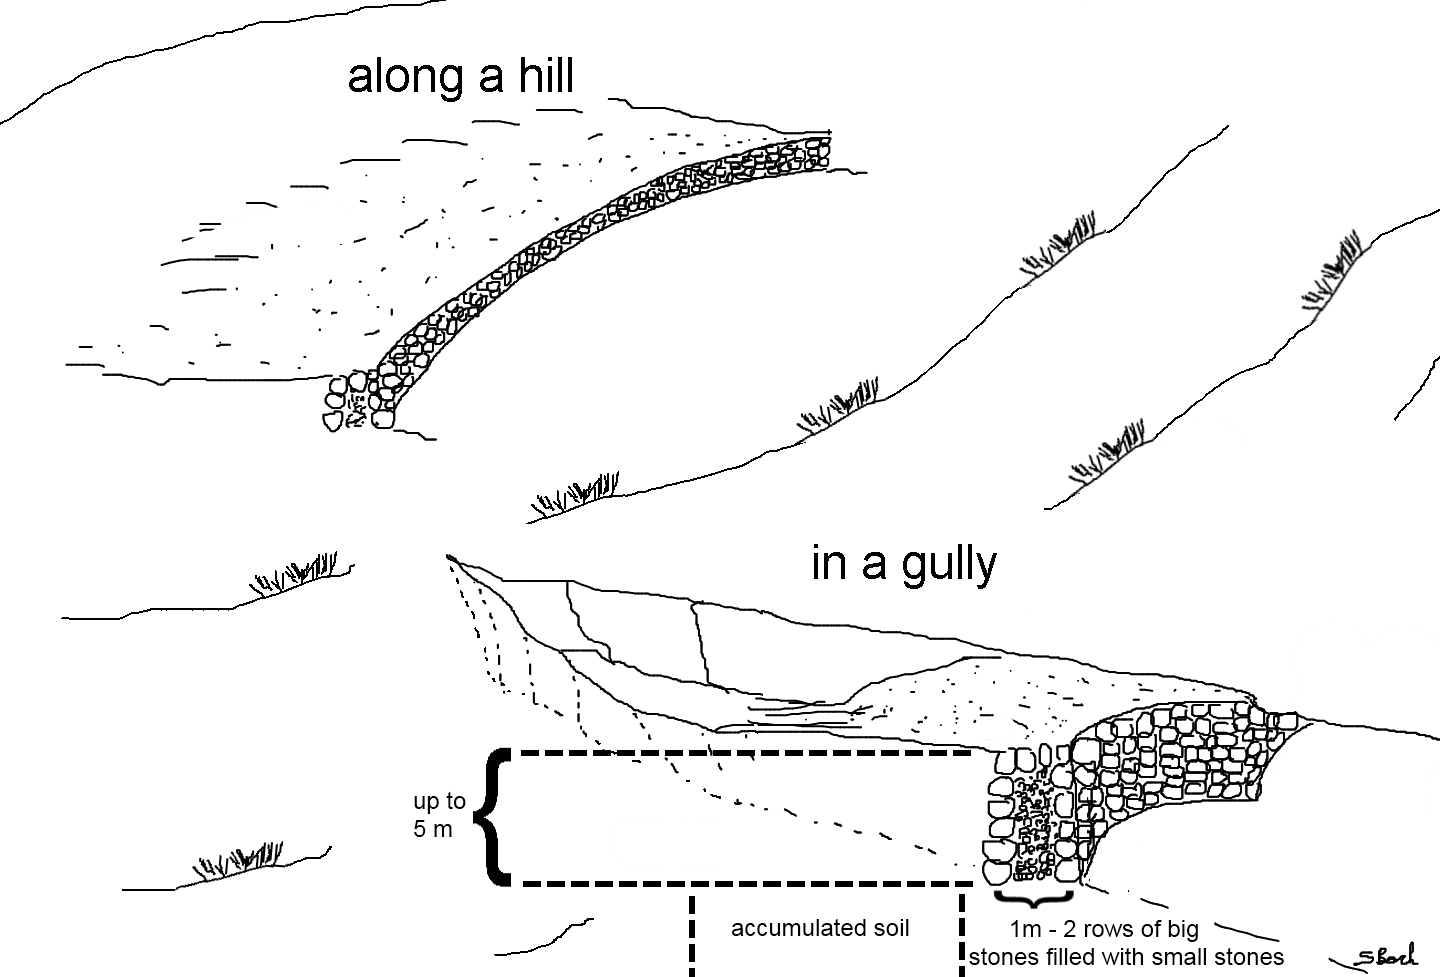
Stone wall check dams as they can be found in the region of Bati. The approximately 1 m wide gap between two rows of larger stones is filled up with small stones or gravel. This is done for every new level of the wall until the wall reaches its final height. The first row of stones is placed in the top 30 cm of the ground and on each side the dam is entering the hill to some extent. After a wall has silted up, the height is increased by other rows of stones until desired dimension is reached. Walls up to 5 m can be found in the case study site.
Location: South-West of Bati. Bati Woreda, Amhara Region, Ethiopia
Date: 26.04.2011
Technical knowledge required for field staff / advisors: moderate (To teach the farmers how to perform an integrated watershed management.)
Technical knowledge required for land users: high (To build a robust check dam there is a lot of knowledge needed.)
Main technical functions: control of concentrated runoff: retain / trap, control of concentrated runoff: impede / retard, reduction of slope angle, reduction of slope length, increase / maintain water stored in soil, sediment retention / trapping, sediment harvesting
Secondary technical functions: water harvesting / increase water supply, improvement of water quality, buffering / filtering water
Retention/infiltration ditch/pit, sediment/sand trap
Depth of ditches/pits/dams (m): 6
Width of ditches/pits/dams (m): 10
Length of ditches/pits/dams (m): 1
If the original slope has changed as a result of the Technology, the slope today is: 0%
Author:
Simon Bach, CDE, Bern, Switzerland
4.2 General information regarding the calculation of inputs and costs
other/ national currency (specify):
Ethiopian Birr
If relevant, indicate exchange rate from USD to local currency (e.g. 1 USD = 79.9 Brazilian Real): 1 USD =:
16.82
Indicate average wage cost of hired labour per day:
1.00
4.3 Establishment activities
| Activity | Timing (season) | |
|---|---|---|
| 1. | Preparation of the stones (500 person days needed). | During dry season. |
| 2. | Transportation of the stones (depending on the distance). | During dry season. |
| 3. | Digging a foundation of 30 cm depth (165 person days needed). | During dry season. |
| 4. | Building of the stone wall (500 person days needed). | During dry season. |
4.4 Costs and inputs needed for establishment
| Specify input | Unit | Quantity | Costs per Unit | Total costs per input | % of costs borne by land users | |
|---|---|---|---|---|---|---|
| Labour | Labour | ha | 1.0 | 1165.0 | 1165.0 | 50.0 |
| Equipment | Tools | ha | 1.0 | 5.0 | 5.0 | 100.0 |
| Total costs for establishment of the Technology | 1170.0 | |||||
| Total costs for establishment of the Technology in USD | 69.56 | |||||
4.5 Maintenance/ recurrent activities
| Activity | Timing/ frequency | |
|---|---|---|
| 1. | Prepare the stones (250 person days needed). | During dry season if needed. |
| 2. | If dam is silted up, increasing the height by 0.5 m (250 person days needed) | Every year in dry season. |
4.6 Costs and inputs needed for maintenance/ recurrent activities (per year)
| Specify input | Unit | Quantity | Costs per Unit | Total costs per input | % of costs borne by land users | |
|---|---|---|---|---|---|---|
| Labour | Labour | ha | 1.0 | 500.0 | 500.0 | 50.0 |
| Equipment | Tools | ha | 1.0 | 5.0 | 5.0 | 100.0 |
| Total costs for maintenance of the Technology | 505.0 | |||||
| Total costs for maintenance of the Technology in USD | 30.02 | |||||
Comments:
Machinery/ tools: Shovel, digging hoe, iron rod.
Total costs of a hectare were calculated for a wall of 100 m length and 1 m of height every 20 m (500 m total wall) in the year 2011. Tool prices were estimated and labor costs were calculated with a daily wage of 1$.
4.7 Most important factors affecting the costs
Describe the most determinate factors affecting the costs:
Rough topology in the area, questionable availability of construction materials if they are not found nearby.
5. Natural and human environment
5.1 Climate
Annual rainfall
- < 250 mm
- 251-500 mm
- 501-750 mm
- 751-1,000 mm
- 1,001-1,500 mm
- 1,501-2,000 mm
- 2,001-3,000 mm
- 3,001-4,000 mm
- > 4,000 mm
Specifications/ comments on rainfall:
Erratic rainfall (rainseason from June until September)
Agro-climatic zone
- semi-arid
Thermal climate class: tropics (LGP shorter than 90 days.)
5.2 Topography
Slopes on average:
- flat (0-2%)
- gentle (3-5%)
- moderate (6-10%)
- rolling (11-15%)
- hilly (16-30%)
- steep (31-60%)
- very steep (>60%)
Landforms:
- plateau/plains
- ridges
- mountain slopes
- hill slopes
- footslopes
- valley floors
Altitudinal zone:
- 0-100 m a.s.l.
- 101-500 m a.s.l.
- 501-1,000 m a.s.l.
- 1,001-1,500 m a.s.l.
- 1,501-2,000 m a.s.l.
- 2,001-2,500 m a.s.l.
- 2,501-3,000 m a.s.l.
- 3,001-4,000 m a.s.l.
- > 4,000 m a.s.l.
Comments and further specifications on topography:
Altitudinal zone: 1501-2000 m a.s.l. (The study site is located at 1600m a.s.l.)
Landforms: Hill slopes (ranked 1) and valley floors (ranked 2)
Slopes on average: Hilly (ranked 1), rolling (ranked 2) and steep (ranked 3)
5.3 Soils
Soil depth on average:
- very shallow (0-20 cm)
- shallow (21-50 cm)
- moderately deep (51-80 cm)
- deep (81-120 cm)
- very deep (> 120 cm)
Soil texture (topsoil):
- coarse/ light (sandy)
- medium (loamy, silty)
Topsoil organic matter:
- low (<1%)
If available, attach full soil description or specify the available information, e.g. soil type, soil PH/ acidity, Cation Exchange Capacity, nitrogen, salinity etc.
Soil depth on average: Very shallow (ranked 1) and shallow (ranked 2)
Soil textur: Coarse/light (ranked 1) and medium (ranked 2)
Soil fertility is low
Soil drainage/infiltration is poor
Soil water storage capacity is medium
5.4 Water availability and quality
Ground water table:
5-50 m
Availability of surface water:
poor/ none
Water quality (untreated):
poor drinking water (treatment required)
Comments and further specifications on water quality and quantity:
Ground water table: Unknown
Availability of surface water is poor/none (Only during rainy season)
Water quality (untreated): Poor drinking water (treatment required, mostly groundwater)
5.5 Biodiversity
Species diversity:
- low
Comments and further specifications on biodiversity:
Relative to other parts of Ethiopia.
5.6 Characteristics of land users applying the Technology
Market orientation of production system:
- subsistence (self-supply)
Off-farm income:
- less than 10% of all income
Relative level of wealth:
- rich
Individuals or groups:
- individual/ household
Level of mechanization:
- manual work
- animal traction
Gender:
- men
Indicate other relevant characteristics of the land users:
Land users applying the Technology are mainly common / average land users
Population density: 100-200 persons/km2
Annual population growth: 6%
1% of the land users are rich (Adopt the most of SWC technologies).
19% of the land users are average wealthy.
89% of the land users are poor.
Off-farm income specification: Off-farm income has low importance.
Level of mechanization: Animal traction (Plowing by oxen, ranked 1) and manual labour (ranked 2)
Market orientation cropland: Subsistence
Market orientation grazing land: Goat/sheep are main meat source (in household or on market).
5.7 Average area of land used by land users applying the Technology
- < 0.5 ha
- 0.5-1 ha
- 1-2 ha
- 2-5 ha
- 5-15 ha
- 15-50 ha
- 50-100 ha
- 100-500 ha
- 500-1,000 ha
- 1,000-10,000 ha
- > 10,000 ha
Is this considered small-, medium- or large-scale (referring to local context)?
- small-scale
5.8 Land ownership, land use rights, and water use rights
Land ownership:
- individual, titled
Water use rights:
- open access (unorganized)
5.9 Access to services and infrastructure
health:
- poor
- moderate
- good
education:
- poor
- moderate
- good
technical assistance:
- poor
- moderate
- good
employment (e.g. off-farm):
- poor
- moderate
- good
markets:
- poor
- moderate
- good
energy:
- poor
- moderate
- good
roads and transport:
- poor
- moderate
- good
drinking water and sanitation:
- poor
- moderate
- good
financial services:
- poor
- moderate
- good
6. Impacts and concluding statements
6.1 On-site impacts the Technology has shown
Socio-economic impacts
Production
crop production
animal production
risk of production failure
Comments/ specify:
Conservation of soil water
production area
Comments/ specify:
Gullies are transformed to fields. Structure needs space but also gains space
land management
Comments/ specify:
Structure as a new obstacle
Water availability and quality
drinking water availability
Income and costs
expenses on agricultural inputs
Comments/ specify:
alluvial soil is relatively fertile
farm income
Comments/ specify:
new fields lead to higher productivity
diversity of income sources
economic disparities
Comments/ specify:
additional income due to new fields
workload
Comments/ specify:
Gully is now flat land and traversable but needs establishment and maintenance work
Socio-cultural impacts
food security/ self-sufficiency
Comments/ specify:
Additional space for new fields
community institutions
national institutions
SLM/ land degradation knowledge
Comments/ specify:
best practices may spread further on
conflict mitigation
Comments/ specify:
upstream and downstream dialog
Improved livelihoods and human well-being
Comments/ specify:
Accumulation of soil leads to new space for fields and additional food security or even income (if crop surplus is sold).
Ecological impacts
Water cycle/ runoff
water quantity
Comments/ specify:
increased soil moisture
harvesting/ collection of water
Comments/ specify:
dam blocks water flow
surface runoff
Comments/ specify:
increased infiltration, reduced flow velocity
groundwater table/ aquifer
Comments/ specify:
increased infiltration
Soil
soil moisture
Comments/ specify:
Dam blocks water flow but can lead to the fact that additional groundwater may be logged
soil loss
Comments/ specify:
alluvial accumulation behind the structure
nutrient cycling/ recharge
Biodiversity: vegetation, animals
biomass/ above ground C
plant diversity
animal diversity
beneficial species
habitat diversity
pest/ disease control
Comments/ specify:
new habitat for rodents etc.
Climate and disaster risk reduction
flood impacts
Comments/ specify:
flood controll by stone check dams
emission of carbon and greenhouse gases
6.2 Off-site impacts the Technology has shown
water availability
Comments/ specify:
possibility of spring development
reliable and stable stream flows in dry season
Comments/ specify:
if a spring can develop
downstream flooding
Comments/ specify:
increased infiltration/reduced flooding but also less downstream river flow
downstream siltation
Comments/ specify:
trapping of the sediments by the structure
groundwater/ river pollution
Comments/ specify:
trapping of the sediments by the structure. No off site sediment yields available anymore.
buffering/ filtering capacity
Comments/ specify:
increased infiltration
wind transported sediments
damage on neighbours' fields
Comments/ specify:
due to gully rehabilitation
damage on public/ private infrastructure
Comments/ specify:
due to gully rehabilitation
6.3 Exposure and sensitivity of the Technology to gradual climate change and climate-related extremes/ disasters (as perceived by land users)
Gradual climate change
Gradual climate change
| Season | increase or decrease | How does the Technology cope with it? | |
|---|---|---|---|
| annual temperature | increase | well |
Climate-related extremes (disasters)
Meteorological disasters
| How does the Technology cope with it? | |
|---|---|
| local rainstorm | well |
| local windstorm | well |
Climatological disasters
| How does the Technology cope with it? | |
|---|---|
| drought | well |
Hydrological disasters
| How does the Technology cope with it? | |
|---|---|
| general (river) flood | well |
Other climate-related consequences
Other climate-related consequences
| How does the Technology cope with it? | |
|---|---|
| reduced growing period | well |
6.4 Cost-benefit analysis
How do the benefits compare with the establishment costs (from land users’ perspective)?
Short-term returns:
very negative
Long-term returns:
positive
How do the benefits compare with the maintenance/ recurrent costs (from land users' perspective)?
Short-term returns:
slightly negative
Long-term returns:
positive
Comments:
Big labour input for establishment. Also maintenance needs some work every year. But also high benefit by additional farming land gained due to the check dams.
6.5 Adoption of the Technology
Comments:
100% of land user families have adopted the Technology with external material support
Comments on acceptance with external material support: In the past 6 years the local Agricultural Office has supported farmers to treat their watersheds with SWC technologies based on a food for work programme. Today farmers build the structures on their own but seek support.
There is a moderate trend towards spontaneous adoption of the Technology
Comments on adoption trend: Most of the farmers build SWC technologies (includin stone check dams in gullies) because of the food for work programme
6.7 Strengths/ advantages/ opportunities of the Technology
| Strengths/ advantages/ opportunities in the land user’s view |
|---|
|
The stone check dams are conserving soil and moisture. How can they be sustained / enhanced? Maintain the dams. |
|
Due to alluvial soil there is additional farming land and therefore increased productivity. How can they be sustained / enhanced? Take care of the walls as well of the surrounding area and the whole watershed. |
| Strengths/ advantages/ opportunities in the compiler’s or other key resource person’s view |
|---|
|
Stone check dams are a quite durable structure. How can they be sustained / enhanced? Stability could be enhanced by additional technologies e.g. similar as gabbions or planting of trees/shrubs in front of the wall to reduce collapsing possibility. |
|
The structure collects alluvial soil which can be plowed and used as new farming fields. How can they be sustained / enhanced? Structure maintenance is important. If the dam fails, the field is washed out as well. |
|
The technology is widely used around the world (perhaps with local adaptations) and is therefore well documented. How can they be sustained / enhanced? Keep on with documentation and monitoring of limitations and potentials of stone check dams around the world. |
6.8 Weaknesses/ disadvantages/ risks of the Technology and ways of overcoming them
| Weaknesses/ disadvantages/ risks in the land user’s view | How can they be overcome? |
|---|---|
| The Land users could not tell any disadvantages of the technology. | Could be an indicator that there is enough spare time to build and maintain structures during off-farming season. |
| Weaknesses/ disadvantages/ risks in the compiler’s or other key resource person’s view | How can they be overcome? |
|---|---|
| Large labour input at establishment and during maintenance period. | Possibly by machinery but it is very expensive. |
| During time of establishment/maintenance there is no time for farming activites. These activities can therefore be seen as hidden costs. | Perhaps a "professional" team that takes care of check dams and is payed for it. |
7. References and links
7.1 Methods/ sources of information
7.2 References to available publications
Title, author, year, ISBN:
Bach S. (2012) Potentials and limitations of Jatropha curcas as a multipurpose crop for sustainable energy supply and soil and water conservation - a case study in Bati, Ethiopia, using the WOCAT approach. Unpublished master’s thesis, Centre for Development and Environment, University of Bern.
Links and modules
Expand all Collapse allLinks
No links
Modules
No modules