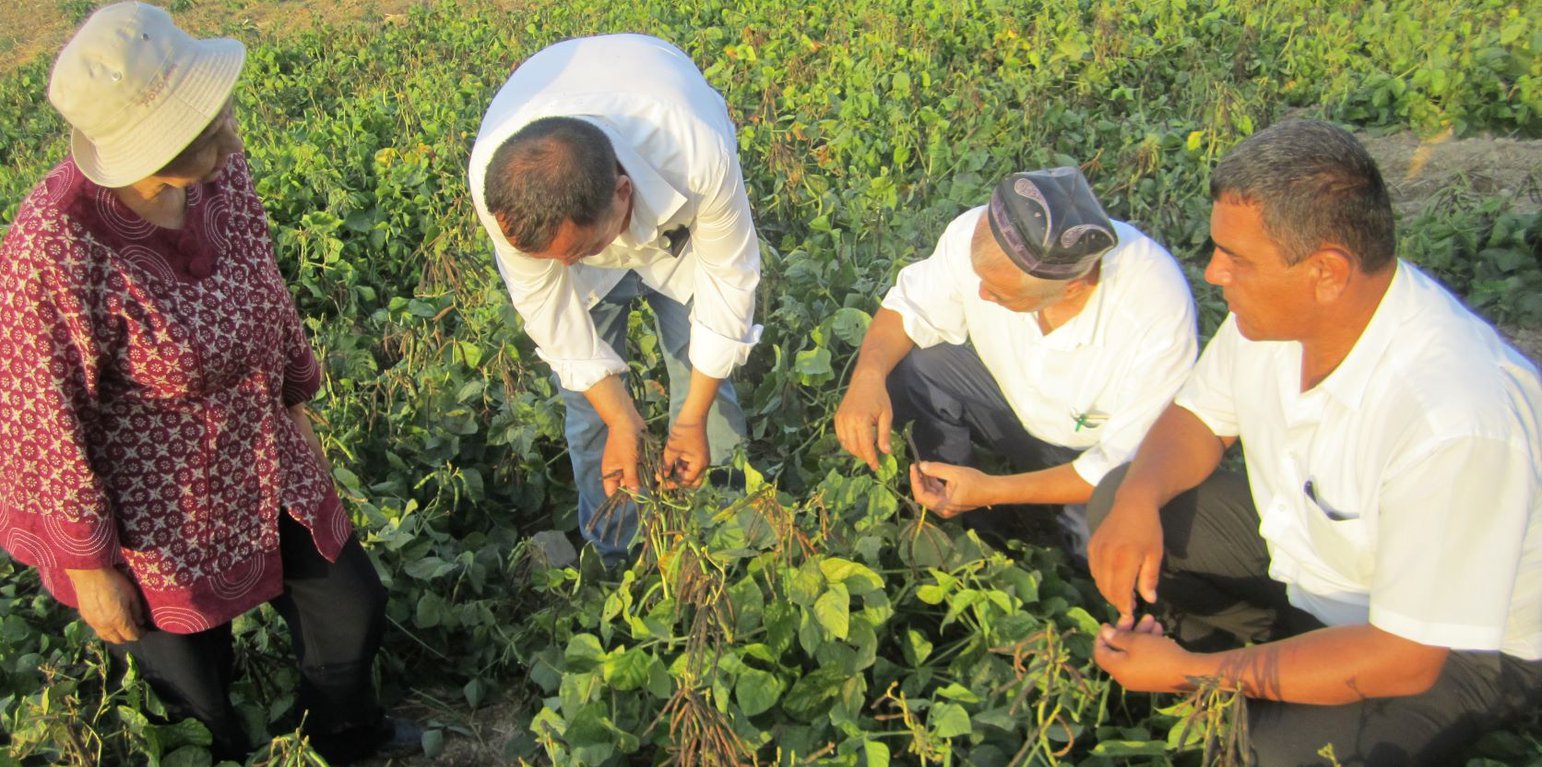
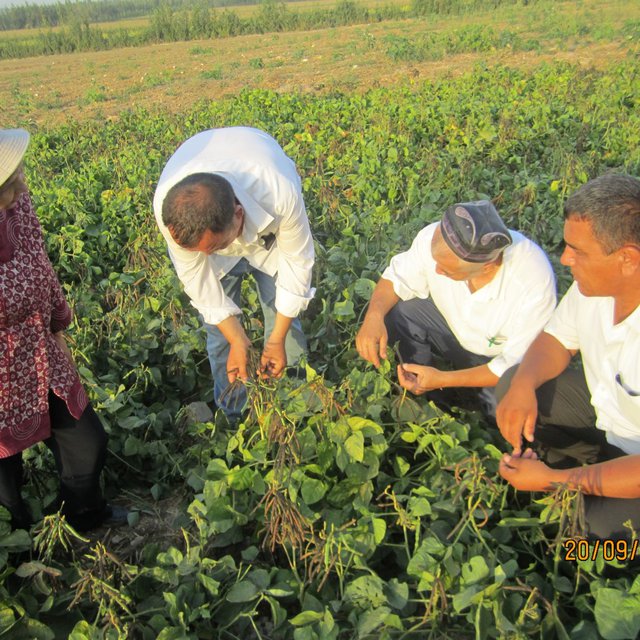
Farmers inspecting the development of the mung bean crop (Ram Sharma)

Winter Wheat - Mung Bean Production System (Uzbekistan)

Description

The cultivation of short duration mung bean varieties lead to higher farm-income and improved soil health in Central Asia

Central Asia is known for its harsh climate, extreme temperature differences and low precipitation. Uzbekistan is no exception to this. Its temperatures vary between -20 and 40 degrees Celsius and precipitation is limited to less than 400 millimetres. This results in difficult conditions for farmers to ensure agricultural production and food security.
Winter wheat is commonly grown to achieve food security and farm income as it is suited to the environment. However, the continuous cultivation of winter wheat has led to severe soil degradation and depletion, through extraction of soil organic matter and soil nutrients. Inevitably, this makes the soil unsuitable for crop cultivation.

The International Centre of Agricultural Research in Dry Areas (ICARDA) anticipated this challenge, and introduced improved mung bean varieties in 2014. Mung bean (or "green gram": Vigna radiata) is a leguminous crop, which replenishes soil organic matter and fertility through nitrogen fixation. By including mung bean in the winter wheat production system, soil health is improved, fallow period reduced, and farmer incomes are increased. The increased farm income is due to the reduced amount of fertilizer required, increased yields and higher selling prices.
Mung bean realizes a profit of roughly 2000 USD per hectare in a period of 100 days, while winter wheat profits are approximately 600 USD per hectare in an eight month period. These numbers show the significant benefit of incorporating mung bean. Scientist have demonstrated that cultivating only mung bean would lead to even higher profit margins, but concluded that adoption is unrealistic as wheat is pre-dominantly grown for food security.
The incorporation of mung bean in the agricultural production system has one downside and that is increased irrigation demand, because mung bean requires additional water.

The mung bean-winter wheat-system follows the following crop rotation. The field for mung bean is tilled and harrowed, prior to seeding. Mung bean is mechanically seeded and manually harvested in June-July and September-October respectively. In this growing period, the field is weeded either manually or by a cultivator, irrigated, fertilizer mechanically applied or hand broadcast and mechanically weeded.
Winter wheat is mechanically planted in October, after the field is harrowed. In March-April, the wheat crops are treated with chemicals and fertilizers. In June-July, the winter wheat is mechanically harvested. Winter wheat also receives irrigation through a canal.

To conclude, this documentation shows that smart ICARDA crop choice with improved varieties extremely benefits local farmers incomes and adds resilience. It also reduces land degradation within a commonly used production system.

Data presented in this work is partly made available through CGIAR Research Program on Dryland Systems; Collaborative Research Project on Sustainable Soil Management to Enhance Agricultural Productivity in Central Asia funded by IFPRI within the framework of Russian Federation funding to CGIAR (2018-2019); CGIAR Collaborative Research & Capacity Building Program for the Development of Sustainable and Resilient Agricultural Production in Central Asia within the framework of Russian Federation Funding (2013-2016).

Location

Location: Uzbekistan

No. of Technology sites analysed: 100-1000 sites

Geo-reference of selected sites
  • 70.75378, 40.57464

Spread of the Technology: evenly spread over an area (approx. 10-100 km2)

In a permanently protected area?: Nee

Date of implementation: less than 10 years ago (recently)

Type of introduction
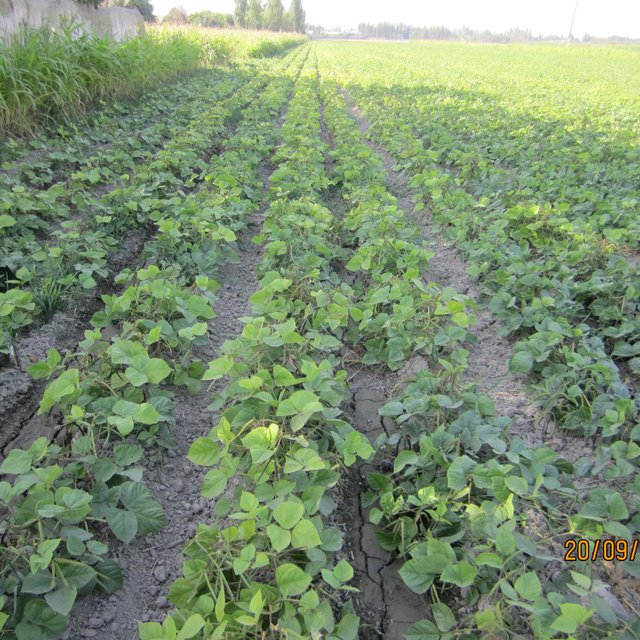
Mung bean growing (Ram Sharma)
Field inspection of the mung bean farm field (Ram Sharma)

Classification of the Technology

Main purpose
  • improve production
  • reduce, prevent, restore land degradation
  • conserve ecosystem
  • protect a watershed/ downstream areas – in combination with other Technologies
  • preserve/ improve biodiversity
  • reduce risk of disasters
  • adapt to climate change/ extremes and its impacts
  • mitigate climate change and its impacts
  • create beneficial economic impact
  • create beneficial social impact
Land use
Land use mixed within the same land unit: Nee

  • Cropland
    • Annual cropping: cereals - wheat (winter), legumes and pulses - beans
    Number of growing seasons per year: 2
    Is intercropping practiced? Nee
    Is crop rotation practiced? Ja
Water supply
  • rainfed
  • mixed rainfed-irrigated
  • full irrigation

Purpose related to land degradation
  • prevent land degradation
  • reduce land degradation
  • restore/ rehabilitate severely degraded land
  • adapt to land degradation
  • not applicable
Degradation addressed
  • soil erosion by water - Wt: loss of topsoil/ surface erosion, Wg: gully erosion/ gullying
  • soil erosion by wind - Et: loss of topsoil
  • chemical soil deterioration - Cn: fertility decline and reduced organic matter content (not caused by erosion)
SLM group
  • improved ground/ vegetation cover
  • improved plant varieties/ animal breeds
SLM measures
  • agronomic measures - A1: Vegetation/ soil cover, A2: Organic matter/ soil fertility
  • management measures - M2: Change of management/ intensity level

Technical drawing

Technical specifications
The following dimensions relate to mung bean cultivation:
A = Plant spacing within row = 8 to 10 centimetres
B = Spacing between rows = 45 to 60 centimetres
The plant density is 200,000 to 250,000 plants per hectare.
Author: Joren Verbist
The following dimensions relate to Winter Wheat cultivation:
A = Plant spacing within row = 2 to 4 centimetres
B = Spacing between rows = 15 centimetres
The plant density is 4.5 million to 5 million plants per hectare.
Author: Joren Verbist

Establishment and maintenance: activities, inputs and costs

Calculation of inputs and costs
  • Costs are calculated: per Technology area (size and area unit: 1 Hectare)
  • Currency used for cost calculation: USD
  • Exchange rate (to USD): 1 USD = n.a
  • Average wage cost of hired labour per day: n.a
Most important factors affecting the costs
n.a.
Establishment activities
  1. Mung bean: Seed procurement (Timing/ frequency: May-June)
  2. Mung bean: Land preparation (Timing/ frequency: June-July)
  3. Mung bean: Planting (Timing/ frequency: June-July)
  4. Mung bean: Fertilization (Timing/ frequency: June-July)
  5. Mung bean: Weed control (Timing/ frequency: August)
  6. Mung bean: Harvesting and threshing (Timing/ frequency: September-October)
  7. Mung bean: Storage for consumption and marketing (Timing/ frequency: October onward)
  8. Wheat: Seed Procurement (Timing/ frequency: August-September)
  9. Wheat: Land Preparation (Timing/ frequency: September)
  10. Wheat: Seeding (Timing/ frequency: October)
  11. Wheat: Fertilizer Application (Timing/ frequency: March-April)
  12. Wheat: Weed control (Timing/ frequency: March-April)
  13. Wheat: Harvesting and threshing (Timing/ frequency: June-July)
  14. Wheat: Storage for consumption and market (Timing/ frequency: July onward)
Establishment inputs and costs (per 1 Hectare)
Specify input Unit Quantity Costs per Unit (USD) Total costs per input (USD) % of costs borne by land users
Labour
WW: Irrigating Person-days 6.0 10.0 60.0 100.0
MB: Weeding Person-days 3.8 10.0 38.0 100.0
MB: Harvesting Person-days 3.8 10.0 38.0 100.0
MB: Irrigating Person-days 2.0 10.0 20.0 100.0
Equipment
MB: Plowing Machine-Hours 1.0 25.0 25.0 100.0
MB: Tilling & Harrowing Machine-Hours 1.0 16.0 16.0 100.0
MB: Seeding Machine-Hours 1.0 20.0 20.0 100.0
MB: Cultivation Machine-Hours 3.0 15.0 45.0 100.0
WW: Levelling Machine-Hours 1.0 25.0 25.0 100.0
WW: Seeding Machine-Hours 2.0 15.0 30.0 100.0
WW: Chemical Spray Machine-Hours 3.0 5.0 15.0 100.0
WW: Fertilizer Application Machine-Hours 4.0 5.0 20.0 100.0
Plant material
MB: Seeds Kilogram 18.0 2.2 39.6 100.0
WW: Seeds Kilogram 250.0 0.45 112.5 100.0
Fertilizers and biocides
MB: Amophos Kilogram 200.0 0.24 48.0 100.0
MB: Urea Kilogram 150.0 0.23 34.5 100.0
WW: Amophos Kilogram 300.0 0.24 72.0 100.0
WW: Urea Kilogram 700.0 0.23 161.0 100.0
WW: Herbicide Gram 300.0 0.17 51.0 100.0
WW: Fungicide Milliliter 200.0 0.035 7.0 100.0
WW: Pesticide Milliliter 200.0 0.015 3.0 100.0
Other
WW: Threshing Machine-Hours 1.0 50.0 50.0 100.0
MB: Threshing Machine-Hours 2.0 35.0 70.0 100.0
MB: Cleaning Machine-Hours 1.0 25.0 25.0 100.0
Total Fuel Required Liter 115.0 0.85 97.75 100.0
Total costs for establishment of the Technology 1'123.35
Total costs for establishment of the Technology in USD 1'123.35
Maintenance activities
n.a.

Natural environment

Average annual rainfall
  • < 250 mm
  • 251-500 mm
  • 501-750 mm
  • 751-1,000 mm
  • 1,001-1,500 mm
  • 1,501-2,000 mm
  • 2,001-3,000 mm
  • 3,001-4,000 mm
  • > 4,000 mm
Agro-climatic zone
  • humid
  • sub-humid
  • semi-arid
  • arid
Specifications on climate
n.a.
Slope
  • flat (0-2%)
  • gentle (3-5%)
  • moderate (6-10%)
  • rolling (11-15%)
  • hilly (16-30%)
  • steep (31-60%)
  • very steep (>60%)
Landforms
  • plateau/plains
  • ridges
  • mountain slopes
  • hill slopes
  • footslopes
  • valley floors
Altitude
  • 0-100 m a.s.l.
  • 101-500 m a.s.l.
  • 501-1,000 m a.s.l.
  • 1,001-1,500 m a.s.l.
  • 1,501-2,000 m a.s.l.
  • 2,001-2,500 m a.s.l.
  • 2,501-3,000 m a.s.l.
  • 3,001-4,000 m a.s.l.
  • > 4,000 m a.s.l.
Technology is applied in
  • convex situations
  • concave situations
  • not relevant
Soil depth
  • very shallow (0-20 cm)
  • shallow (21-50 cm)
  • moderately deep (51-80 cm)
  • deep (81-120 cm)
  • very deep (> 120 cm)
Soil texture (topsoil)
  • coarse/ light (sandy)
  • medium (loamy, silty)
  • fine/ heavy (clay)
Soil texture (> 20 cm below surface)
  • coarse/ light (sandy)
  • medium (loamy, silty)
  • fine/ heavy (clay)
Topsoil organic matter content
  • high (>3%)
  • medium (1-3%)
  • low (<1%)
Groundwater table
  • on surface
  • < 5 m
  • 5-50 m
  • > 50 m
Availability of surface water
  • excess
  • good
  • medium
  • poor/ none
Water quality (untreated)
  • good drinking water
  • poor drinking water (treatment required)
  • for agricultural use only (irrigation)
  • unusable
Water quality refers to: both ground and surface water
Is salinity a problem?
  • Ja
  • Nee

Occurrence of flooding
  • Ja
  • Nee
Species diversity
  • high
  • medium
  • low
Habitat diversity
  • high
  • medium
  • low

Characteristics of land users applying the Technology

Market orientation
  • subsistence (self-supply)
  • mixed (subsistence/ commercial)
  • commercial/ market
Off-farm income
  • less than 10% of all income
  • 10-50% of all income
  • > 50% of all income
Relative level of wealth
  • very poor
  • poor
  • average
  • rich
  • very rich
Level of mechanization
  • manual work
  • animal traction
  • mechanized/ motorized
Sedentary or nomadic
  • Sedentary
  • Semi-nomadic
  • Nomadic
Individuals or groups
  • individual/ household
  • groups/ community
  • cooperative
  • employee (company, government)
Gender
  • women
  • men
Age
  • children
  • youth
  • middle-aged
  • elderly
Area used per household
  • < 0.5 ha
  • 0.5-1 ha
  • 1-2 ha
  • 2-5 ha
  • 5-15 ha
  • 15-50 ha
  • 50-100 ha
  • 100-500 ha
  • 500-1,000 ha
  • 1,000-10,000 ha
  • > 10,000 ha
Scale
  • small-scale
  • medium-scale
  • large-scale
Land ownership
  • state
  • company
  • communal/ village
  • group
  • individual, not titled
  • individual, titled
Land use rights
  • open access (unorganized)
  • communal (organized)
  • leased
  • individual
Water use rights
  • open access (unorganized)
  • communal (organized)
  • leased
  • individual
Access to services and infrastructure
health

poor
x
good
education

poor
x
good
technical assistance

poor
x
good
employment (e.g. off-farm)

poor
x
good
markets

poor
x
good
energy

poor
x
good
roads and transport

poor
x
good
drinking water and sanitation

poor
x
good
financial services

poor
x
good

Impacts

Socio-economic impacts
Crop production
decreased
x
increased

crop quality
decreased
x
increased

expenses on agricultural inputs
increased
x
decreased

farm income
decreased
x
increased

diversity of income sources
decreased
x
increased

Socio-cultural impacts
food security/ self-sufficiency
reduced
x
improved

Ecological impacts
soil cover
reduced
x
improved

nutrient cycling/ recharge
decreased
x
increased

soil organic matter/ below ground C
decreased
x
increased

vegetation cover
decreased
x
increased

biomass/ above ground C
decreased
x
increased

Off-site impacts

Cost-benefit analysis

Benefits compared with establishment costs
Short-term returns
very negative
x
very positive

Long-term returns
very negative
x
very positive

Benefits compared with maintenance costs
Short-term returns
very negative
x
very positive

Long-term returns
very negative
x
very positive

Climate change

Gradual climate change
annual rainfall decrease

not well at all
x
very well

Adoption and adaptation

Percentage of land users in the area who have adopted the Technology
  • single cases/ experimental
  • 1-10%
  • 11-50%
  • > 50%
Of all those who have adopted the Technology, how many have done so without receiving material incentives?
  • 0-10%
  • 11-50%
  • 51-90%
  • 91-100%
Has the Technology been modified recently to adapt to changing conditions?
  • Ja
  • Nee
To which changing conditions?
  • climatic change/ extremes
  • changing markets
  • labour availability (e.g. due to migration)

Conclusions and lessons learnt

Strengths: land user's view
  • Significantly increased farm net-income
  • Adds nitrogen to soil and improves organic matter content of soil.
  • Mung bean has higher market price than traditionally grown wheat
Strengths: compiler’s or other key resource person’s view
  • Keeps soil covered during summer and early autumn months, thus protecting soil from heat
Weaknesses/ disadvantages/ risks: land user's viewhow to overcome
  • Increased workload for extra crop The increased net-income justifies this
  • Increased demand for extra water Efficient irrigation systems
Weaknesses/ disadvantages/ risks: compiler’s or other key resource person’s viewhow to overcome
  • Increased demand for irrigation water Efficient irrigation systems

References

Compiler
  • Joren Verbist
Editors
Reviewer
  • William Critchley
  • Rima Mekdaschi Studer
Date of documentation: Sept. 23, 2021
Last update: Jan. 21, 2022
Resource persons
Full description in the WOCAT database
Linked SLM data
Documentation was faciliated by
Institution Project
This work is licensed under Creative Commons Attribution-NonCommercial-ShareaAlike 4.0 International