Winter Wheat - Mung Bean Production System [Uzbekistan]
- Creation:
- Update:
- Compiler: Joren Verbist
- Editor: –
- Reviewers: William Critchley, Rima Mekdaschi Studer
technologies_5995 - Uzbekistan
View sections
Expand all Collapse all1. General information
1.2 Contact details of resource persons and institutions involved in the assessment and documentation of the Technology
Key resource person(s)
Consultant:
Sharma Ram
International Center of Agriculture Research in the Dry Areas (ICARDA)
Nepal
Regional Coordinator:
Mavlyanova Ravza
WorldVeg
Uzbekistan
Field Research Assistant:
Amanov Shukhrat
International Center of Agriculture Research in the Dry Areas (ICARDA)
Uzbekistan
Professor:
Saidov Saidjamol
Tajik Farming Institute
Tajikistan
Name of project which facilitated the documentation/ evaluation of the Technology (if relevant)
ICARDA Institutional Knowledge Management InitiativeName of the institution(s) which facilitated the documentation/ evaluation of the Technology (if relevant)
International Center for Agricultural Research in the Dry Areas (ICARDA) - Lebanon1.3 Conditions regarding the use of data documented through WOCAT
The compiler and key resource person(s) accept the conditions regarding the use of data documented through WOCAT:
Ja
1.4 Declaration on sustainability of the described Technology
Is the Technology described here problematic with regard to land degradation, so that it cannot be declared a sustainable land management technology?
Nee
2. Description of the SLM Technology
2.1 Short description of the Technology
Definition of the Technology:
The cultivation of short duration mung bean varieties lead to higher farm-income and improved soil health in Central Asia
2.2 Detailed description of the Technology
Description:
Central Asia is known for its harsh climate, extreme temperature differences and low precipitation. Uzbekistan is no exception to this. Its temperatures vary between -20 and 40 degrees Celsius and precipitation is limited to less than 400 millimetres. This results in difficult conditions for farmers to ensure agricultural production and food security.
Winter wheat is commonly grown to achieve food security and farm income as it is suited to the environment. However, the continuous cultivation of winter wheat has led to severe soil degradation and depletion, through extraction of soil organic matter and soil nutrients. Inevitably, this makes the soil unsuitable for crop cultivation.
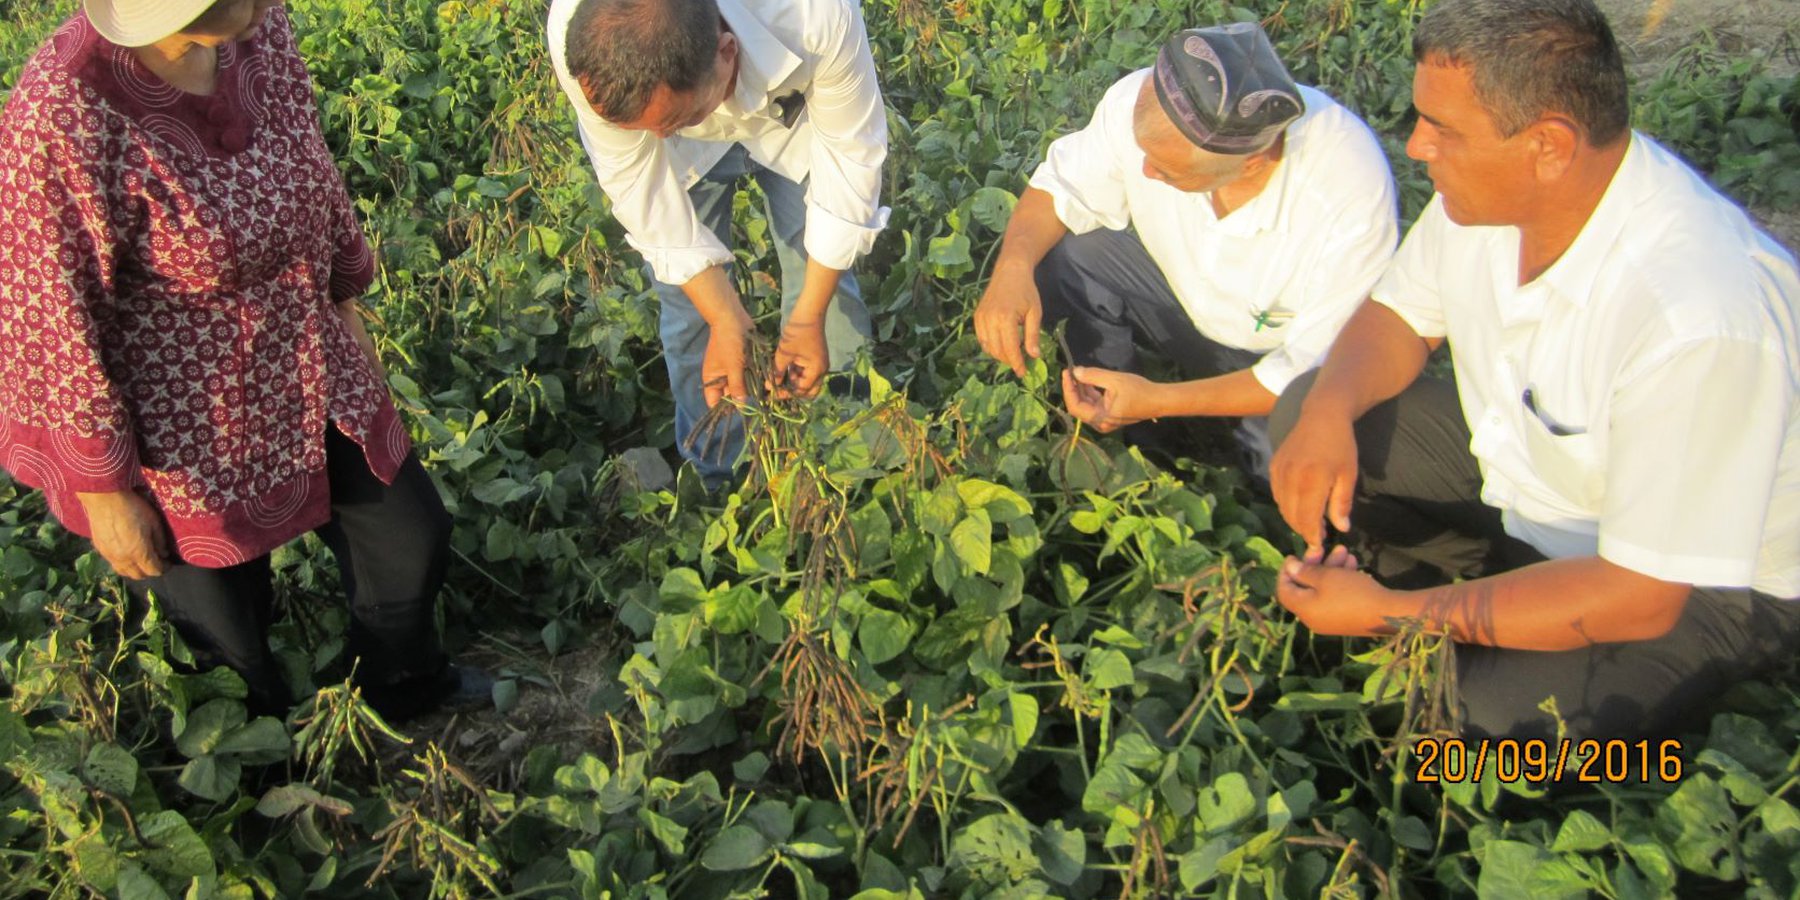
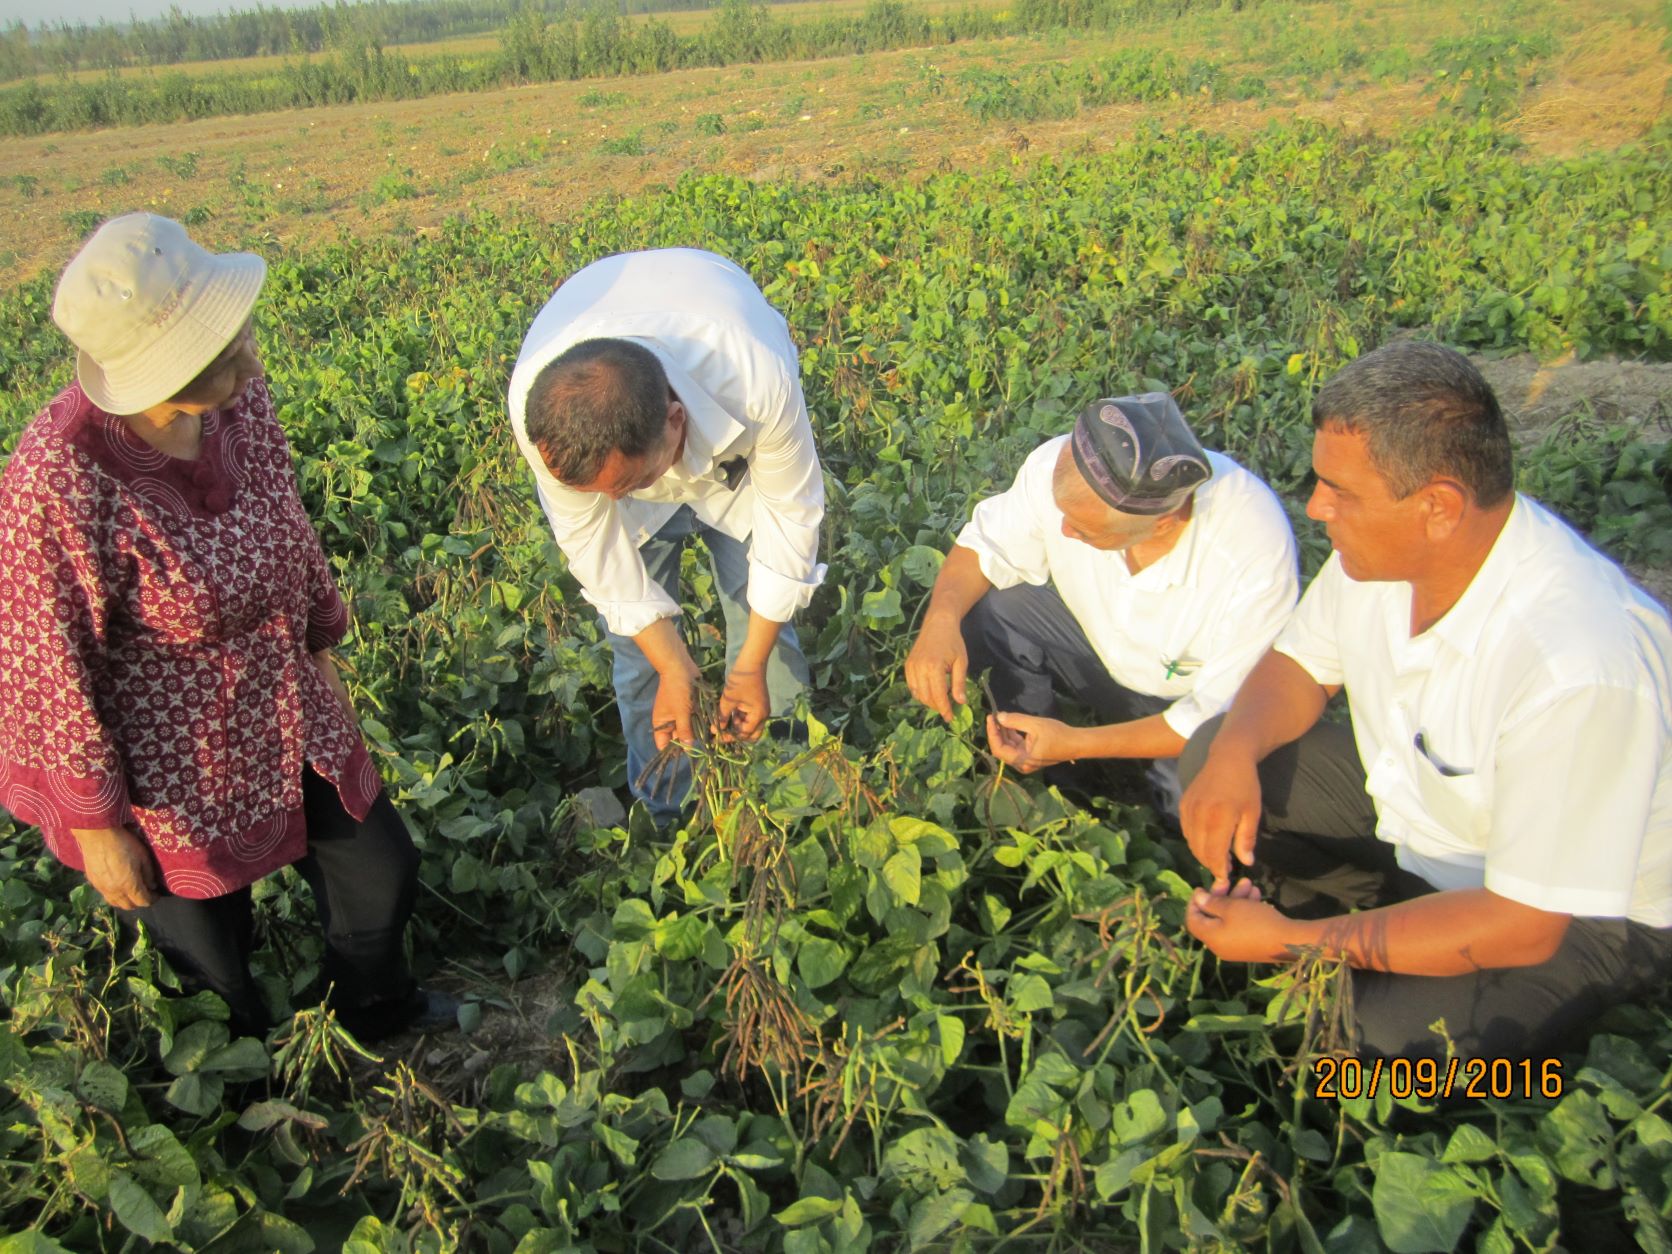
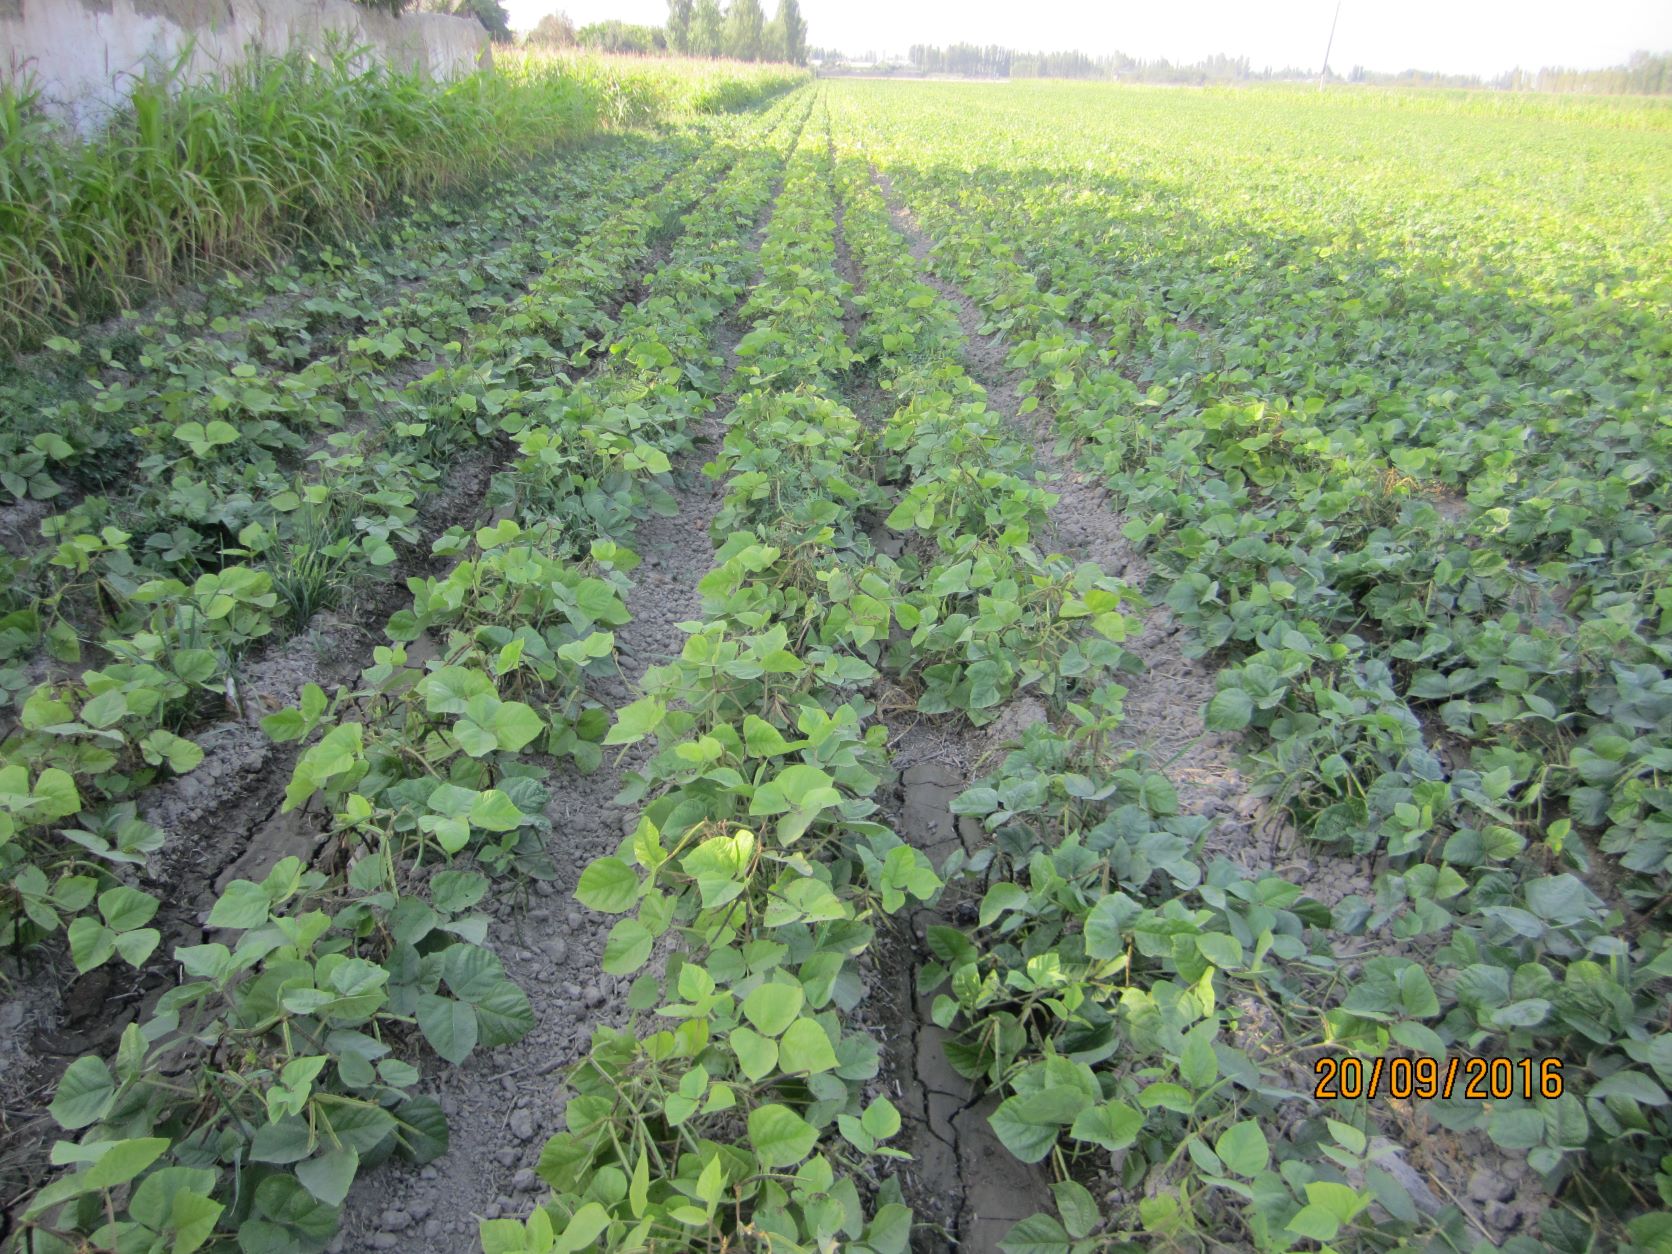
The International Centre of Agricultural Research in Dry Areas (ICARDA) anticipated this challenge, and introduced improved mung bean varieties in 2014. Mung bean (or "green gram": Vigna radiata) is a leguminous crop, which replenishes soil organic matter and fertility through nitrogen fixation. By including mung bean in the winter wheat production system, soil health is improved, fallow period reduced, and farmer incomes are increased. The increased farm income is due to the reduced amount of fertilizer required, increased yields and higher selling prices.
Mung bean realizes a profit of roughly 2000 USD per hectare in a period of 100 days, while winter wheat profits are approximately 600 USD per hectare in an eight month period. These numbers show the significant benefit of incorporating mung bean. Scientist have demonstrated that cultivating only mung bean would lead to even higher profit margins, but concluded that adoption is unrealistic as wheat is pre-dominantly grown for food security.
The incorporation of mung bean in the agricultural production system has one downside and that is increased irrigation demand, because mung bean requires additional water.
The mung bean-winter wheat-system follows the following crop rotation. The field for mung bean is tilled and harrowed, prior to seeding. Mung bean is mechanically seeded and manually harvested in June-July and September-October respectively. In this growing period, the field is weeded either manually or by a cultivator, irrigated, fertilizer mechanically applied or hand broadcast and mechanically weeded.
Winter wheat is mechanically planted in October, after the field is harrowed. In March-April, the wheat crops are treated with chemicals and fertilizers. In June-July, the winter wheat is mechanically harvested. Winter wheat also receives irrigation through a canal.
To conclude, this documentation shows that smart ICARDA crop choice with improved varieties extremely benefits local farmers incomes and adds resilience. It also reduces land degradation within a commonly used production system.
Data presented in this work is partly made available through CGIAR Research Program on Dryland Systems; Collaborative Research Project on Sustainable Soil Management to Enhance Agricultural Productivity in Central Asia funded by IFPRI within the framework of Russian Federation funding to CGIAR (2018-2019); CGIAR Collaborative Research & Capacity Building Program for the Development of Sustainable and Resilient Agricultural Production in Central Asia within the framework of Russian Federation Funding (2013-2016).
2.3 Photos of the Technology
Media Gallery

2.5 Country/ region/ locations where the Technology has been applied and which are covered by this assessment
Country:
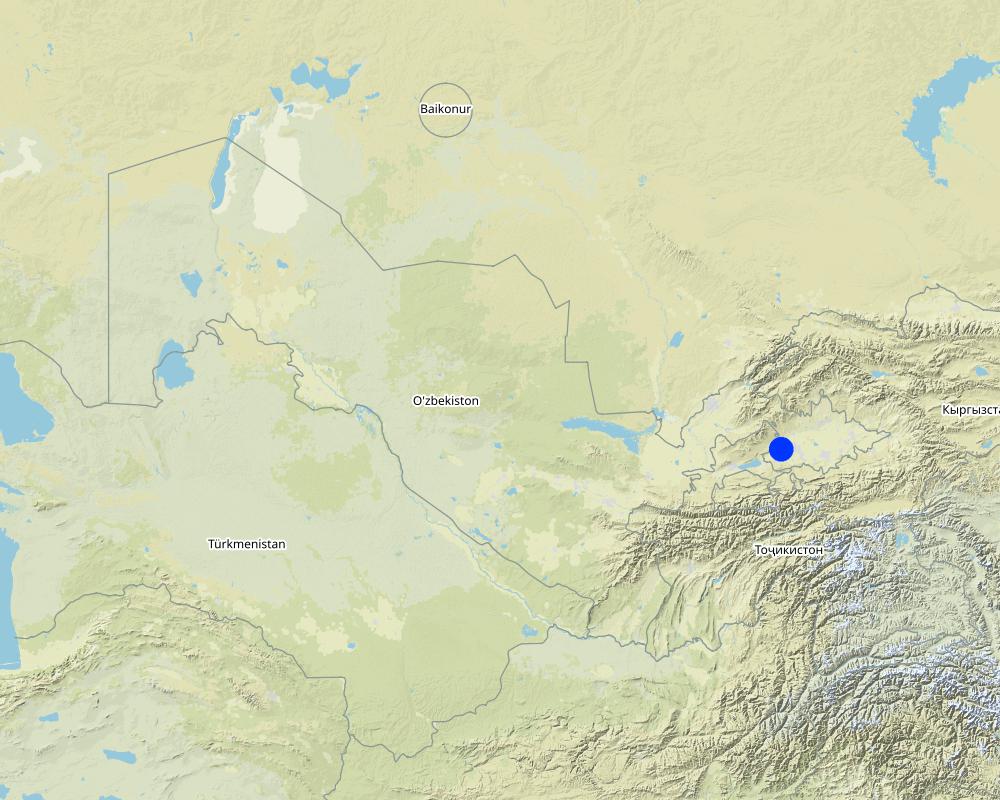
Uzbekistan
Specify the spread of the Technology:
- evenly spread over an area
If precise area is not known, indicate approximate area covered:
- 10-100 km2
Is/are the technology site(s) located in a permanently protected area?
Nee
Map
×2.6 Date of implementation
If precise year is not known, indicate approximate date:
- less than 10 years ago (recently)
2.7 Introduction of the Technology
Specify how the Technology was introduced:
- during experiments/ research
- through projects/ external interventions
3. Classification of the SLM Technology
3.1 Main purpose(s) of the Technology
- improve production
- reduce, prevent, restore land degradation
- create beneficial economic impact
- create beneficial social impact
3.2 Current land use type(s) where the Technology is applied
Land use mixed within the same land unit:
Nee

Cropland
- Annual cropping
Annual cropping - Specify crops:
- cereals - wheat (winter)
- legumes and pulses - beans
Number of growing seasons per year:
- 2
Is intercropping practiced?
Nee
Is crop rotation practiced?
Ja
3.3 Has land use changed due to the implementation of the Technology?
Has land use changed due to the implementation of the Technology?
- No (Continue with question 3.4)
3.4 Water supply
Water supply for the land on which the Technology is applied:
- mixed rainfed-irrigated
3.5 SLM group to which the Technology belongs
- improved ground/ vegetation cover
- improved plant varieties/ animal breeds
3.6 SLM measures comprising the Technology

agronomic measures
- A1: Vegetation/ soil cover
- A2: Organic matter/ soil fertility

management measures
- M2: Change of management/ intensity level
3.7 Main types of land degradation addressed by the Technology

soil erosion by water
- Wt: loss of topsoil/ surface erosion
- Wg: gully erosion/ gullying

soil erosion by wind
- Et: loss of topsoil

chemical soil deterioration
- Cn: fertility decline and reduced organic matter content (not caused by erosion)
3.8 Prevention, reduction, or restoration of land degradation
Specify the goal of the Technology with regard to land degradation:
- prevent land degradation
- reduce land degradation
4. Technical specifications, implementation activities, inputs, and costs
4.1 Technical drawing of the Technology
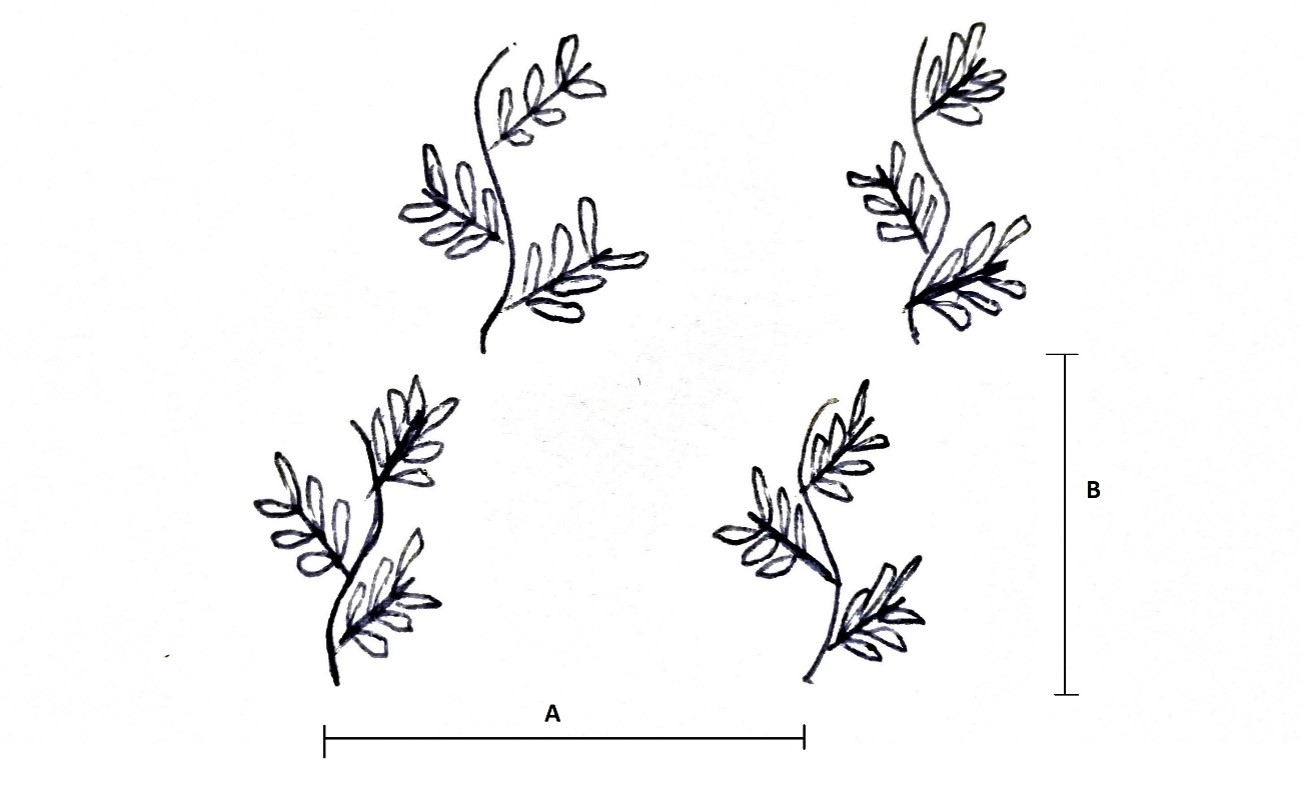
Technical specifications (related to technical drawing):
The following dimensions relate to mung bean cultivation:
A = Plant spacing within row = 8 to 10 centimetres
B = Spacing between rows = 45 to 60 centimetres
The plant density is 200,000 to 250,000 plants per hectare.
Author:
Joren Verbist
Date:
28/11/2021
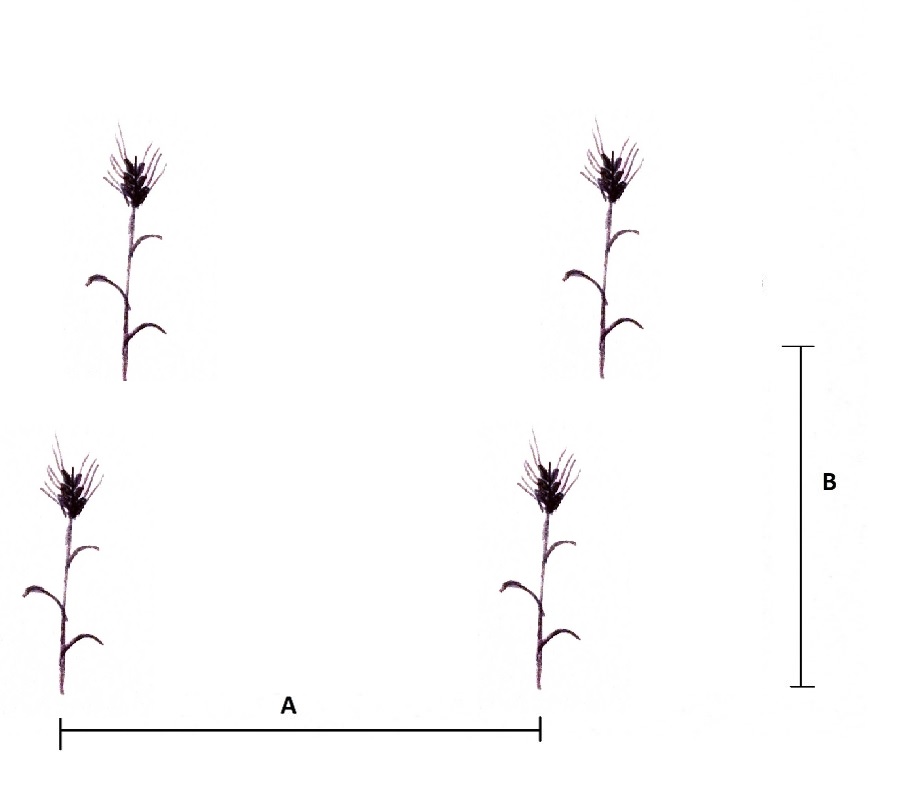
Technical specifications (related to technical drawing):
The following dimensions relate to Winter Wheat cultivation:
A = Plant spacing within row = 2 to 4 centimetres
B = Spacing between rows = 15 centimetres
The plant density is 4.5 million to 5 million plants per hectare.
Author:
Joren Verbist
Date:
28/11/2021
4.2 General information regarding the calculation of inputs and costs
Specify how costs and inputs were calculated:
- per Technology area
Indicate size and area unit:
1 Hectare
Specify currency used for cost calculations:
- USD
4.3 Establishment activities
| Activity | Timing (season) | |
|---|---|---|
| 1. | Mung bean: Seed procurement | May-June |
| 2. | Mung bean: Land preparation | June-July |
| 3. | Mung bean: Planting | June-July |
| 4. | Mung bean: Fertilization | June-July |
| 5. | Mung bean: Weed control | August |
| 6. | Mung bean: Harvesting and threshing | September-October |
| 7. | Mung bean: Storage for consumption and marketing | October onward |
| 8. | Wheat: Seed Procurement | August-September |
| 9. | Wheat: Land Preparation | September |
| 10. | Wheat: Seeding | October |
| 11. | Wheat: Fertilizer Application | March-April |
| 12. | Wheat: Weed control | March-April |
| 13. | Wheat: Harvesting and threshing | June-July |
| 14. | Wheat: Storage for consumption and market | July onward |
4.4 Costs and inputs needed for establishment
| Specify input | Unit | Quantity | Costs per Unit | Total costs per input | % of costs borne by land users | |
|---|---|---|---|---|---|---|
| Labour | WW: Irrigating | Person-days | 6.0 | 10.0 | 60.0 | 100.0 |
| Labour | MB: Weeding | Person-days | 3.8 | 10.0 | 38.0 | 100.0 |
| Labour | MB: Harvesting | Person-days | 3.8 | 10.0 | 38.0 | 100.0 |
| Labour | MB: Irrigating | Person-days | 2.0 | 10.0 | 20.0 | 100.0 |
| Equipment | MB: Plowing | Machine-Hours | 1.0 | 25.0 | 25.0 | 100.0 |
| Equipment | MB: Tilling & Harrowing | Machine-Hours | 1.0 | 16.0 | 16.0 | 100.0 |
| Equipment | MB: Seeding | Machine-Hours | 1.0 | 20.0 | 20.0 | 100.0 |
| Equipment | MB: Cultivation | Machine-Hours | 3.0 | 15.0 | 45.0 | 100.0 |
| Equipment | WW: Levelling | Machine-Hours | 1.0 | 25.0 | 25.0 | 100.0 |
| Equipment | WW: Seeding | Machine-Hours | 2.0 | 15.0 | 30.0 | 100.0 |
| Equipment | WW: Chemical Spray | Machine-Hours | 3.0 | 5.0 | 15.0 | 100.0 |
| Equipment | WW: Fertilizer Application | Machine-Hours | 4.0 | 5.0 | 20.0 | 100.0 |
| Plant material | MB: Seeds | Kilogram | 18.0 | 2.2 | 39.6 | 100.0 |
| Plant material | WW: Seeds | Kilogram | 250.0 | 0.45 | 112.5 | 100.0 |
| Fertilizers and biocides | MB: Amophos | Kilogram | 200.0 | 0.24 | 48.0 | 100.0 |
| Fertilizers and biocides | MB: Urea | Kilogram | 150.0 | 0.23 | 34.5 | 100.0 |
| Fertilizers and biocides | WW: Amophos | Kilogram | 300.0 | 0.24 | 72.0 | 100.0 |
| Fertilizers and biocides | WW: Urea | Kilogram | 700.0 | 0.23 | 161.0 | 100.0 |
| Fertilizers and biocides | WW: Herbicide | Gram | 300.0 | 0.17 | 51.0 | 100.0 |
| Fertilizers and biocides | WW: Fungicide | Milliliter | 200.0 | 0.035 | 7.0 | 100.0 |
| Fertilizers and biocides | WW: Pesticide | Milliliter | 200.0 | 0.015 | 3.0 | 100.0 |
| Other | WW: Threshing | Machine-Hours | 1.0 | 50.0 | 50.0 | 100.0 |
| Other | MB: Threshing | Machine-Hours | 2.0 | 35.0 | 70.0 | 100.0 |
| Other | MB: Cleaning | Machine-Hours | 1.0 | 25.0 | 25.0 | 100.0 |
| Other | Total Fuel Required | Liter | 115.0 | 0.85 | 97.75 | 100.0 |
| Total costs for establishment of the Technology | 1123.35 | |||||
| Total costs for establishment of the Technology in USD | 1123.35 | |||||
Comments:
MB relates to Mung bean and WW to Winter Wheat
5. Natural and human environment
5.1 Climate
Annual rainfall
- < 250 mm
- 251-500 mm
- 501-750 mm
- 751-1,000 mm
- 1,001-1,500 mm
- 1,501-2,000 mm
- 2,001-3,000 mm
- 3,001-4,000 mm
- > 4,000 mm
Agro-climatic zone
- semi-arid
5.2 Topography
Slopes on average:
- flat (0-2%)
- gentle (3-5%)
- moderate (6-10%)
- rolling (11-15%)
- hilly (16-30%)
- steep (31-60%)
- very steep (>60%)
Landforms:
- plateau/plains
- ridges
- mountain slopes
- hill slopes
- footslopes
- valley floors
Altitudinal zone:
- 0-100 m a.s.l.
- 101-500 m a.s.l.
- 501-1,000 m a.s.l.
- 1,001-1,500 m a.s.l.
- 1,501-2,000 m a.s.l.
- 2,001-2,500 m a.s.l.
- 2,501-3,000 m a.s.l.
- 3,001-4,000 m a.s.l.
- > 4,000 m a.s.l.
Indicate if the Technology is specifically applied in:
- not relevant
5.3 Soils
Soil depth on average:
- very shallow (0-20 cm)
- shallow (21-50 cm)
- moderately deep (51-80 cm)
- deep (81-120 cm)
- very deep (> 120 cm)
Soil texture (topsoil):
- medium (loamy, silty)
Soil texture (> 20 cm below surface):
- medium (loamy, silty)
Topsoil organic matter:
- medium (1-3%)
- low (<1%)
5.4 Water availability and quality
Ground water table:
5-50 m
Availability of surface water:
good
Water quality (untreated):
for agricultural use only (irrigation)
Water quality refers to:
both ground and surface water
Is water salinity a problem?
Ja
Is flooding of the area occurring?
Nee
5.5 Biodiversity
Species diversity:
- low
Habitat diversity:
- low
5.6 Characteristics of land users applying the Technology
Sedentary or nomadic:
- Sedentary
Market orientation of production system:
- mixed (subsistence/ commercial)
Off-farm income:
- 10-50% of all income
Relative level of wealth:
- very poor
- poor
Individuals or groups:
- individual/ household
Level of mechanization:
- mechanized/ motorized
Gender:
- women
- men
Age of land users:
- youth
- middle-aged
- elderly
5.7 Average area of land used by land users applying the Technology
- < 0.5 ha
- 0.5-1 ha
- 1-2 ha
- 2-5 ha
- 5-15 ha
- 15-50 ha
- 50-100 ha
- 100-500 ha
- 500-1,000 ha
- 1,000-10,000 ha
- > 10,000 ha
Is this considered small-, medium- or large-scale (referring to local context)?
- small-scale
5.8 Land ownership, land use rights, and water use rights
Land ownership:
- individual, titled
Land use rights:
- individual
Water use rights:
- individual
5.9 Access to services and infrastructure
health:
- poor
- moderate
- good
education:
- poor
- moderate
- good
technical assistance:
- poor
- moderate
- good
employment (e.g. off-farm):
- poor
- moderate
- good
markets:
- poor
- moderate
- good
energy:
- poor
- moderate
- good
roads and transport:
- poor
- moderate
- good
drinking water and sanitation:
- poor
- moderate
- good
financial services:
- poor
- moderate
- good
6. Impacts and concluding statements
6.1 On-site impacts the Technology has shown
Socio-economic impacts
Production
crop production
crop quality
Income and costs
expenses on agricultural inputs
farm income
diversity of income sources
Socio-cultural impacts
food security/ self-sufficiency
Ecological impacts
Soil
soil cover
nutrient cycling/ recharge
soil organic matter/ below ground C
Biodiversity: vegetation, animals
Vegetation cover
biomass/ above ground C
6.3 Exposure and sensitivity of the Technology to gradual climate change and climate-related extremes/ disasters (as perceived by land users)
Gradual climate change
Gradual climate change
| Season | increase or decrease | How does the Technology cope with it? | |
|---|---|---|---|
| annual rainfall | decrease | not well |
6.4 Cost-benefit analysis
How do the benefits compare with the establishment costs (from land users’ perspective)?
Short-term returns:
very positive
Long-term returns:
very positive
How do the benefits compare with the maintenance/ recurrent costs (from land users' perspective)?
Short-term returns:
very positive
Long-term returns:
very positive
6.5 Adoption of the Technology
- > 50%
Of all those who have adopted the Technology, how many did so spontaneously, i.e. without receiving any material incentives/ payments?
- 91-100%
6.6 Adaptation
Has the Technology been modified recently to adapt to changing conditions?
Nee
6.7 Strengths/ advantages/ opportunities of the Technology
| Strengths/ advantages/ opportunities in the land user’s view |
|---|
| Significantly increased farm net-income |
| Adds nitrogen to soil and improves organic matter content of soil. |
| Mung bean has higher market price than traditionally grown wheat |
| Strengths/ advantages/ opportunities in the compiler’s or other key resource person’s view |
|---|
| Keeps soil covered during summer and early autumn months, thus protecting soil from heat |
6.8 Weaknesses/ disadvantages/ risks of the Technology and ways of overcoming them
| Weaknesses/ disadvantages/ risks in the land user’s view | How can they be overcome? |
|---|---|
| Increased workload for extra crop | The increased net-income justifies this |
| Increased demand for extra water | Efficient irrigation systems |
| Weaknesses/ disadvantages/ risks in the compiler’s or other key resource person’s view | How can they be overcome? |
|---|---|
| Increased demand for irrigation water | Efficient irrigation systems |
7. References and links
7.1 Methods/ sources of information
- interviews with SLM specialists/ experts
- compilation from reports and other existing documentation
When were the data compiled (in the field)?
2021
Links and modules
Expand all Collapse allLinks
No links
Modules
No modules