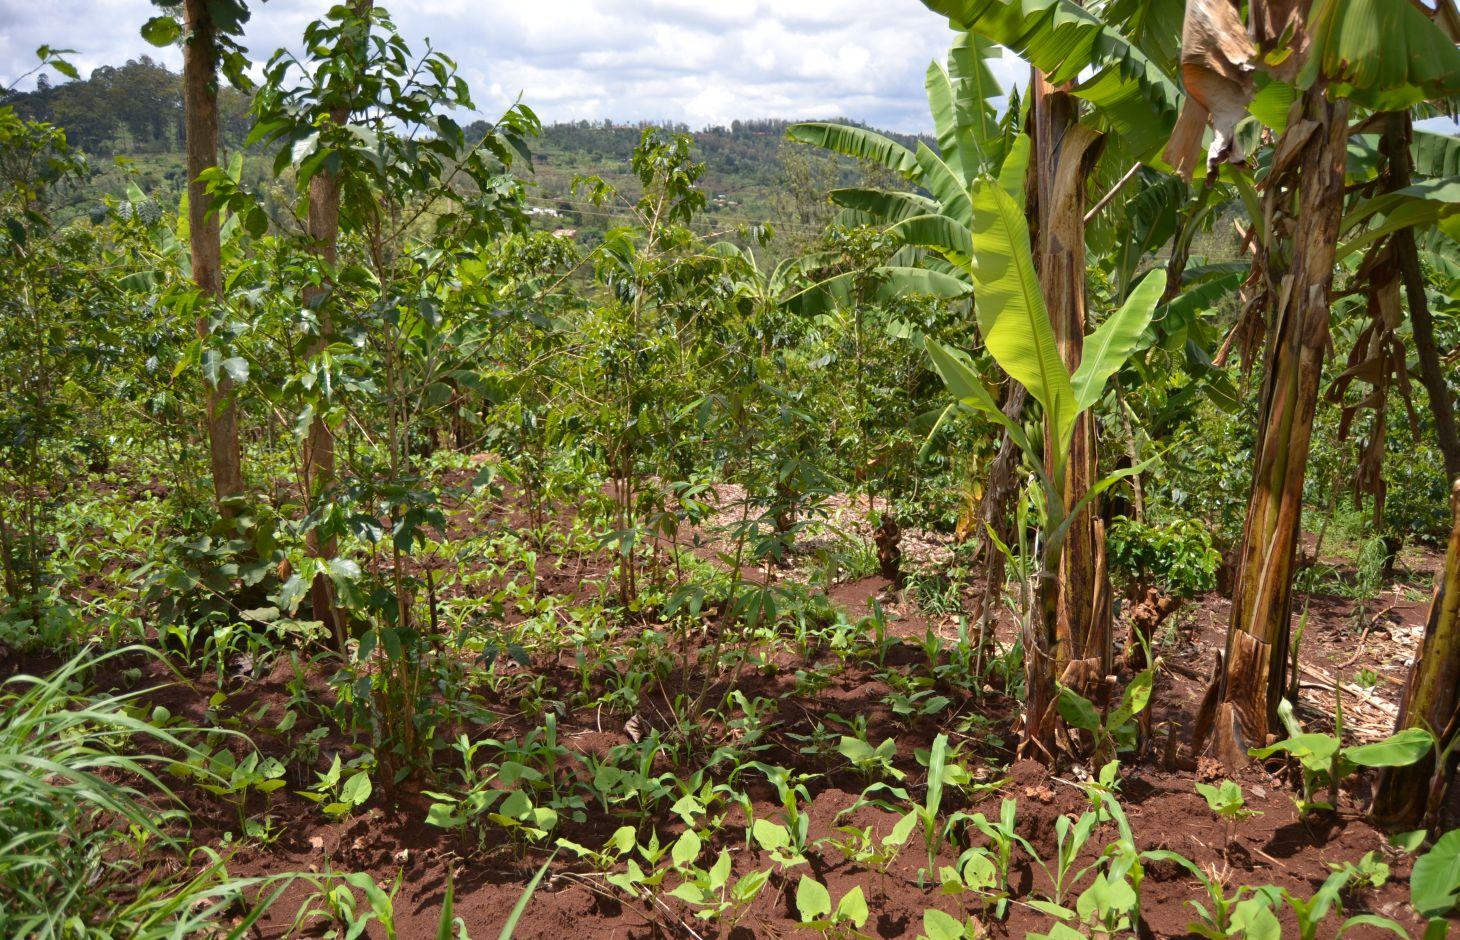
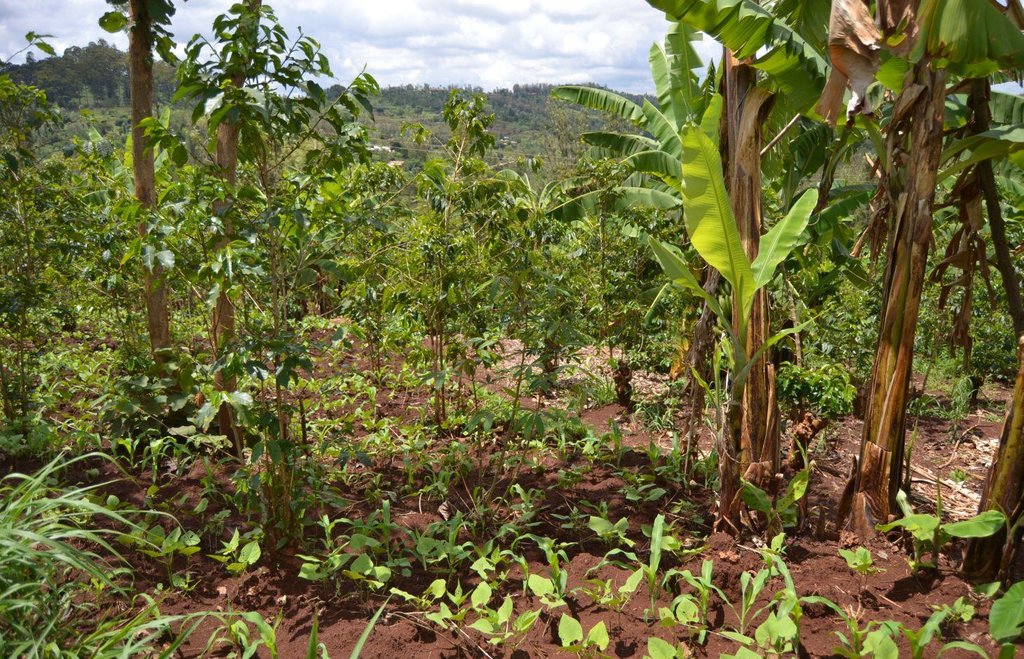
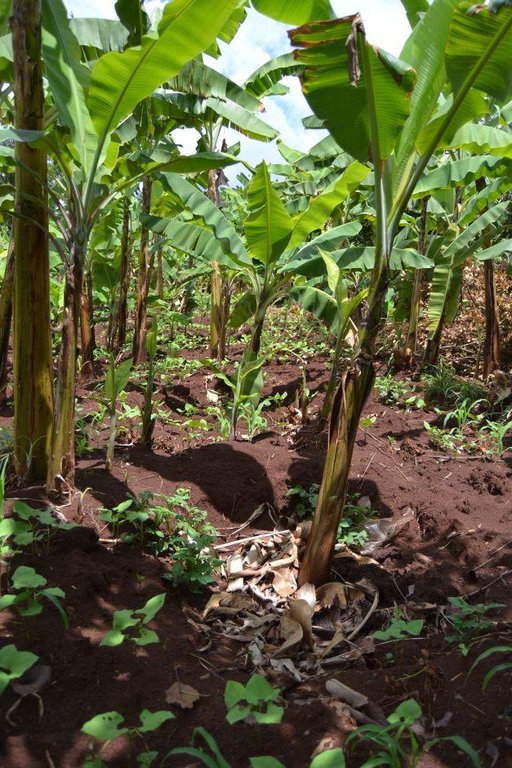
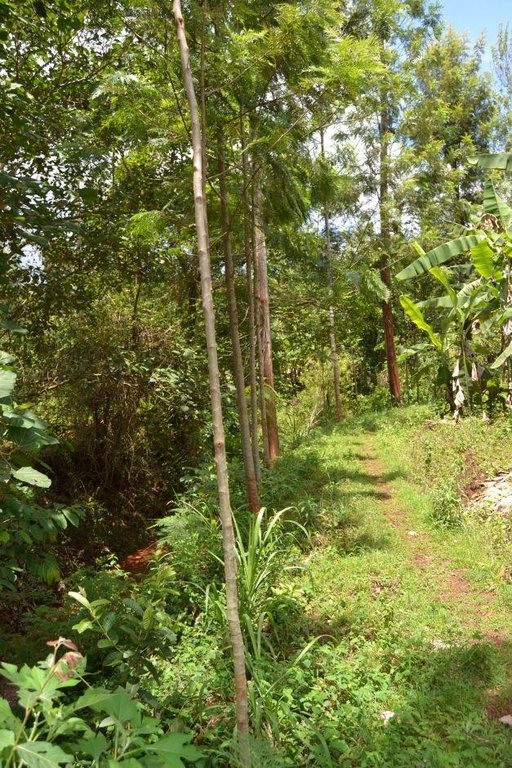
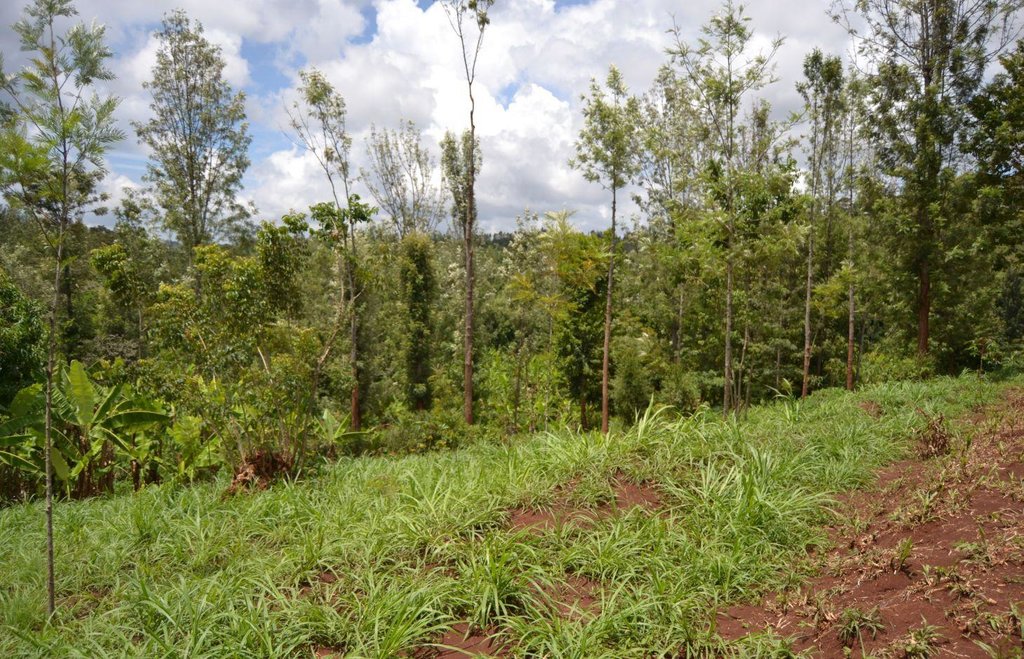
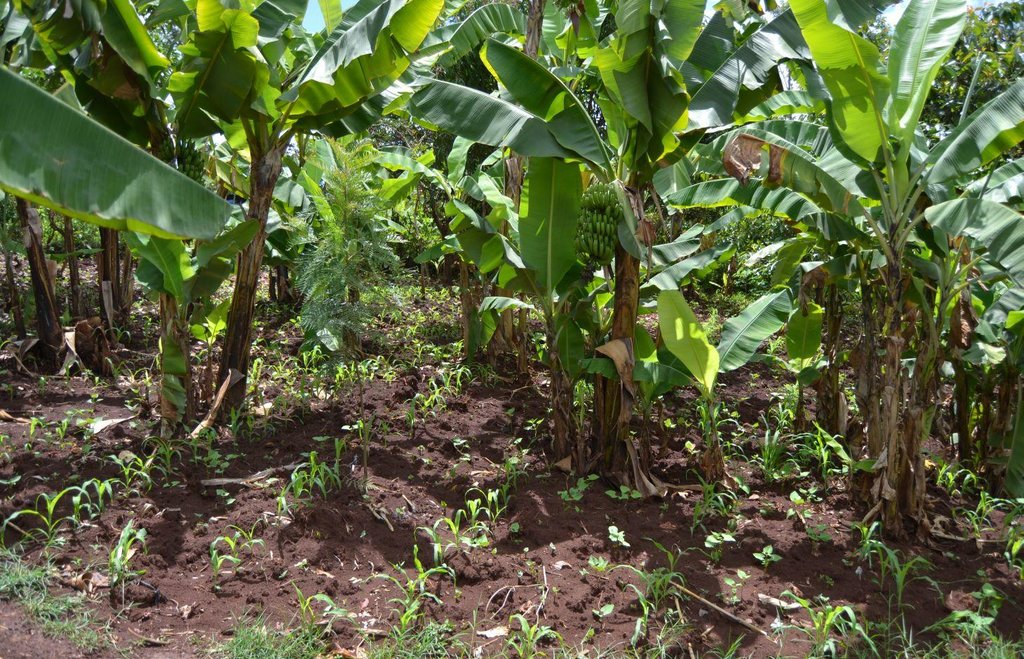
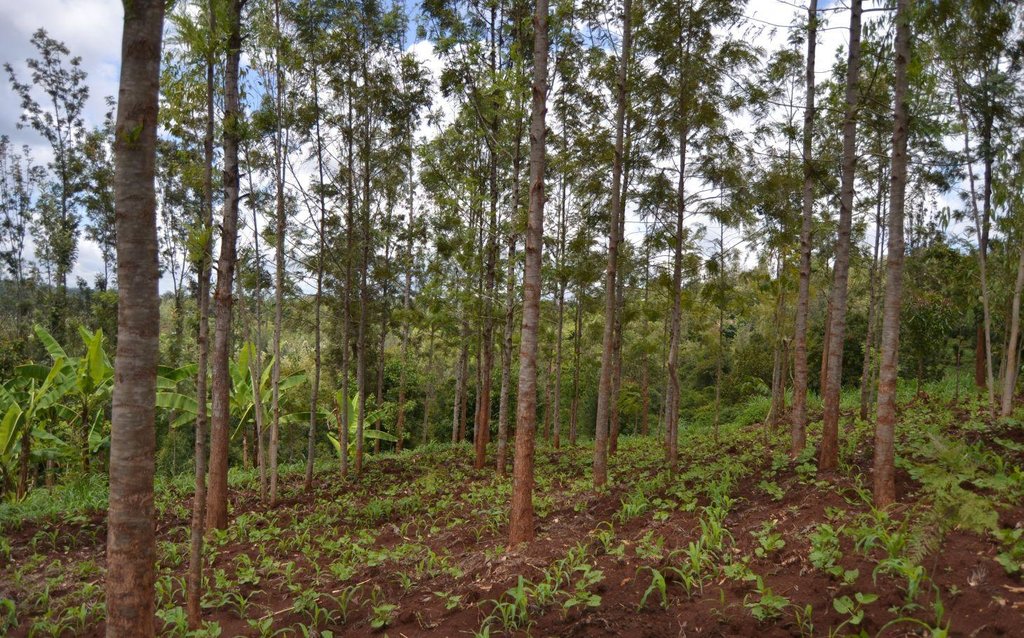
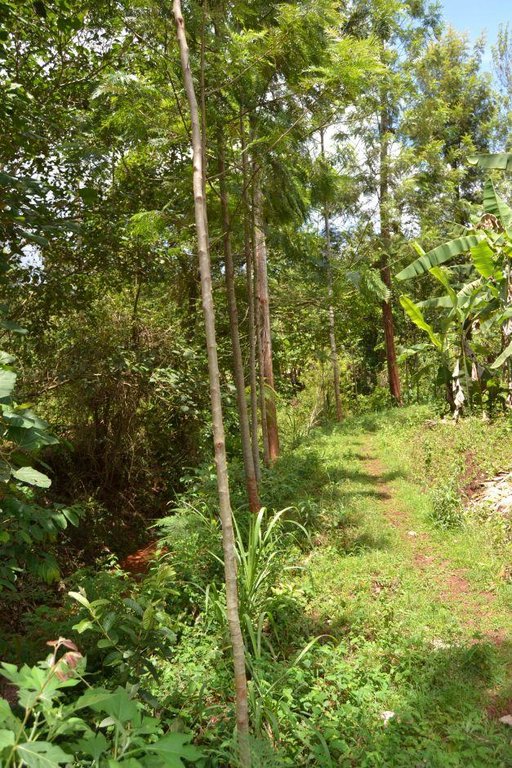
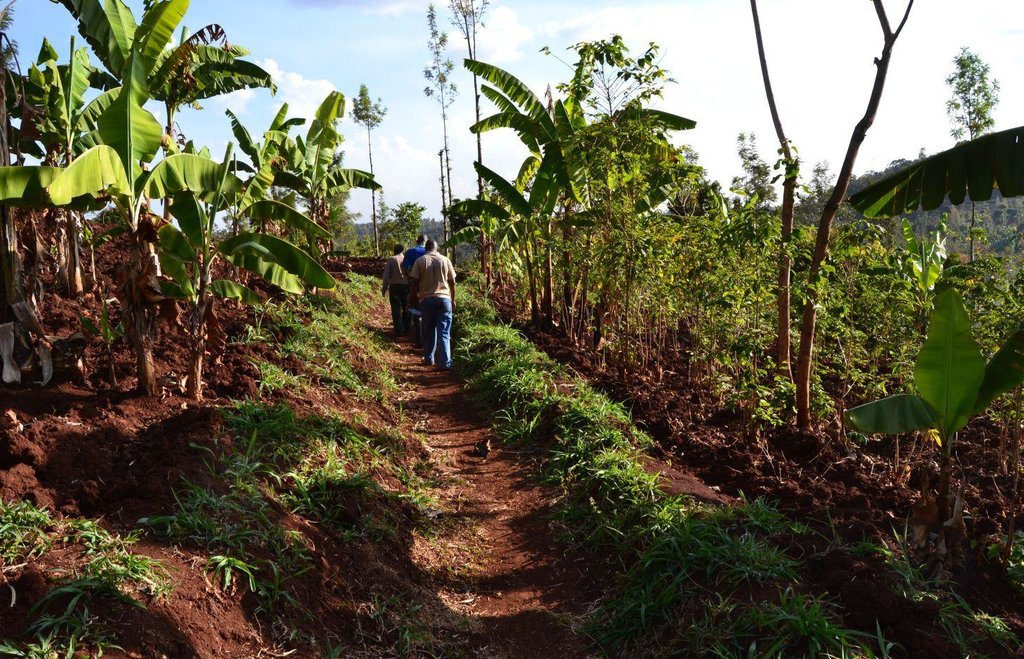
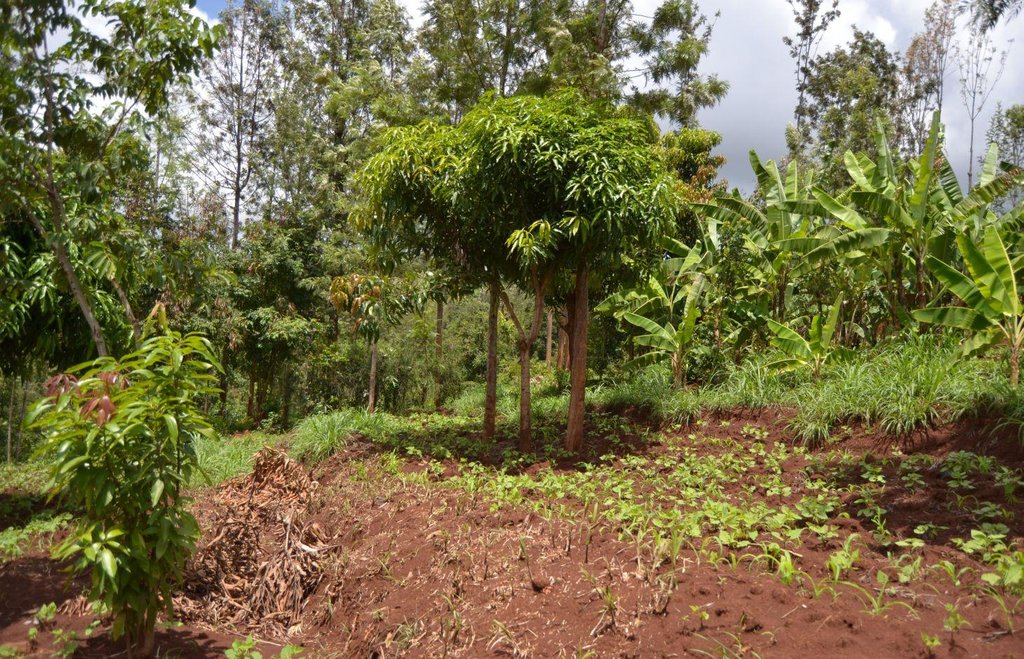
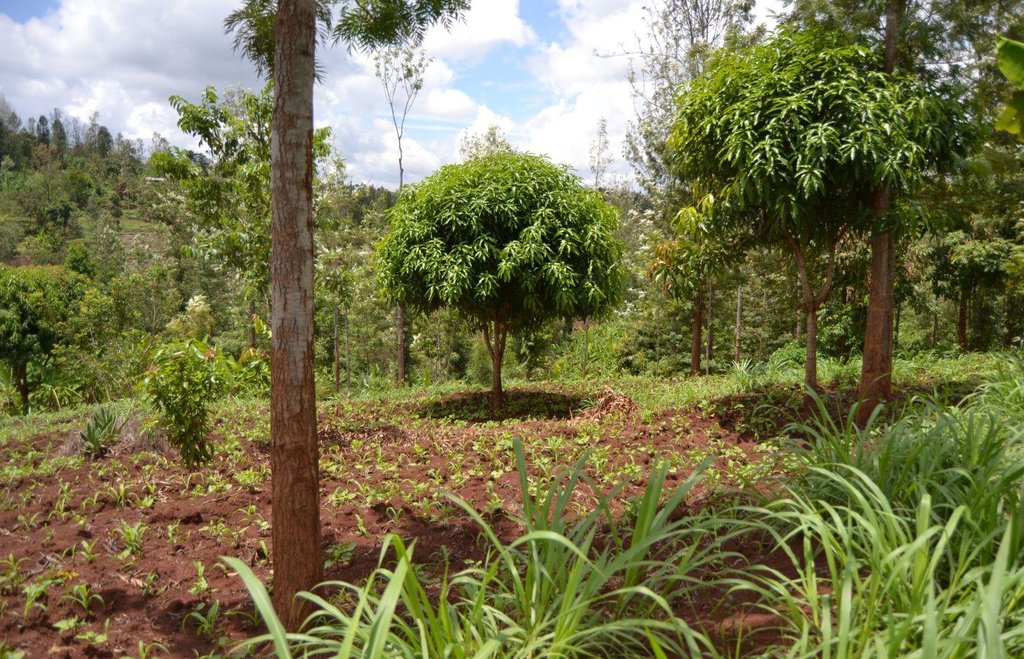
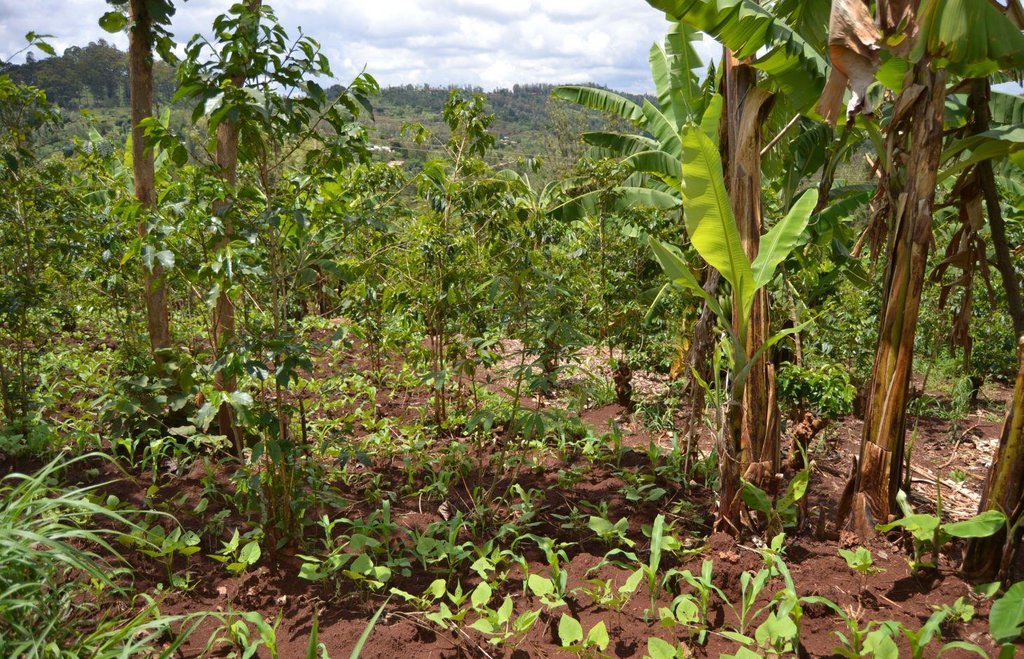
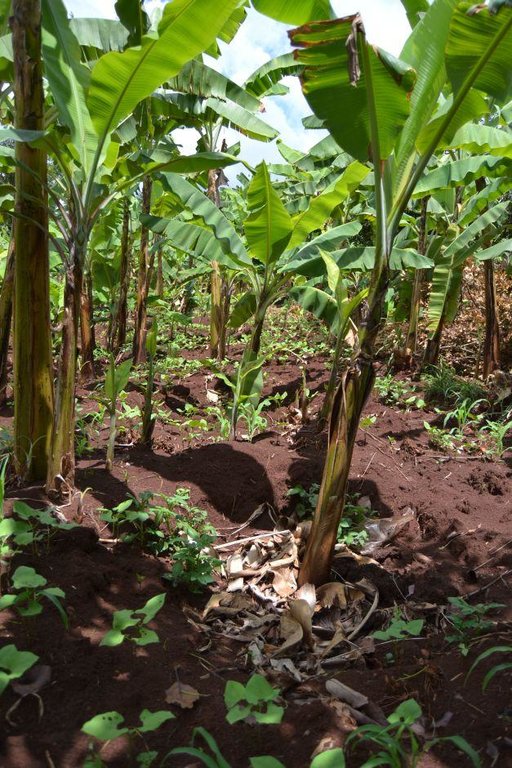
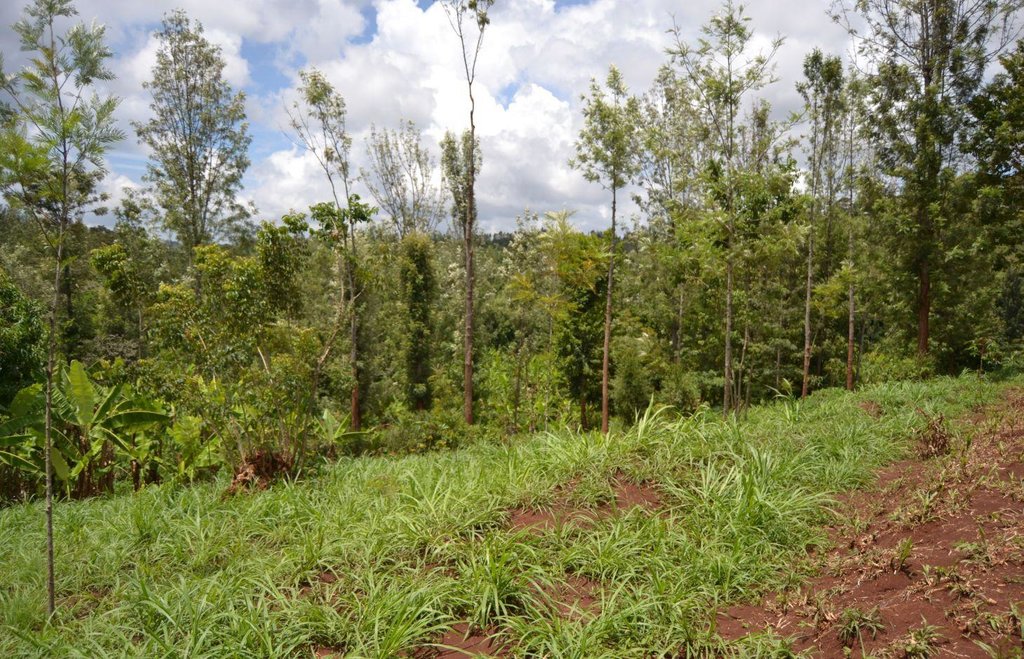
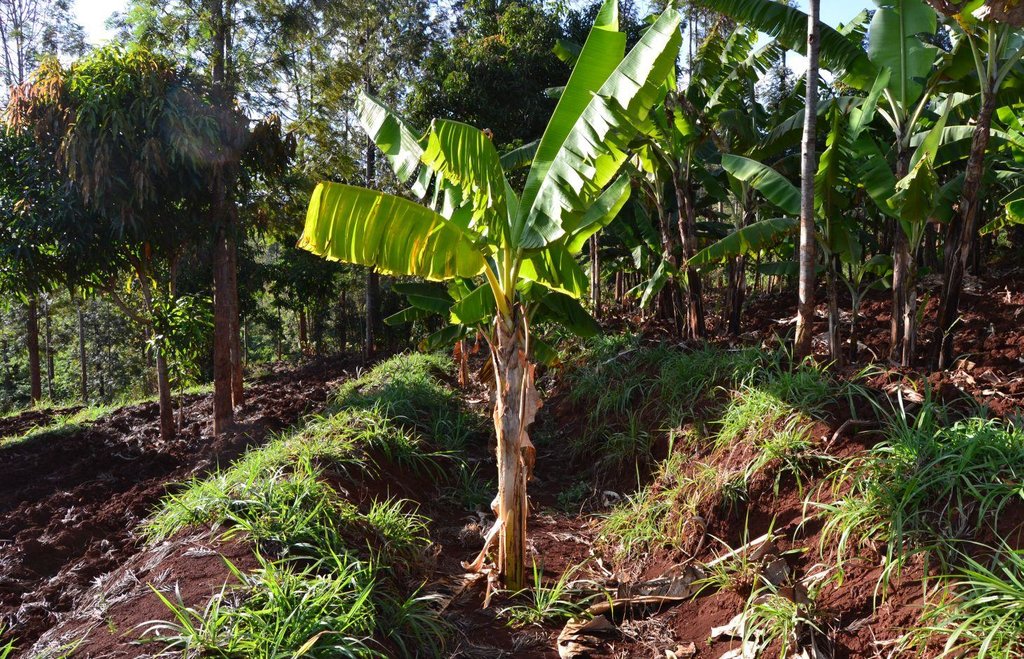
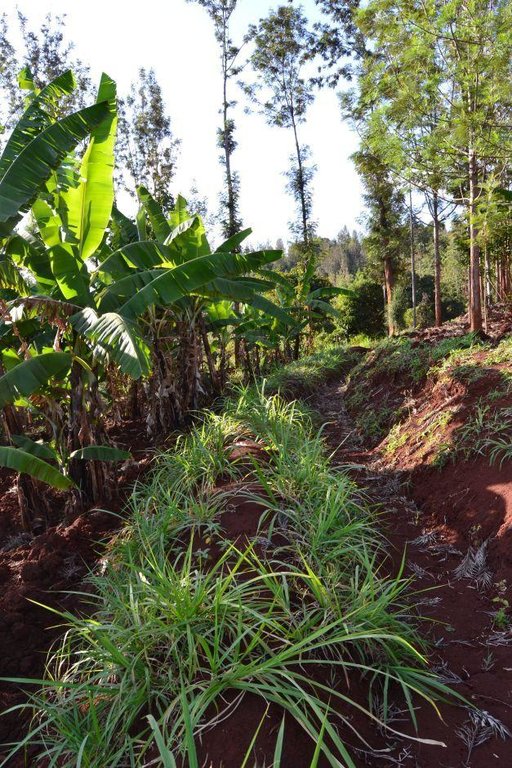
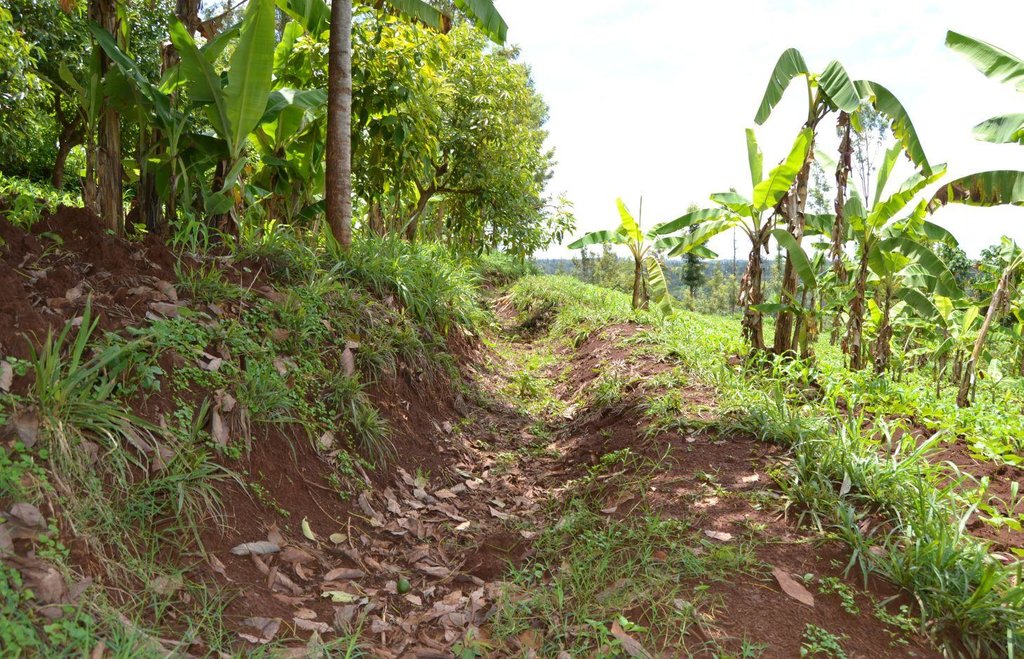
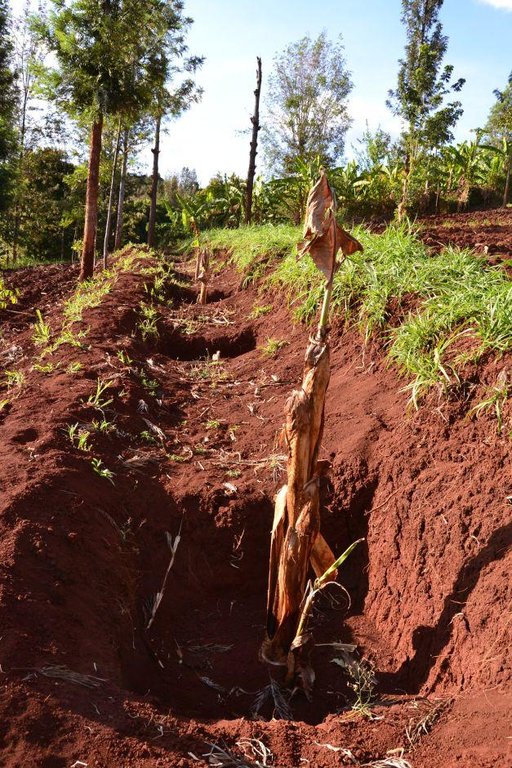
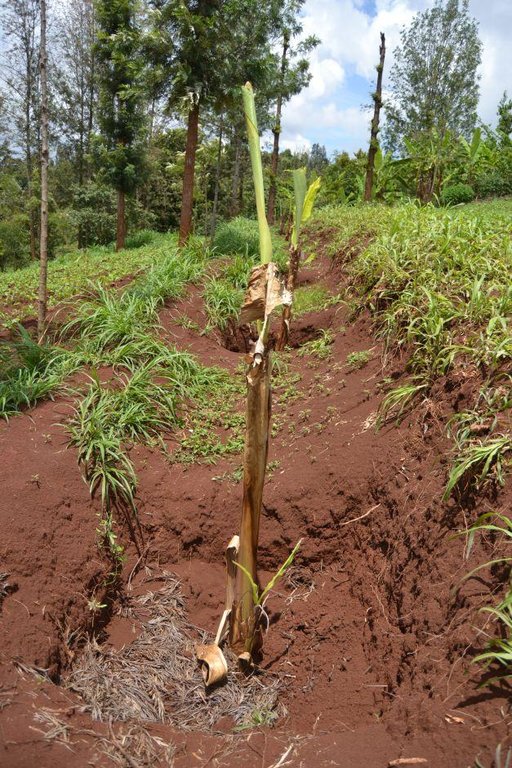
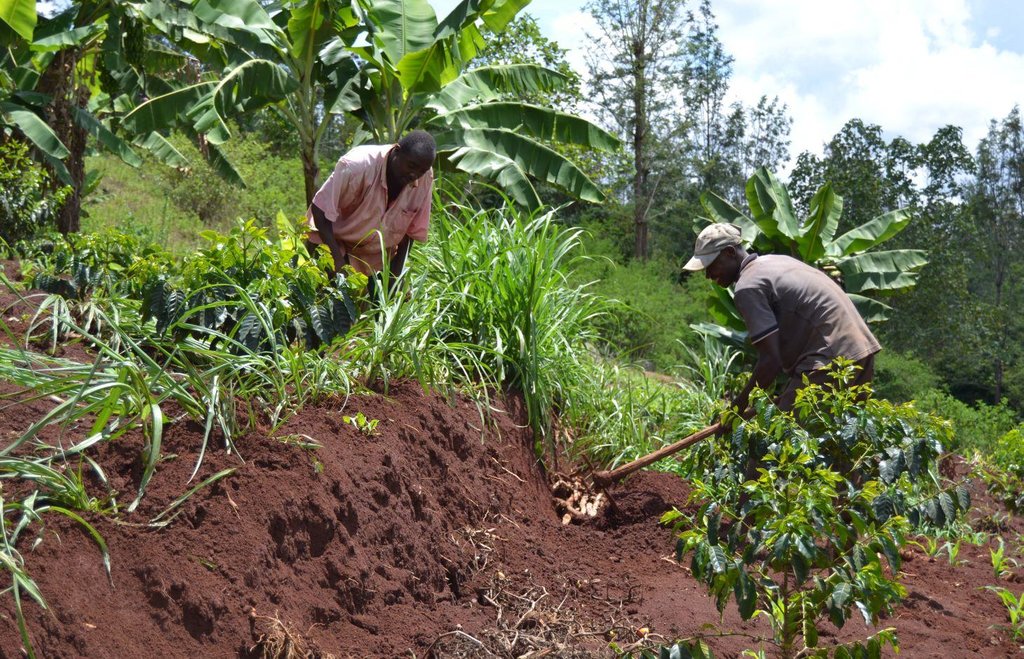
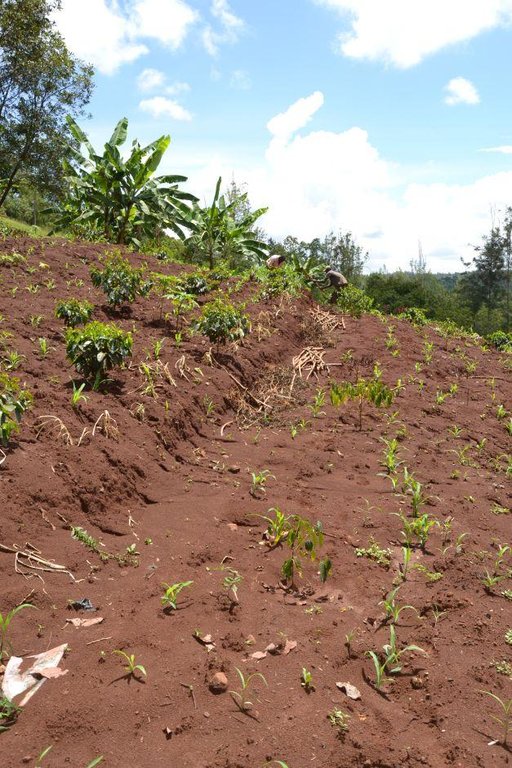
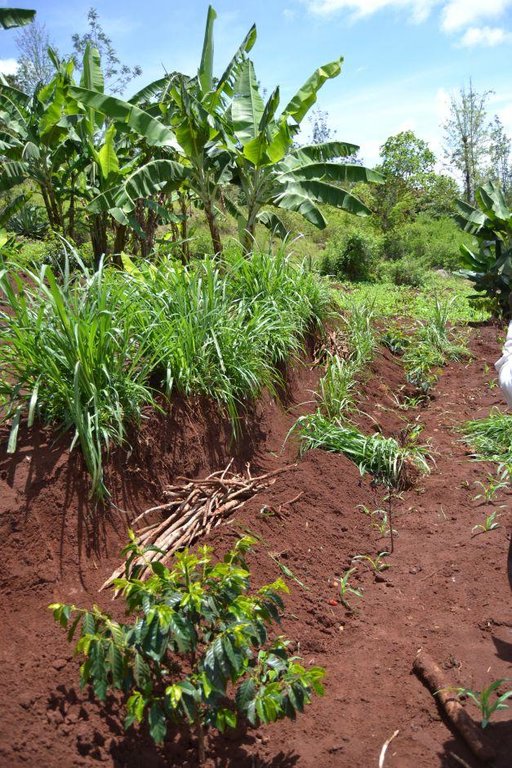
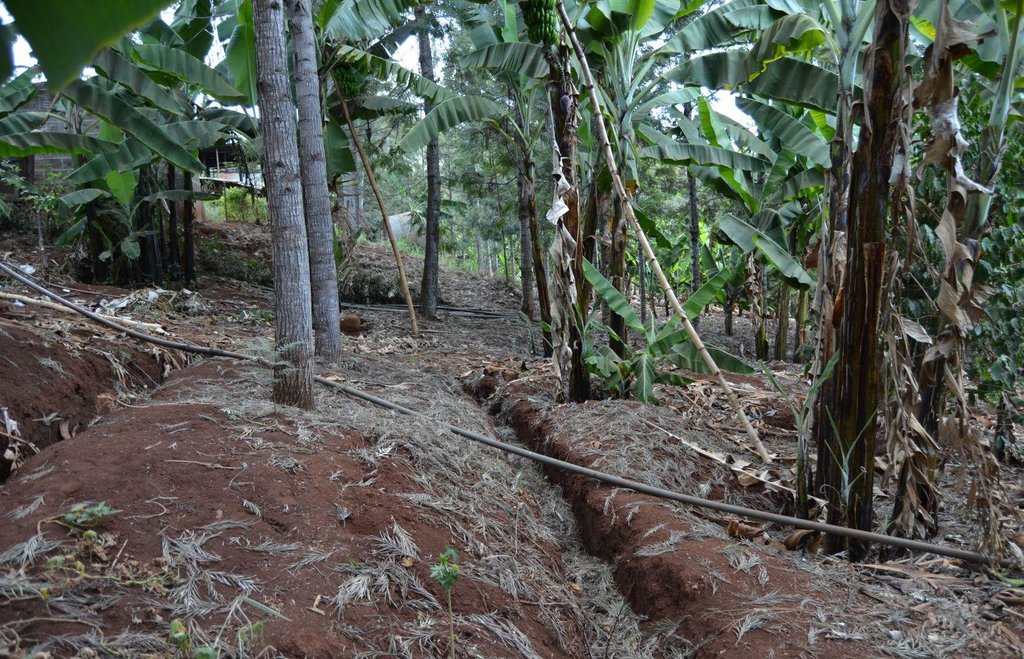
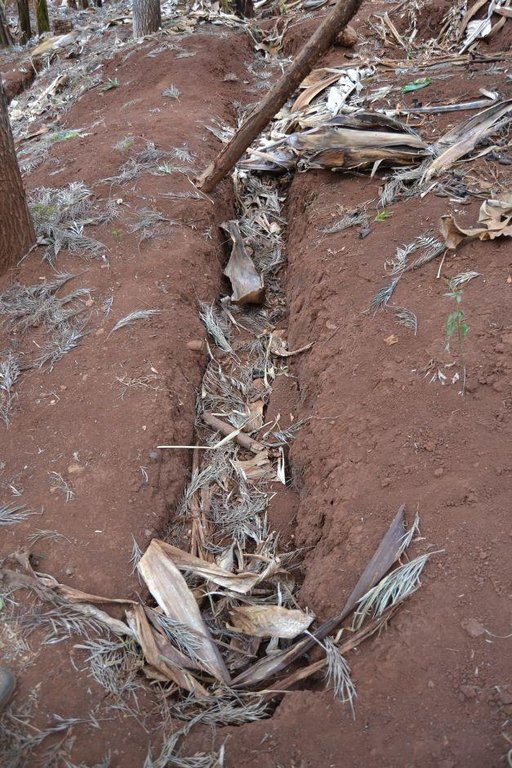
Agroforestry land use in bench terraces with cut-off and infiltration ditches and Napier grass strips. [Kenya]
- Creation:
- Update:
- Compiler: Laura D'Aietti
- Editor: –
- Reviewer: Alexandra Gavilano
technologies_1159 - Kenya
- Full summary as PDF
- Full summary as PDF for print
- Full summary in the browser
- Full summary (unformatted)
- Agroforestry land use in bench terraces with cut-off and infiltration ditches and Napier grass strips.: Des. 29, 2016 (inactive)
- Agroforestry land use in bench terraces with cut-off and infiltration ditches and Napier grass strips.: Junie 5, 2017 (inactive)
- Agroforestry land use in bench terraces with cut-off and infiltration ditches and Napier grass strips.: Mei 3, 2019 (public)
View sections
Expand all Collapse all1. General information
1.2 Contact details of resource persons and institutions involved in the assessment and documentation of the Technology
Key resource person(s)
SLM specialist:
F. K. Nyamu Jospeh
WRUA Sabasaba
Kenya
Name of the institution(s) which facilitated the documentation/ evaluation of the Technology (if relevant)
Food and Agriculture Organization of the United Nations (FAO) - Italy1.3 Conditions regarding the use of data documented through WOCAT
When were the data compiled (in the field)?
02/11/2012
The compiler and key resource person(s) accept the conditions regarding the use of data documented through WOCAT:
Ja
2. Description of the SLM Technology
2.1 Short description of the Technology
Definition of the Technology:
A combination of agricultural (e.g. intercropping, mulching, minimum tillage), vegetative (e.g. Napier grass strips, trees planting) and structural (e.g. ditches, bench terracing) measures which aim to maximise the overall yield in a sustainable manner (e.g. reduction of soil erosion and increasing the soil quality).
2.2 Detailed description of the Technology
Description:
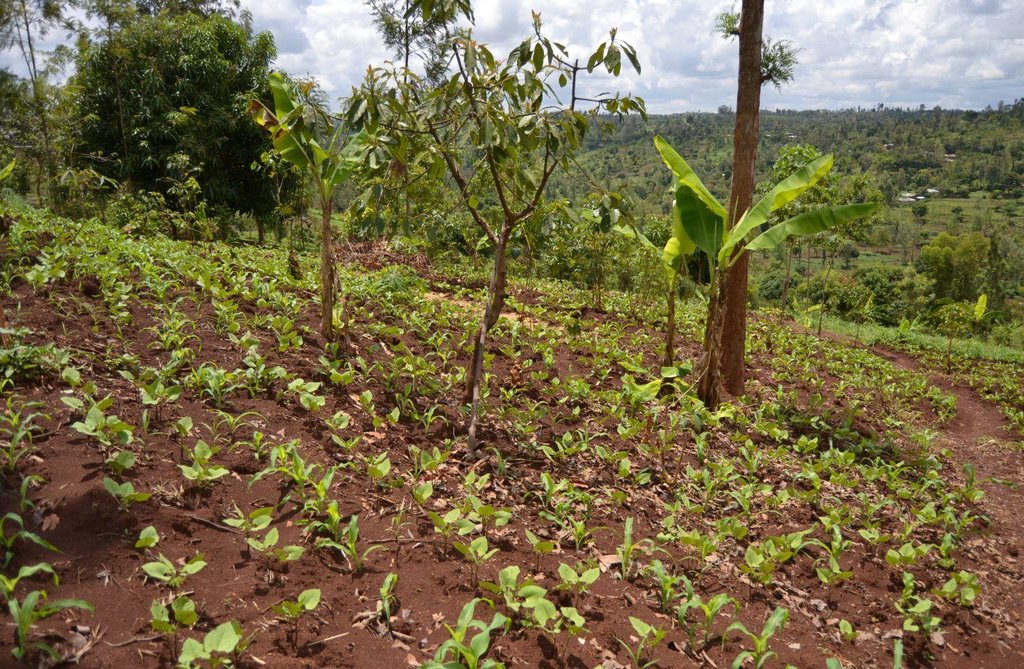
The land of the farmer is of 3 acres: 2 acres to plant maize (Zea mays) intercropped with beans (Phaseolus vulgaris) in combination with several trees species: Mangoes, Avocadoes, Bananas, Grevillea and Makadamia and half acre for coffee plantation with Bananas and half with Napier grass production for fodder (to feed cows). To increase and fasten the grass growth, manure is applied twice a year, before the rainy season (around February and September), while mulching is practiced under Banana trees every season. Minimum tillage is applied to reduce soil disturbance and to increase water use efficiency by minimizing direct evaporation, increasing infiltration and water recharge (Liniger, 1991) especially during dry seasons, which results in better crop yields.
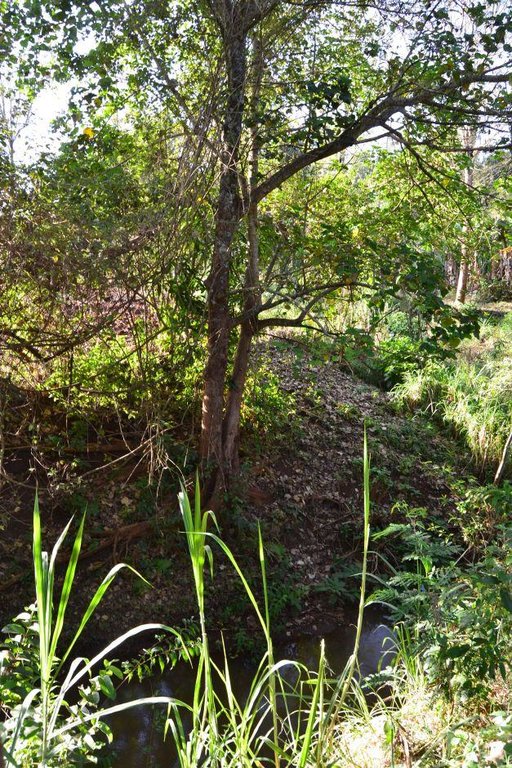
For timber production Grevillea trees are planted scattered overall the land and on the edge of the river for demarcation (environmental role in stabilizing the soil against erosive forces).
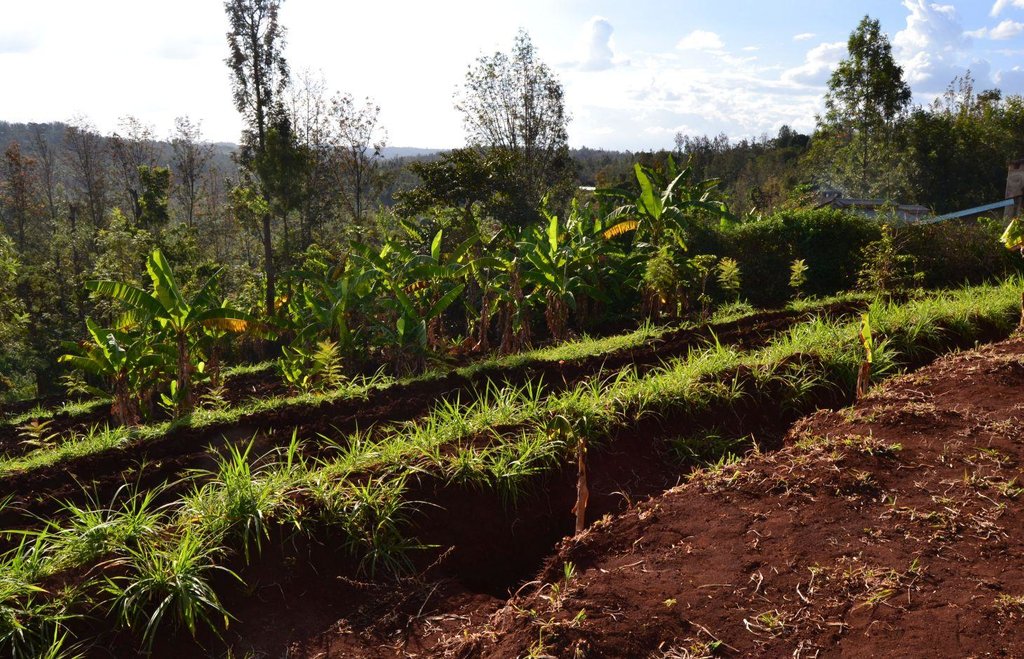
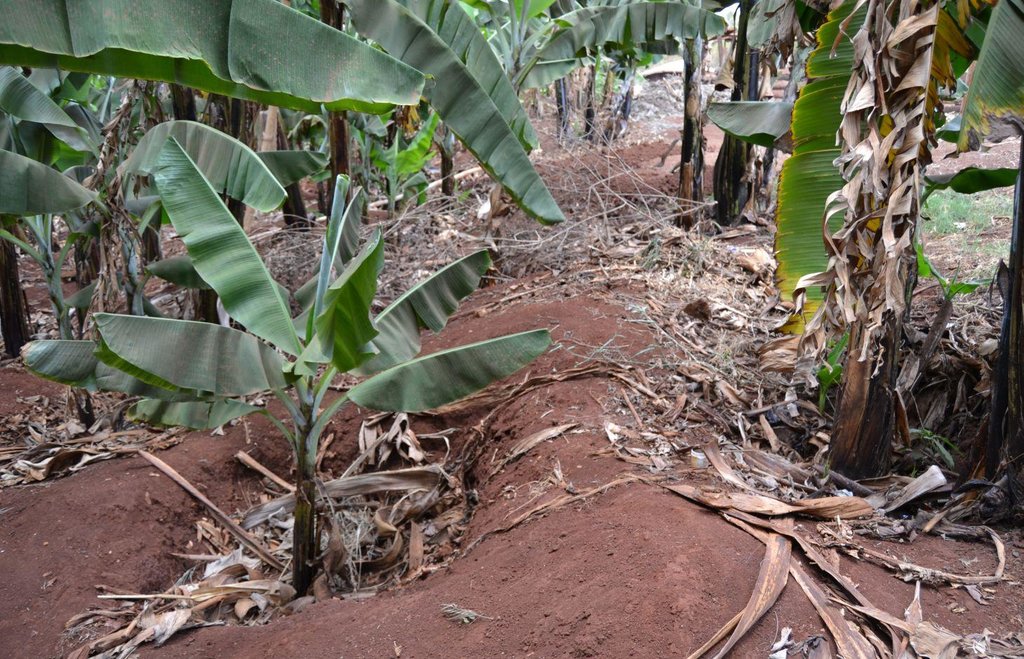
Concerning the structural measures, the farmer constructed has built 14 bench terraces, six of them were designed to plant cash crops (coffee); each terrace is characterized by a ditch to cut off the drainage and collect water and nutrients; they are also used as paths to facilitate transportation and farm operations. Ditches are both drainage and infiltration types and are excavated along the contour.
Purpose of the Technology: Beans and maize are cultivated for home consumption but partially (about 20%-4 bags of maize and half bag of beans) also for commercial purposes. Coffee is harvested twice a year, with a production of about 500 kg per season; the coffee is sold at 45 Kenyan Shillings (KSh) per kg (SL-28-arabica varieties). Indeed, the farmer is interested in cultivating the certified and improved variety called Ruiru 11 which is generally disease resistant, easy to maintain (less expensive) with a modest risk of pests (according to the farmer). Grevillea timber is sold twice a year, only trees of 1.5 feet in diameter (about 45 cm), at about 80 KSh per feet. Beside the commercial role of Grevillea, when sufficiently grown these trees lead to a reduction of the wind speed, protect the intercrops and provide mulching material to be used over banana trees. The deep roots of mature Grevillea are not in competition with the crops for soil and water, instead they enhance infiltration (Otengi, 2007). Makadamia will be used to produce cooking oil, while bananas, avocados and mangoes are fruits collected for the local markets. Napier grass is cultivated to stabilize the ditches and for fodder production.
Establishment / maintenance activities and inputs: There is a high initial input (mainly labour) needed to create ditches and terraces and for planting crops is required. The vegetative and structural measures require a labour intensive management during the year, for example maintenance is necessary after each rainy season to repair ditches and to rebuild terraces (e.g. because of the accumulation of soil and organic matter in the pits and ditches). Concerning Napier grass, labour is employed regularly for weed control, to cut grass for fodder and every three seasons to replace and replant the grass because it becomes less productive. Concerning trees, in the Agroforestry systems, canopies of Mango and Avocado trees shade the soil reducing evapotranspiration and therefore improving soil water storage. On the other hand, regular pruning is needed when the shadow effect obstructs photosynthesis and therefore growth of the crops planted below (maize and beans). Pruning of branches is carried out also for firewood. Furthermore, a common practice is Grevillea root pruning to conserve soil moisture (Otengi, 2007) and to reduce competition for nutrients during the growing season. Indeed, the farmer explained how superficial roots may interfere with the Banana root system and to cut them he has created small trenches. Harvesting is carried out twice during the year for both cereals and coffee.
Natural / human environment: The area is characterized by rolling to hilly slopes, therefore it is exposed to erosion and land degradation. The combination of trees with mixed crops is adopted to maximise productivity and at the same time to prevent degradation by increasing the vegetative cover.
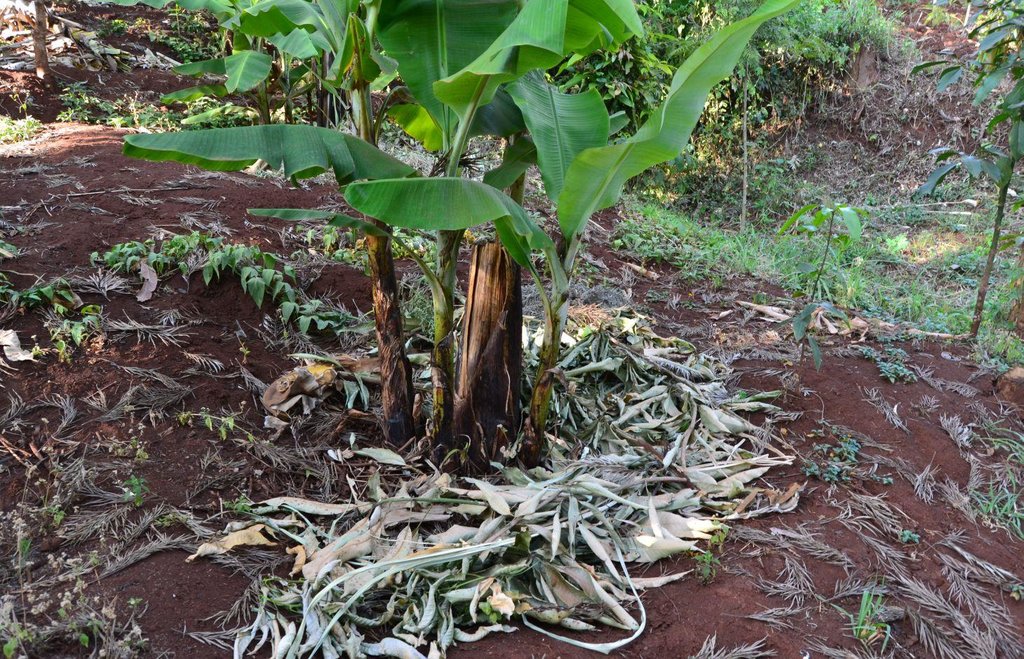
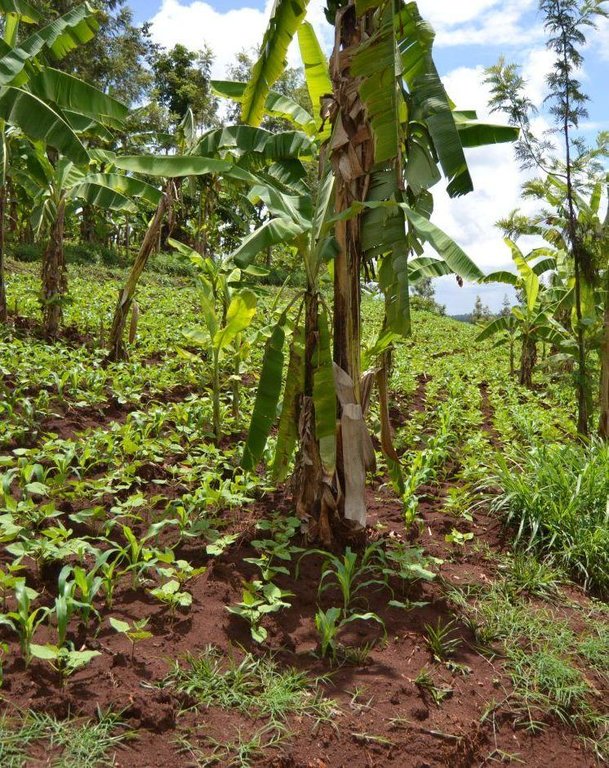
2.3 Photos of the Technology
2.5 Country/ region/ locations where the Technology has been applied and which are covered by this assessment
Country:
Kenya
Region/ State/ Province:
Kenya
Further specification of location:
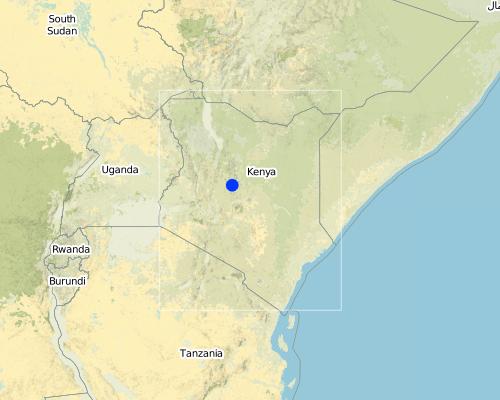
Muthithi location-Kagurumo sublocation-Gatwamikwa village
Map
×2.6 Date of implementation
If precise year is not known, indicate approximate date:
- more than 50 years ago (traditional)
2.7 Introduction of the Technology
Specify how the Technology was introduced:
- as part of a traditional system (> 50 years)
Comments (type of project, etc.):
The technology has been started by the father of the farmer about 70 years ago. His initiative has been developed and improved over time thanks also to the support of the MoA extension officers.
3. Classification of the SLM Technology
3.2 Current land use type(s) where the Technology is applied
Grazing land
Intensive grazing/ fodder production:
- Cut-and-carry/ zero grazing
Main animal species and products:
Cut-and-carry/ zero grazing: fodder for 2 cows, from Napier grass

Mixed (crops/ grazing/ trees), incl. agroforestry
- Agroforestry
Comments:
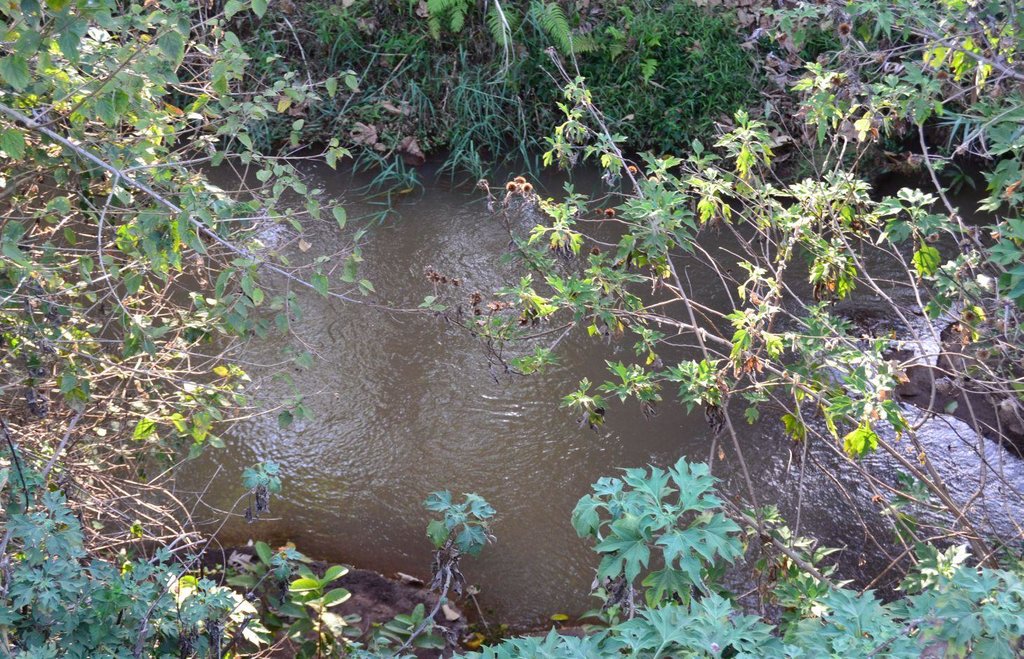
Major land use problems (compiler’s opinion): Soil erosion and nutrient leaching which could drain into the river (Fig. 17).
Major land use problems (land users’ perception): The most important limiting factor to the crop and fodder production remains water: not only related to the weather conditions (e.g. shorter and delayed rainy seasons) but due to the lack of a proper irrigation systems, to minimize the water losses and time. Furthermore, soil has been considered 'not good', because does not hold enough water due to the slope of the land.
If land use has changed due to the implementation of the Technology, indicate land use before implementation of the Technology:
Agroforestry
3.3 Further information about land use
Water supply for the land on which the Technology is applied:
- rainfed
Number of growing seasons per year:
- 2
Specify:
Longest growing period in days: 122Longest growing period from month to month: from about March to JuneSecond longest growing period in days: 61Second longest growing period from month to month: from about October to November
Livestock density (if relevant):
< 1 LU/km2
3.5 Spread of the Technology
Specify the spread of the Technology:
- evenly spread over an area
If the Technology is evenly spread over an area, indicate approximate area covered:
- < 0.1 km2 (10 ha)
Comments:
About 1.21 ha (3 acres).
The area accounts for the land owned and cultivated by the farmer. According to the interviewee from the Ministry of Agriculture, on average farmers in Saba Saba sub-catchment own 1 acre of land (Elemans, 2011).
3.6 SLM measures comprising the Technology
agronomic measures
- A1: Vegetation/ soil cover
- A2: Organic matter/ soil fertility
- A3: Soil surface treatment
vegetative measures
- V1: Tree and shrub cover
- V2: Grasses and perennial herbaceous plants
structural measures
- S1: Terraces
- S4: Level ditches, pits
Comments:
Type of agronomic measures: mulching, legume inter-planting, manure / compost / residues, minimum tillage
Type of vegetative measures: aligned: -graded strips
3.7 Main types of land degradation addressed by the Technology
soil erosion by water
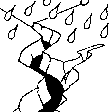
- Wt: loss of topsoil/ surface erosion
chemical soil deterioration
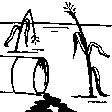
- Cn: fertility decline and reduced organic matter content (not caused by erosion)

water degradation
- Hp: decline of surface water quality
Comments:
Main causes of degradation: soil management (Poor soil management practices), deforestation / removal of natural vegetation (incl. forest fires) (Poor vegetation cover, mainly herbaceous), disturbance of water cycle (infiltration / runoff) (Land use: cropland), other natural causes (avalanches, volcanic eruptions, mud flows, highly susceptible natural resources, extreme topography, etc.) specify (From gentle to hilly slope)
Secondary causes of degradation: Heavy / extreme rainfall (intensity/amounts) (Especially during wet seasons: March-June and October-November)
3.8 Prevention, reduction, or restoration of land degradation
Specify the goal of the Technology with regard to land degradation:
- prevent land degradation
- reduce land degradation
4. Technical specifications, implementation activities, inputs, and costs
4.1 Technical drawing of the Technology
4.2 Technical specifications/ explanations of technical drawing
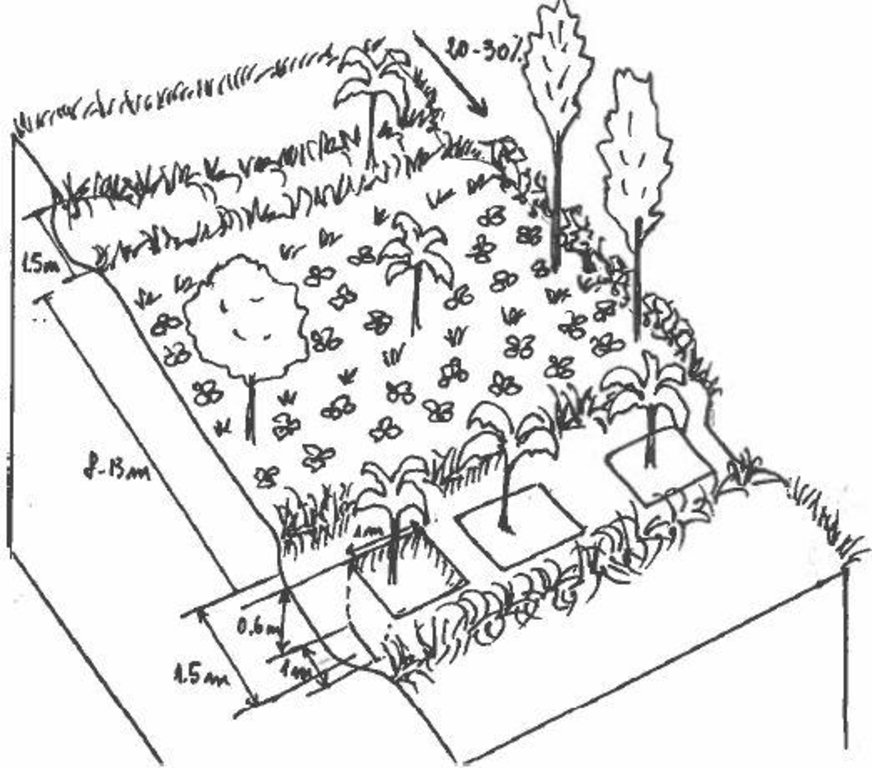
Detailed overview of the Agroforestry system in a bench terrace with infiltration (retention) and cut off (drainage) ditches. Along them, strips of Napier grass on both sides.
Location: Upper Saba saba river. Kagurumo in Muthithi location
Technical knowledge required for land users: moderate
Main technical functions: control of dispersed runoff: retain / trap, control of dispersed runoff: impede / retard, reduction of slope angle, reduction of slope length, improvement of ground cover, increase in organic matter, increase of infiltration, increase / maintain water stored in soil, water harvesting / increase water supply, sediment retention / trapping, sediment harvesting
Secondary technical functions: improvement of topsoil structure (compaction), stabilisation of soil (eg by tree roots against land slides), increase in nutrient availability (supply, recycling,…), improvement of water quality, buffering / filtering water, increase of biomass (quantity)
Mulching
Material/ species: Organic residues around Banana trees
Quantity/ density: undefined
Legume inter-planting
Quantity/ density: 3bags270kg
Manure / compost / residues
Material/ species: Manure from two cows
Quantity/ density: 8 tonnes
Remarks: for 1 year
Aligned: -graded strips
Vegetative material: G : grass
Number of plants per (ha): 400 grass per2lines strip
Vertical interval between rows / strips / blocks (m): few cm
Spacing between rows / strips / blocks (m): 1
Vertical interval within rows / strips / blocks (m): 0.4
Width within rows / strips / blocks (m): 0.6-1
Scattered / dispersed
Vegetative material: T : trees / shrubs, F : fruit trees / shrubs
Number of plants per (ha): about 80
Trees/ shrubs species: Grevillea, Coffee
Fruit trees / shrubs species: Persea americana, Musa sapientum, Mangifera indica, Macadamia tetraphylla
Grass species: Pennisetum pyramidalis (Napier grass or elephant grass)
Slope (which determines the spacing indicated above): 20-25%
If the original slope has changed as a result of the Technology, the slope today is (see figure below): 15%
Gradient along the rows / strips: 5-8%
Diversion ditch/ drainage
Vertical interval between structures (m): 1
Spacing between structures (m): 8-13
Depth of ditches/pits/dams (m): 0.6-1
Retention/infiltration ditch/pit, sediment/sand trap
Vertical interval between structures (m): 1
Spacing between structures (m): 8-13
Depth of ditches/pits/dams (m): 0.6-1
Terrace: forward sloping
Vertical interval between structures (m): 1
Spacing between structures (m): 12-15
Slope (which determines the spacing indicated above): 5-8 (moderate) (Fig.4-7Annex3)%
If the original slope has changed as a result of the Technology, the slope today is: 5%
Lateral gradient along the structure: 25-30%
4.3 General information regarding the calculation of inputs and costs
other/ national currency (specify):
Kenyan Schellings
Indicate exchange rate from USD to local currency (if relevant): 1 USD =:
85.9
Indicate average wage cost of hired labour per day:
2.00
4.4 Establishment activities
| Activity | Type of measure | Timing | |
|---|---|---|---|
| 1. | Digging holes and planting Coffee seedlings (20 KSh per plant) | Vegetative | |
| 2. | Digging holes (1 feet ×1 feet) and planting trees (seedlings)- 4 days ×5 persons at Ksh 200.e.g. the main work consist of digging small pits for bananas (300 plants) | Vegetative | |
| 3. | Establishment of the infiltration ditches and cutoff drains (total 5). 3p.d. (200 Ksh *3) each. | Structural | Each season: during dry season |
| 4. | Establishment of the retention ditches with bench terraces (tot.8): 2 p.d., 250 Ksh per day | Structural | Each season: during dry season |
4.5 Costs and inputs needed for establishment
| Specify input | Unit | Quantity | Costs per Unit | Total costs per input | % of costs borne by land users | |
|---|---|---|---|---|---|---|
| Labour | digging holes | person/day | 20.0 | 46.0 | 920.0 | 100.0 |
| Labour | infiltration ditches | person/day | 1.0 | 1277.0 | 1277.0 | 100.0 |
| Plant material | seedlings | ha | 1.0 | 116.0 | 116.0 | 100.0 |
| Other | cows | animal | 2.0 | 349.0 | 698.0 | 100.0 |
| Total costs for establishment of the Technology | 3011.0 | |||||
Comments:
Duration of establishment phase: 6 month(s)
4.6 Maintenance/ recurrent activities
| Activity | Type of measure | Timing/ frequency | |
|---|---|---|---|
| 1. | Minimum tillage and planting maize and beans | Agronomic | 2 times in a year |
| 2. | Harvesting maize/beans (around Feb/March and Ag/Sept) | Agronomic | 2 times in a year |
| 3. | Feeding cows on daily basis (normally 3 times a day): 200 Ksh is the price of 1 labour to feed the cows with lunch, for 6 days | Agronomic | daily basis |
| 4. | Preparation and application of manure | Agronomic | 2 times in a year |
| 5. | Digging planting holes and planting grass | Vegetative | 2 times (because they get 'old') or 1 half year, depending on the conditions |
| 6. | Maintenance of the grass (weed control and cutting Napier grass/repairing and collecting fodder) | Vegetative | Every season (March/Sept); cutting Napier: 2times in a season |
| 7. | Clearing the tree for selling timber (the price depends also of the use of the chainsaw (or saw) or not -(considering 4 trees at the time) - with machine operator | Vegetative | When in need of cash (not regularly), not less than 5 years after planting |
| 8. | Prepare manure and feeding cows on daily basis (normally 3 times a day): 200 Ksh is the price of 1 labour to feed the cows with lunch, for 6 days (7200 for 6 months) | Vegetative | Every season |
| 9. | Pruning branches/roots and let them dry for firewood- (considering 4 trees at the time) 3 persons days- 200Ksh | Vegetative | Every 3 seasons (and when shortage of firewood) |
| 10. | Mulching | Vegetative | Twice in the year on Bananas |
| 11. | Harvesting coffee | Vegetative | Twice in the year |
| 12. | Distribute manure on Napier grass, also in the pits | Vegetative | 2 times |
| 13. | Repairing the ditches and remove excess of soil/leaves accumulated during the rainy season | Structural | After rains (every season) |
| 14. | Rebuilt repair terraces | Structural | 3 times per year |
4.7 Costs and inputs needed for maintenance/ recurrent activities (per year)
| Specify input | Unit | Quantity | Costs per Unit | Total costs per input | % of costs borne by land users | |
|---|---|---|---|---|---|---|
| Labour | maintenance | 1.0 | 353.0 | 353.0 | 100.0 | |
| Plant material | seedlings | 1.0 | 66.0 | 66.0 | 100.0 | |
| Total costs for maintenance of the Technology | 419.0 | |||||
Comments:
Machinery/ tools: panga, fork djembe, hoes, shovel, fork djembe, panga, saw, shovels, fork djembe
The costs has been computed during the period of the field visit and include all the costs for the establishment and the maintenance of the different measures (structural, agronomic and vegetative), for 3 acre of land.
4.8 Most important factors affecting the costs
Describe the most determinate factors affecting the costs:
In the farmer's opinion, the main constrains are the costs carried out to maintain the structural measures described. Water instead become the limiting environmental factor during dry season.
5. Natural and human environment
5.1 Climate
Annual rainfall
- < 250 mm
- 251-500 mm
- 501-750 mm
- 751-1,000 mm
- 1,001-1,500 mm
- 1,501-2,000 mm
- 2,001-3,000 mm
- 3,001-4,000 mm
- > 4,000 mm
Agro-climatic zone
- sub-humid
Thermal climate class: subtropics. June, July and August
5.2 Topography
Slopes on average:
- flat (0-2%)
- gentle (3-5%)
- moderate (6-10%)
- rolling (11-15%)
- hilly (16-30%)
- steep (31-60%)
- very steep (>60%)
Landforms:
- plateau/plains
- ridges
- mountain slopes
- hill slopes
- footslopes
- valley floors
Altitudinal zone:
- 0-100 m a.s.l.
- 101-500 m a.s.l.
- 501-1,000 m a.s.l.
- 1,001-1,500 m a.s.l.
- 1,501-2,000 m a.s.l.
- 2,001-2,500 m a.s.l.
- 2,501-3,000 m a.s.l.
- 3,001-4,000 m a.s.l.
- > 4,000 m a.s.l.
5.3 Soils
Soil depth on average:
- very shallow (0-20 cm)
- shallow (21-50 cm)
- moderately deep (51-80 cm)
- deep (81-120 cm)
- very deep (> 120 cm)
Soil texture (topsoil):
- medium (loamy, silty)
Topsoil organic matter:
- low (<1%)
5.4 Water availability and quality
Ground water table:
> 50 m
Availability of surface water:
medium
Water quality (untreated):
good drinking water
5.5 Biodiversity
Species diversity:
- medium
5.6 Characteristics of land users applying the Technology
Market orientation of production system:
- subsistence (self-supply)
- mixed (subsistence/ commercial
Off-farm income:
- > 50% of all income
Relative level of wealth:
- average
Individuals or groups:
- individual/ household
Level of mechanization:
- manual work
Gender:
- women
- men
Indicate other relevant characteristics of the land users:
Population density: 10-50 persons/km2
Annual population growth: 2% - 3%
Off-farm income specification: The farmer is rich because he owns 3 acre of land and livestock, assets (electricity) which are above the average standards of the community. No family food insecure issues during all year, and he was a teacher.
5.7 Average area of land owned or leased by land users applying the Technology
- < 0.5 ha
- 0.5-1 ha
- 1-2 ha
- 2-5 ha
- 5-15 ha
- 15-50 ha
- 50-100 ha
- 100-500 ha
- 500-1,000 ha
- 1,000-10,000 ha
- > 10,000 ha
Is this considered small-, medium- or large-scale (referring to local context)?
- small-scale
5.8 Land ownership, land use rights, and water use rights
Land ownership:
- individual, not titled
Land use rights:
- individual
Water use rights:
- open access (unorganized)
Comments:
Water use rights depend on the use: open access for drinking and domestic uses.
5.9 Access to services and infrastructure
health:
- poor
- moderate
- good
education:
- poor
- moderate
- good
technical assistance:
- poor
- moderate
- good
employment (e.g. off-farm):
- poor
- moderate
- good
markets:
- poor
- moderate
- good
energy:
- poor
- moderate
- good
roads and transport:
- poor
- moderate
- good
drinking water and sanitation:
- poor
- moderate
- good
financial services:
- poor
- moderate
- good
6. Impacts and concluding statements
6.1 On-site impacts the Technology has shown
Socio-economic impacts
Production
crop production
fodder production
wood production
Income and costs
expenses on agricultural inputs
farm income
Socio-cultural impacts
food security/ self-sufficiency
situation of socially and economically disadvantaged groups
Ecological impacts
Water cycle/ runoff
surface runoff
evaporation
Soil
soil moisture
soil cover
soil loss
Biodiversity: vegetation, animals
biomass/ above ground C
6.2 Off-site impacts the Technology has shown
water availability
downstream siltation
buffering/ filtering capacity
6.3 Exposure and sensitivity of the Technology to gradual climate change and climate-related extremes/ disasters (as perceived by land users)
Gradual climate change
Gradual climate change
| Season | Type of climatic change/ extreme | How does the Technology cope with it? | |
|---|---|---|---|
| annual temperature | increase | not known |
Climate-related extremes (disasters)
Meteorological disasters
| How does the Technology cope with it? | |
|---|---|
| local rainstorm | well |
| local windstorm | well |
Climatological disasters
| How does the Technology cope with it? | |
|---|---|
| drought | not well |
Hydrological disasters
| How does the Technology cope with it? | |
|---|---|
| general (river) flood | well |
Other climate-related consequences
Other climate-related consequences
| How does the Technology cope with it? | |
|---|---|
| reduced growing period | not known |
6.4 Cost-benefit analysis
How do the benefits compare with the establishment costs (from land users’ perspective)?
Short-term returns:
slightly negative
Long-term returns:
slightly positive
How do the benefits compare with the maintenance/ recurrent costs (from land users' perspective)?
Short-term returns:
slightly positive
Long-term returns:
positive
6.5 Adoption of the Technology
Of all those who have adopted the Technology, how many have did so spontaneously, i.e. without receiving any material incentives/ payments?
- 0-10%
Comments:
1% of land user families have adopted the Technology without any external material support
There is a moderate trend towards spontaneous adoption of the Technology
6.7 Strengths/ advantages/ opportunities of the Technology
| Strengths/ advantages/ opportunities in the compiler’s or other key resource person’s view |
|---|
|
Agroforestry (dispersed trees on cropland) and intercropping: The technology is simple to adopt and provides a sustainable land management with a diversified source of income/ food supply. How can they be sustained / enhanced? Implementation could focus on the increase of species: Jaetzold et al. (1982) underlines the positive impacts of the use of biomass from Mucuna, Crotalaria, Tithonia, Calliandra and Leucanean hedges/trees for soil fertility improvements, increasing grain yields. Crop rotation and leaving crop residues on the ground could further help increasing the production. |
|
Napier grass has been used for different purposes: e.g. ditch stabilization, fodder production. How can they be sustained / enhanced? Other herbaceous vegetation could also be planted: e.g. Tithonia diversifolia (Mexican sunflower),an excellent green manure and medicinal plant. |
6.8 Weaknesses/ disadvantages/ risks of the Technology and ways of overcoming them
| Weaknesses/ disadvantages/ risks in the land user’s view | How can they be overcome? |
|---|---|
| The amount of work required to carry out all the activities is too much. |
| Weaknesses/ disadvantages/ risks in the compiler’s or other key resource person’s view | How can they be overcome? |
|---|---|
| The technologies in place require regular maintenance especially during rainy seasons. |
7. References and links
7.2 References to available publications
Title, author, year, ISBN:
Jaetzold R., and Schmidt H., 1983. Farm Management Handbook of Kenya. Natural Conditions and Farm Management Information. Vol. 2.Part B: Central Kenya.
Available from where? Costs?
http://www2.gtz.de/dokumente/bib/07-1284.pdf
Title, author, year, ISBN:
Jaetzold R., Schmidt H., Hornetz B., Shisanya C., 1982. Farm Management Handbook of Kenya. Natural Conditions and Farm Management Information. West Kenya, Subpart A2. Nyanza Province.
Available from where? Costs?
http://www2.gtz.de/dokumente/bib/07-1284.pdf
Title, author, year, ISBN:
Liniger HP (1991). Water conservation for rainfall farming in the semi-arid Footzones northwest of Mt. Kenya (Laikipia highlands). Consequence on the water balance and the soil productivity. Laikipia/Mt. Kenya PaperD-3, Nairobi, Kenya & Bern, Switzerland.
Title, author, year, ISBN:
Ouma J. O., Murithi F. M., Mwangi W., Verguijl H., Gethi M., De Groote H., 2002. Adoption of maize seed and fertilizer technologies in Embu District, Kenya. KARI, CYMMIT.
Title, author, year, ISBN:
Otengi S. B. B., Stigter C. J., Ng'anga J. K. N. H. Liniger H. P., 2007. Soil moisture and its consequences under different management in a six year old hedged agroforestry demonstration plot in semi-arid Kenya, for two successive contrasting seasons. African Journal of Agricultural Research Vol. 2(3), pp. 089-104.
Title, author, year, ISBN:
Storey P. J., 2002. The conservation and improvement of sloping land. Volume 1: Practical understanding. Chapter 5: Improving the soil management.
Links and modules
Expand all Collapse allLinks
No links
Modules
No modules


