Infiltration ditches and ponding banks [Namibia]
- Creation:
- Update:
- Compiler: Ibo Zimmermann
- Editor: –
- Reviewers: Alexandra Gavilano, Rima Mekdaschi Studer, Joana Eichenberger
Ovala
technologies_2989 - Namibia
View sections
Expand all Collapse all1. General information
1.2 Contact details of resource persons and institutions involved in the assessment and documentation of the Technology
Key resource person(s)
land user:
Kahl Uwe
Farm Middelplaats
Namibia
SLM specialist:
SLM specialist:
Pringle Hugh
Ecosystem Management Understanding
Australia
Name of project which facilitated the documentation/ evaluation of the Technology (if relevant)
Southern African Science Service Centre for climate change and Adaptive Land management (SASSCAL)Name of project which facilitated the documentation/ evaluation of the Technology (if relevant)
Book project: Guidelines to Rangeland Management in Sub-Saharan Africa (Rangeland Management)Name of the institution(s) which facilitated the documentation/ evaluation of the Technology (if relevant)
Namibia University of Science and Technology ( NUST) - NamibiaName of the institution(s) which facilitated the documentation/ evaluation of the Technology (if relevant)
German Federal Ministry of Education and Research (BMBF) - Germany1.3 Conditions regarding the use of data documented through WOCAT
The compiler and key resource person(s) accept the conditions regarding the use of data documented through WOCAT:
Ja
1.4 Declaration on sustainability of the described Technology
Is the Technology described here problematic with regard to land degradation, so that it cannot be declared a sustainable land management technology?
Nee
1.5 Reference to Questionnaire(s) on SLM Approaches (documented using WOCAT)
Arrangements to convert degraded rangeland into fruitful landscape [Namibia]
Making arrangements between a commercial farmer and agriculture students to raise the productivity of rangeland - through managing runoff to grow multipurpose trees and bushes.
- Compiler: Ibo Zimmermann
2. Description of the SLM Technology
2.1 Short description of the Technology
Definition of the Technology:
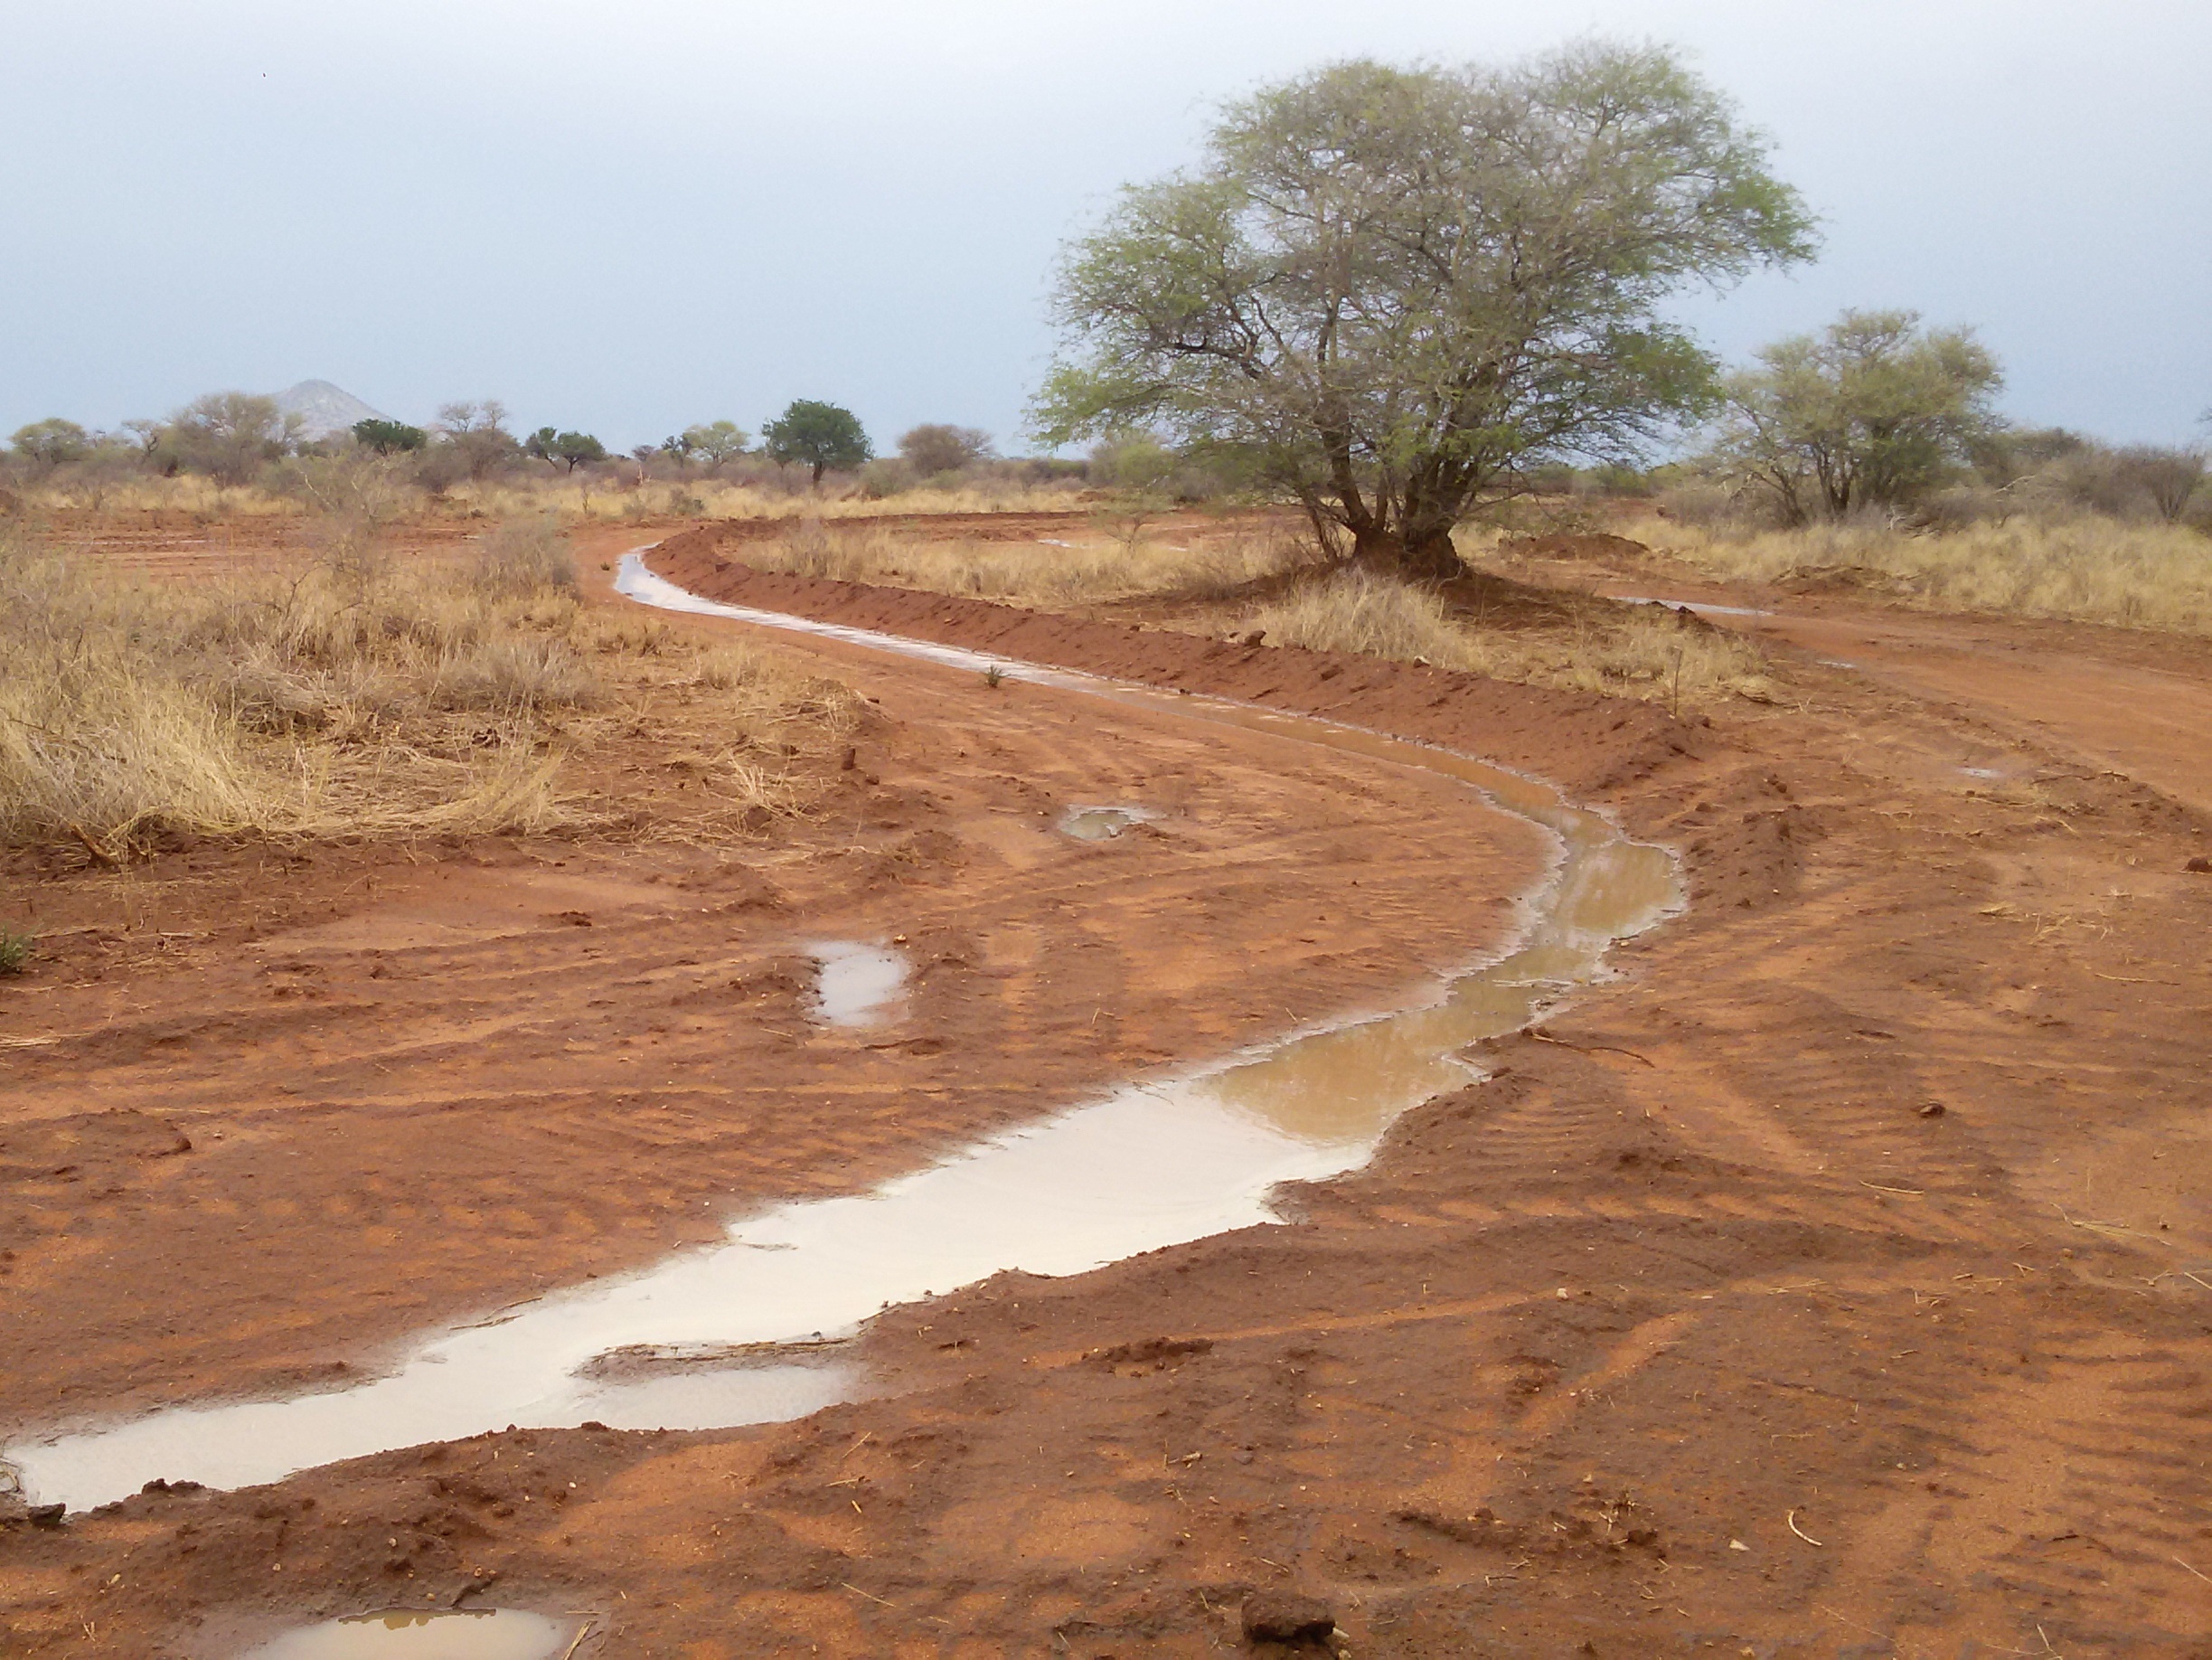
Construction of contour ditches and ponding banks/ bunds to trap rainwater for infiltration. Improved growth of plants and replenishment of groundwater is promoted, while safely discharging excess water to avoid erosion. Integrated with other technologies that treat the root causes of rangeland degradation - rather than a stand-alone technology.
2.2 Detailed description of the Technology
Description:
The technology can be applied in rangeland: (a) where rainfall runoff occurs, (b) where the soil is deep enough to dig contour ditches and construct ponding banks, (c) where there is a low slope over a wide enough area for safe discharge of overflow during intense rain, (d) where valuable plants can benefit from the extra infiltrated rainwater, (e) where the costs of earthmoving can be rapidly recovered through sale of extra production and, very importantly, (f) where the root causes of rangeland degradation have been addressed, usually through management of grazing and fires.
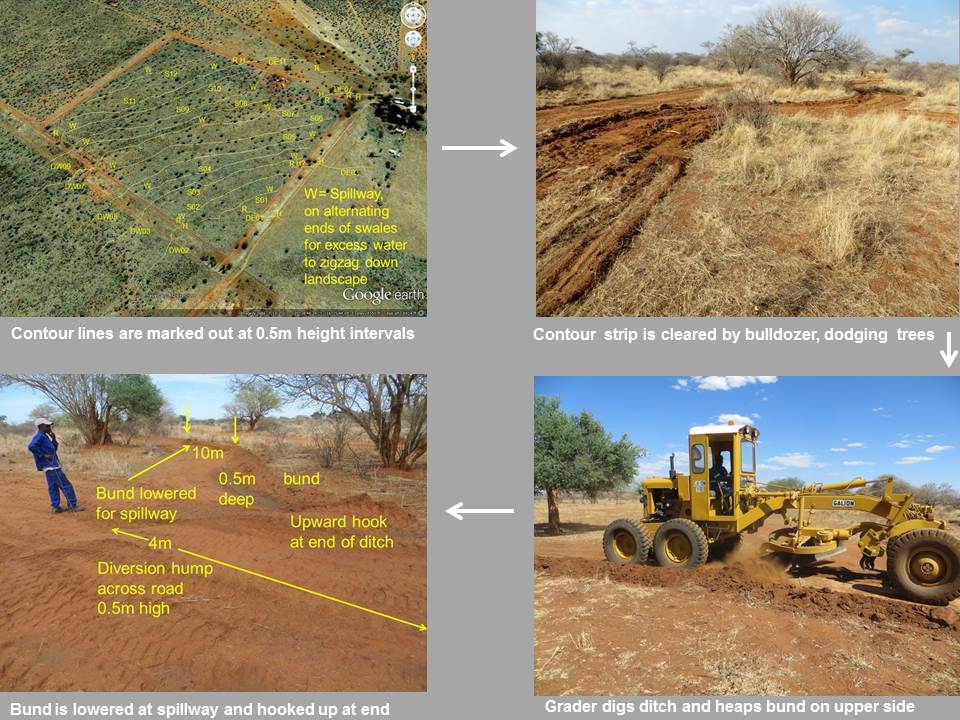
In the appropriate area, contour lines are marked out by laser or dumpy level - or mapped by drone. Where bush is dense, it may be necessary to clear narrow contour strips, leaving larger trees in place. Ditches are dug up to 50cm deep by mechanised grader or backhoe (a digger attached to a tractor), or manually by pick and spade. The soil should first ideally be ripped where the bund is formed, to ensure a firm foundation. To stabilise the bund, it should be compacted, and creeping (stoloniferous) herbaceous plants encouraged to colonise it. When ditches are full, water is discharged through spillways within the bund. These spillways are formed by lowering the bund to about half its height (i.e. 25 cm) for a distance of 10 metres. Water overtops the spillways and flows across the soil surface to the next bund in the sequence. Spillways are set near alternating ends of shorter ditches for water to zigzag its way down through the landscape, but along longer ditches the spillways are set approximately 200 metres apart. There are other configurations, including one where excess runoff flows around the end of the bund and along another channel constructed immediately below the bund. It can then spill out of this channel, evenly over the soil surface below. Where bunds meet roads or tracks, a hump is made in the road to prevent water crossing and causing damage but instead channelling the road runoff into contour ditches.
Since the channel is never exactly on the contour, water starts to flow over the lowest section. This results in self-reinforcement over time because herbaceous plants establish more densely at that point, resulting in more sediment being trapped there. To avoid spillage around each end of the ditch, the bund is shaped to form a short upslope wingwall. Organic material can be placed in the ditch, or in larger sediment traps within the ditch, to improve nutrient cycling.
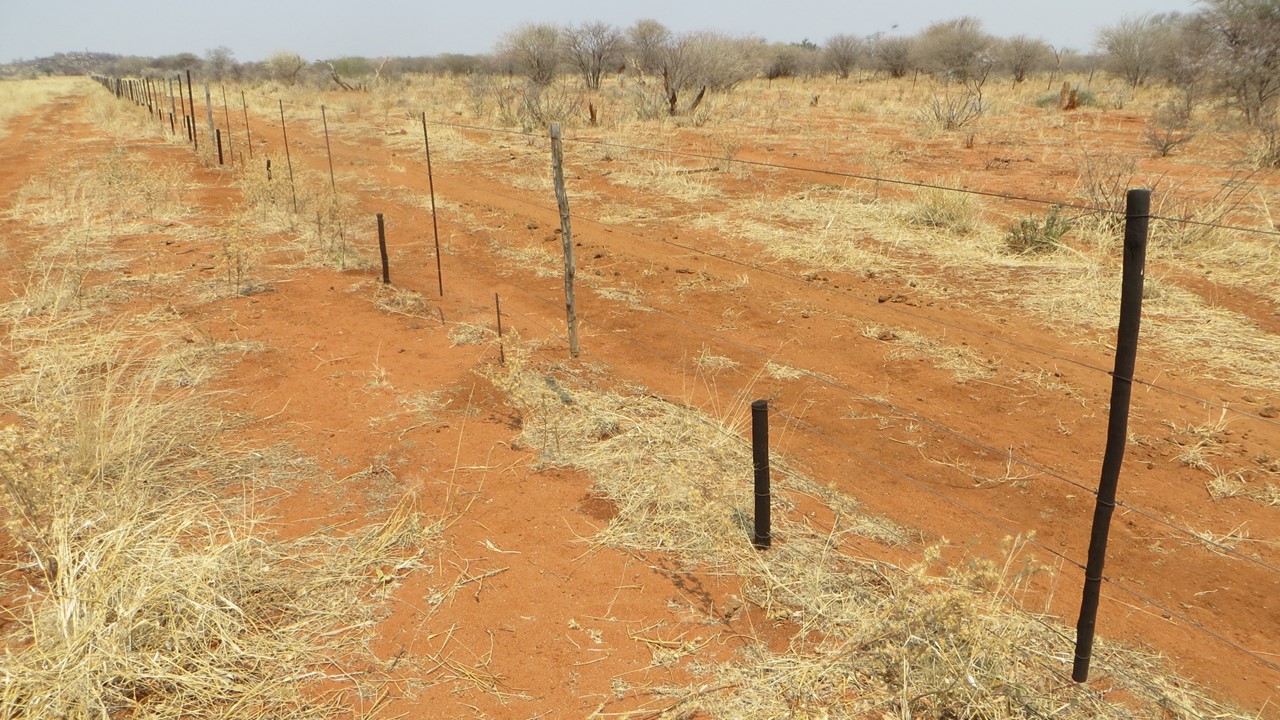
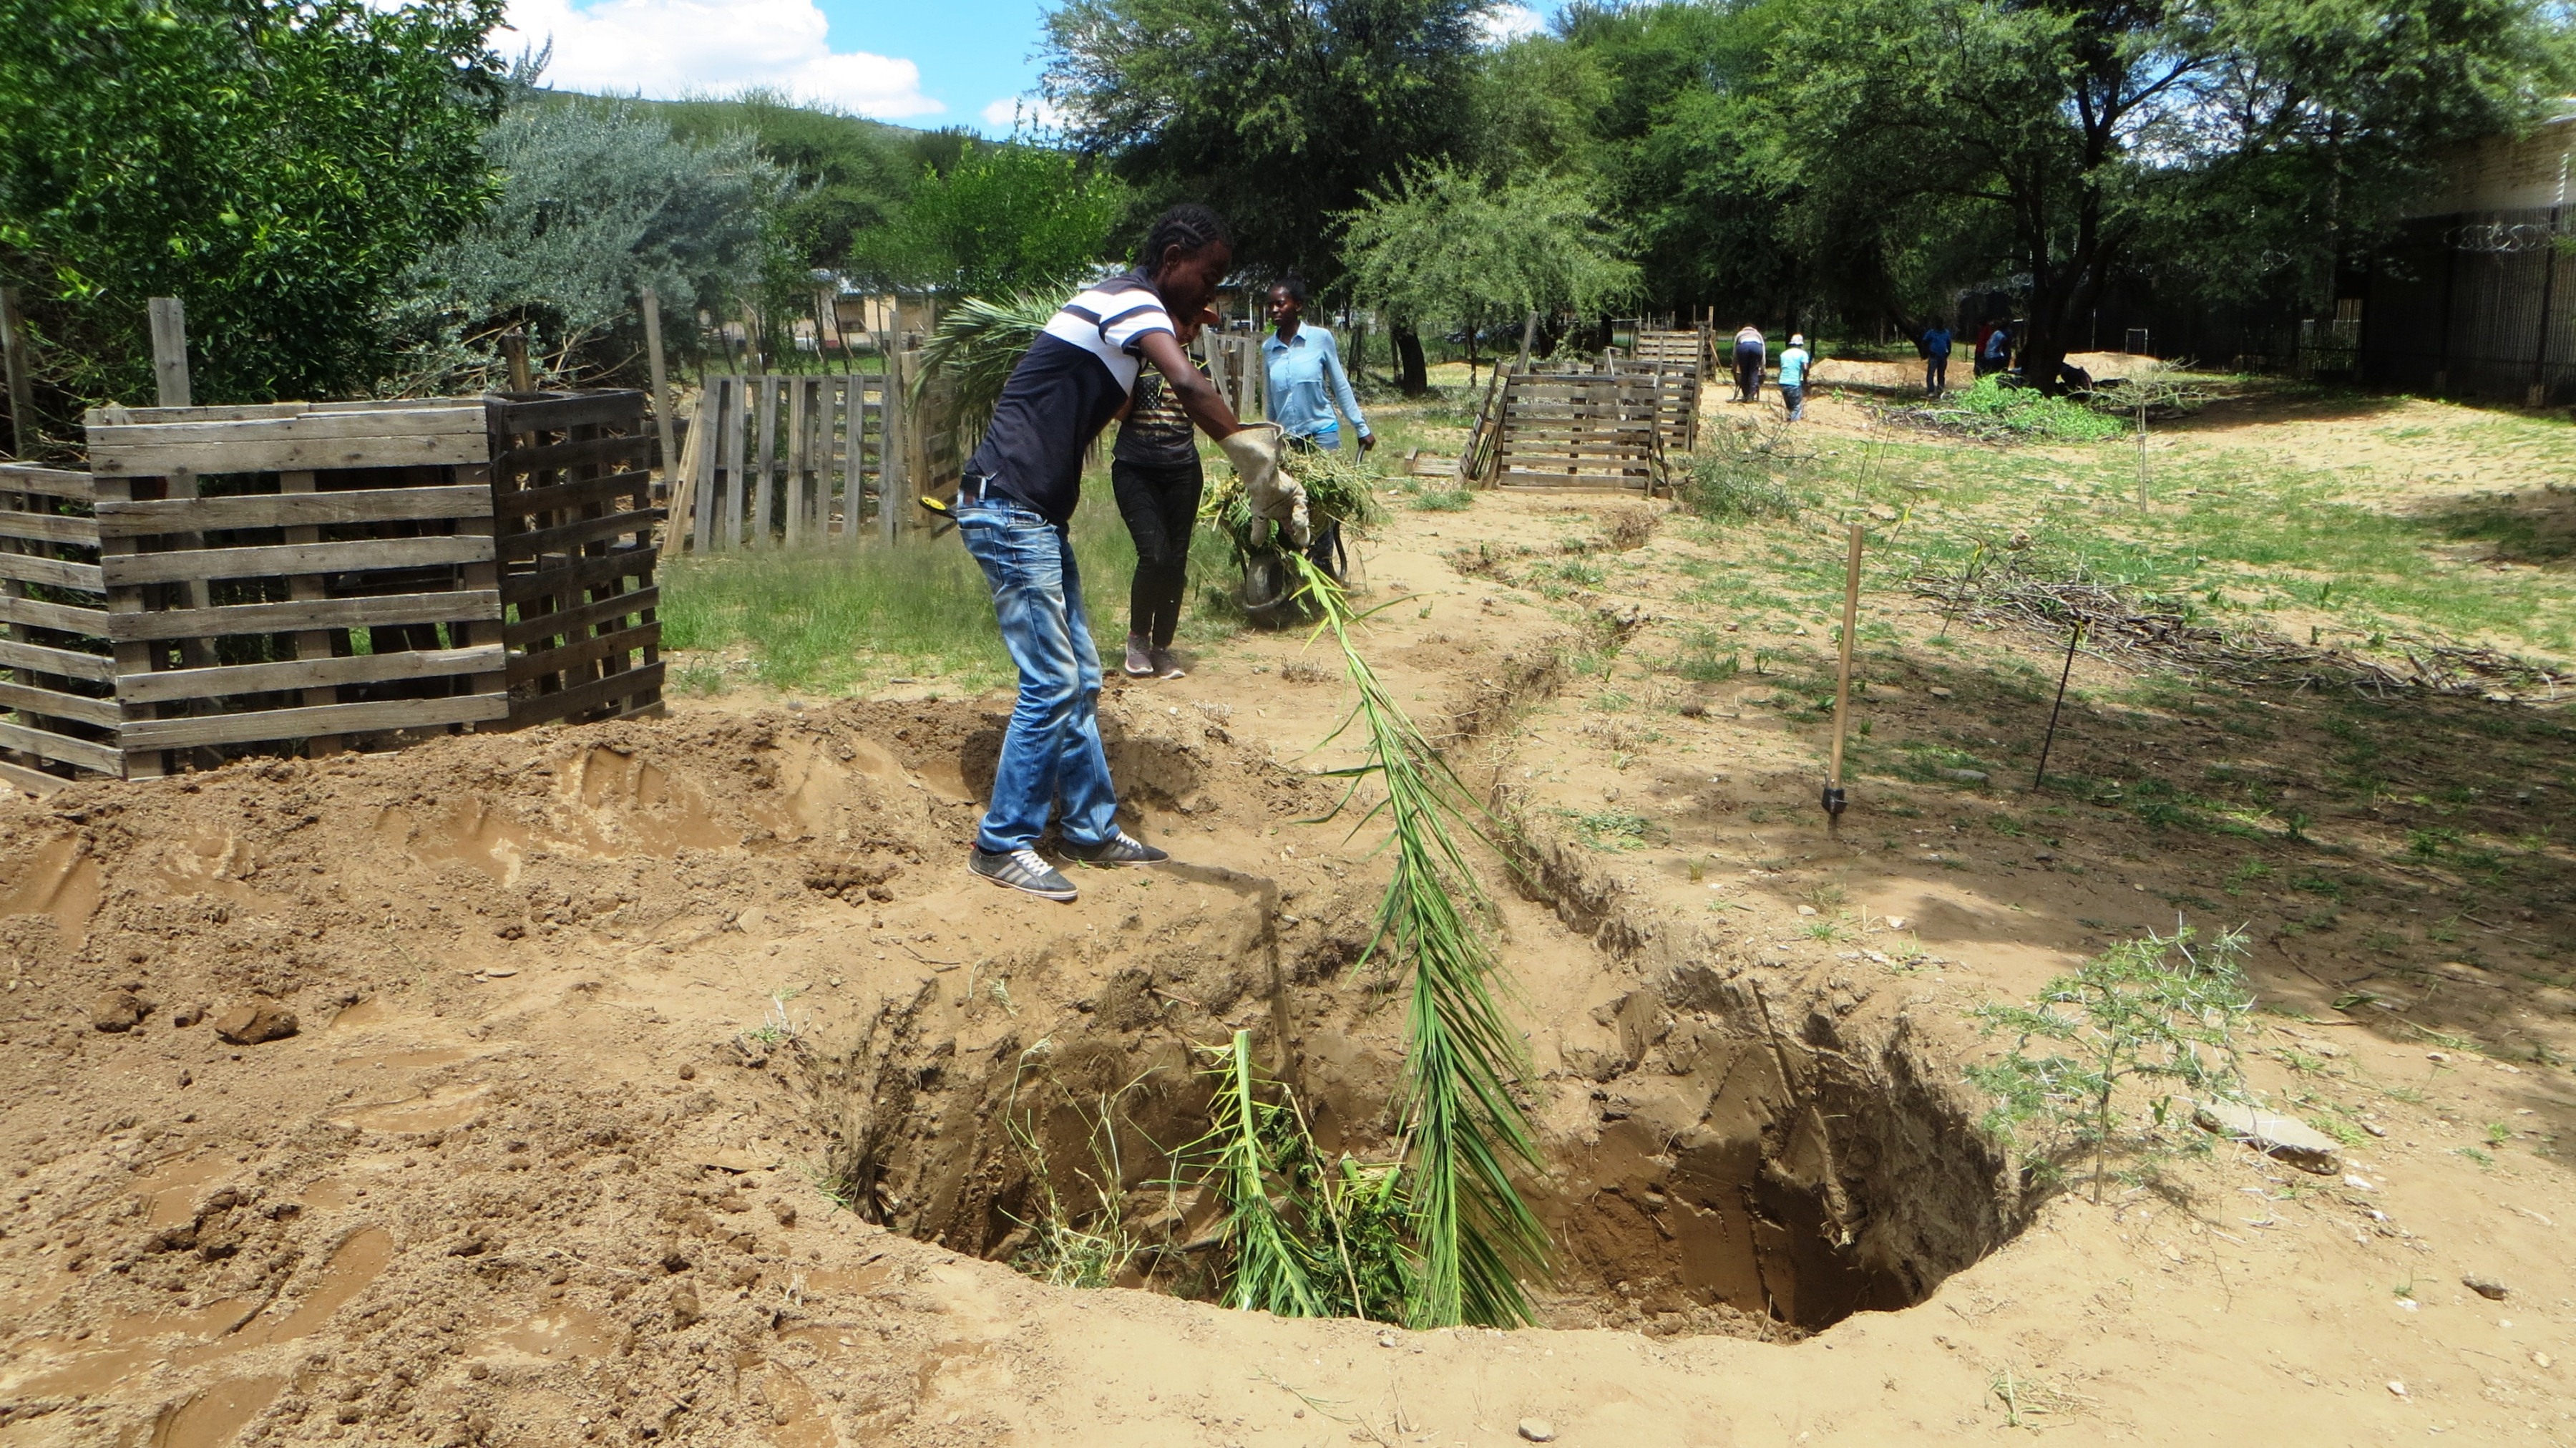
Infiltration ditches were constructed at vertical intervals of 0.5 m on a 30 ha, densely bushed portion of the Middleplaats farm. Trees were planted below the ditches to grow into a “fruitful landscape”. Species included broad canopy trees such as Faidherbia albida and Acacia erioloba, shorter thornless trees for “chop and drop” mulching, such as Peltophorum africanum and Bolusanthus speciosus, and fruit bearing trees, such as Sclerocarya birrea and Berchemia discolor, or trees with edible leaves, such as Moringa oleifera. Tree seedlings were raised in a nursery. Fencing around the 30ha had to be strengthened to protect the seedlings from oryx. It was also necessary to water the seedlings for one to two years until well established. Ponded water encourages natural growth of herbaceous plants, and to encourage this some grasses were transplanted there.
2.3 Photos of the Technology
Media Gallery


2.4 Videos of the Technology
Comments, short description:
https://www.youtube.com/watch?v=6C4V_Cib8ts
Only a short section in the film from 18m07s to 19m15s
Date:
08/04/2015
Location:
Farm Middelplaats and KAYEC campus, both in Namibia
Name of videographer:
Andrew Botelle
2.5 Country/ region/ locations where the Technology has been applied and which are covered by this assessment
Country:
Namibia
Region/ State/ Province:
Otjozondjupa and Khomas Retions
Specify the spread of the Technology:
- evenly spread over an area
If precise area is not known, indicate approximate area covered:
- 0.1-1 km2
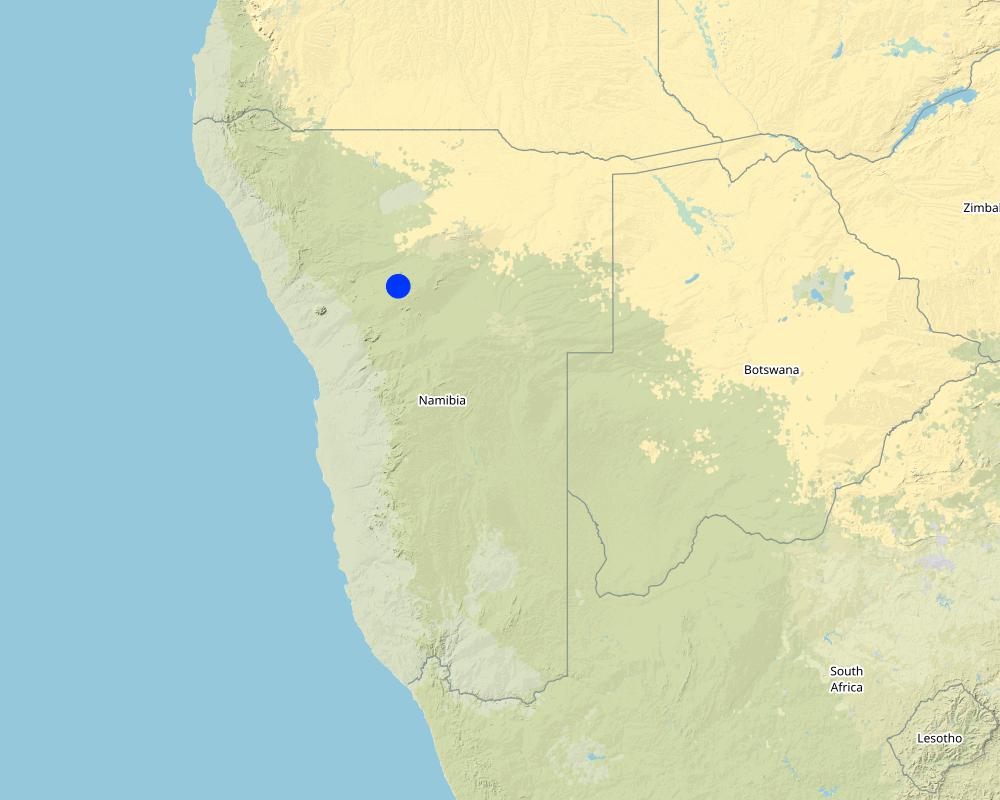
Map
×2.6 Date of implementation
Indicate year of implementation:
2014
2.7 Introduction of the Technology
Specify how the Technology was introduced:
- through projects/ external interventions
Comments (type of project, etc.):
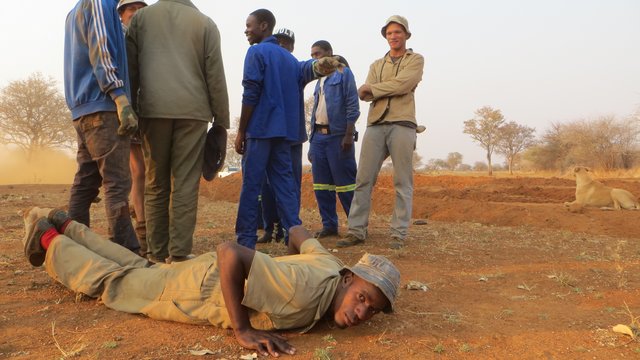
Projects involving students
3. Classification of the SLM Technology
3.1 Main purpose(s) of the Technology
- improve production
- reduce, prevent, restore land degradation
- preserve/ improve biodiversity
- create beneficial economic impact
3.2 Current land use type(s) where the Technology is applied

Grazing land
Extensive grazing:
- Ranching
Animal type:
- cattle - non-dairy beef
Comments:
Main animal species and products: Beef cattle and game animals
Number of growing seasons per year: 1
Livestock density: 10ha/LSU averaged out over time and not continuous
3.4 Water supply
Water supply for the land on which the Technology is applied:
- rainfed
Comments:
Except for Initial watering of planted tree seedlings, which was necessitated by drought
3.5 SLM group to which the Technology belongs
- agroforestry
- pastoralism and grazing land management
- water harvesting
3.6 SLM measures comprising the Technology

vegetative measures
- V1: Tree and shrub cover
- V2: Grasses and perennial herbaceous plants
- V3: Clearing of vegetation
structural measures
- S2: Bunds, banks
- S4: Level ditches, pits

management measures
- M2: Change of management/ intensity level
- M5: Control/ change of species composition
3.7 Main types of land degradation addressed by the Technology

soil erosion by water
- Wt: loss of topsoil/ surface erosion
- Wg: gully erosion/ gullying
water degradation
- Hg: change in groundwater/aquifer level
3.8 Prevention, reduction, or restoration of land degradation
Specify the goal of the Technology with regard to land degradation:
- prevent land degradation
- restore/ rehabilitate severely degraded land
4. Technical specifications, implementation activities, inputs, and costs
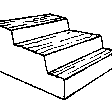
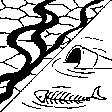
4.1 Technical drawing of the Technology
Technical specifications (related to technical drawing):
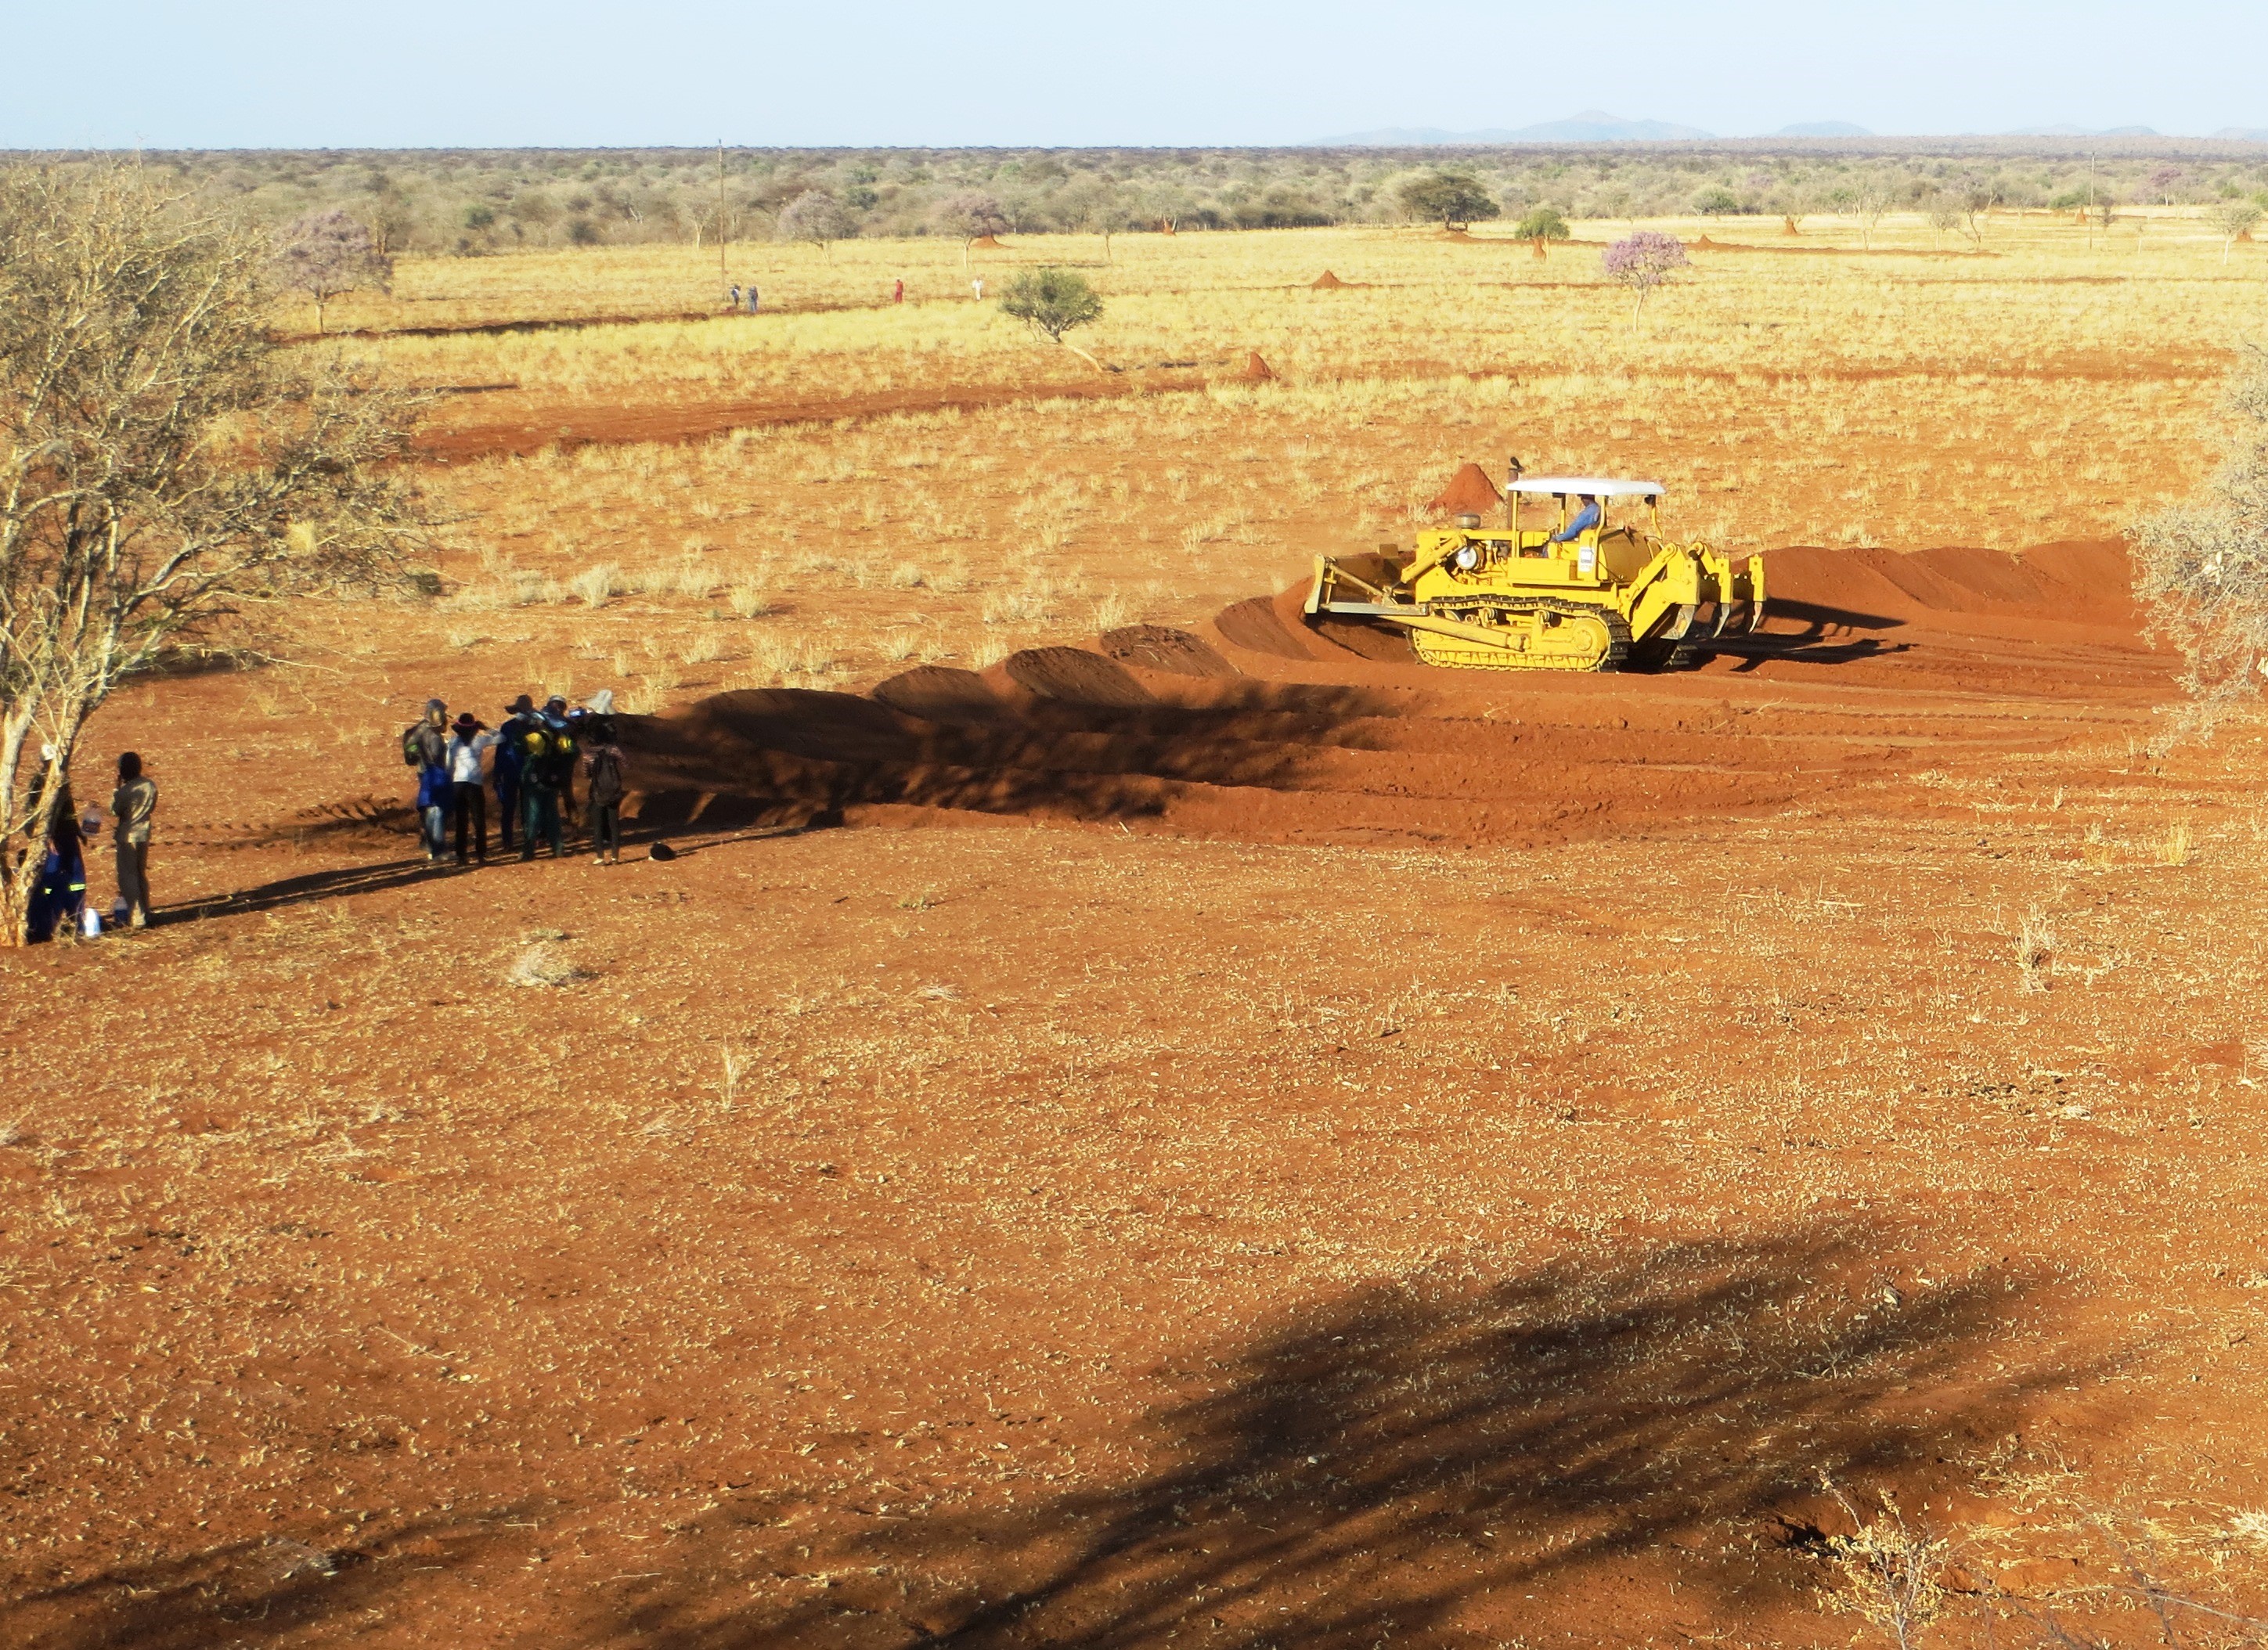
Contour strips were cleared by bulldozer at 0.5m vertical intervals on land with a gradient of approximately 1.0%. A line was ripped approximately 0.6m deep, over which soil was heaped to form a bund by a grader while excavating a ditch on its upper side to hold rainwater at a depth of approximately 0.5m. Spillways were created by lowering a 10m length of the bund. Spillways were staggered between ditches to zig-zag the spilled water slowly through the landscape. A variety of tree seedlings were planted alongside the structures to make use of the extra water, providing tall canopies, “chop-and-drop” mulching, and edible leaves or fruits.
Author:
Ibo Zimmermann
Date:
21/07/2017
4.2 General information regarding the calculation of inputs and costs
Specify how costs and inputs were calculated:
- per Technology area
Indicate size and area unit:
30ha (contour ditches only)
other/ national currency (specify):
NAD
Indicate average wage cost of hired labour per day:
72 NAD
4.3 Establishment activities
| Activity | Timing (season) | |
|---|---|---|
| 1. | Marking of contour lines | Dry season |
| 2. | Clearing of bush strips along contour | Dry season |
| 3. | Ripping along contour | Dry season |
| 4. | Digging ditch and heaping bund over ripline | Start of rains |
| 5. | Raising tree seedlings in nursery | Mostly dry season |
| 6. | Planting tree seedlings below ditches | Rainy season |
| 7. | Watering tree seedlings | Dry season |
| 8. | Strengthening fence around landscape to exclude oryx | When needed |
4.4 Costs and inputs needed for establishment
| Specify input | Unit | Quantity | Costs per Unit | Total costs per input | % of costs borne by land users | |
|---|---|---|---|---|---|---|
| Labour | Marking of contour lines | Person days | 6.0 | 72.0 | 432.0 | 100.0 |
| Labour | Raising tree seedlings in nursery | Person days | 20.0 | 72.0 | 1440.0 | 100.0 |
| Labour | Planting tree seedlings below ditches | Person days | 10.0 | 72.0 | 720.0 | 100.0 |
| Labour | Watering every 10 days in first year, except after rain | Person days | 150.0 | 72.0 | 10800.0 | 100.0 |
| Equipment | Strengthening fence to exclude oryx (Labour) | Person days | 100.0 | 72.0 | 7200.0 | 100.0 |
| Equipment | Bulldozer to clear strips and rip | Bulldozer hours | 89.0 | 850.0 | 75650.0 | 100.0 |
| Equipment | Grader to dig ditches and heap bunds | Grader hours | 35.0 | 650.0 | 22750.0 | 100.0 |
| Equipment | Diesel for bulldozer and grader | Litres | 1000.0 | 12.0 | 12000.0 | 100.0 |
| Equipment | Tractor & 7000 lt water trailer every 10 days in first year, except after rain | Tractor days | 30.0 | 1250.0 | 37500.0 | 100.0 |
| Plant material | 500 Plastic bags / seeds with soil to raise seedllngs | Filled growing bags | 500.0 | 4.0 | 2000.0 | 100.0 |
| Construction material | Fencing wire and posts to strengthen fence around fruitful landscape | km of fencing | 3.0 | 2200.0 | 6600.0 | 100.0 |
| Total costs for establishment of the Technology | 177092.0 | |||||
| Total costs for establishment of the Technology in USD | 177092.0 | |||||
4.5 Maintenance/ recurrent activities
| Activity | Timing/ frequency | |
|---|---|---|
| 1. | Maintenance of ditches and bunds by grader | Rainy season |
4.6 Costs and inputs needed for maintenance/ recurrent activities (per year)
| Specify input | Unit | Quantity | Costs per Unit | Total costs per input | % of costs borne by land users | |
|---|---|---|---|---|---|---|
| Equipment | Grader cost to maintain the swales every 3 – 4 years | Grader hours | 8.0 | 700.0 | 5600.0 | 100.0 |
| Total costs for maintenance of the Technology | 5600.0 | |||||
| Total costs for maintenance of the Technology in USD | 5600.0 | |||||
4.7 Most important factors affecting the costs
Describe the most determinate factors affecting the costs:
High cost of hiring or operating earthmoving machinery.
5. Natural and human environment
5.1 Climate
Annual rainfall
- < 250 mm
- 251-500 mm
- 501-750 mm
- 751-1,000 mm
- 1,001-1,500 mm
- 1,501-2,000 mm
- 2,001-3,000 mm
- 3,001-4,000 mm
- > 4,000 mm
Specifications/ comments on rainfall:
A single summer rainfall period over approximately four months per year
Indicate the name of the reference meteorological station considered:
Otjiwarongo
Agro-climatic zone
- semi-arid
5.2 Topography
Slopes on average:
- flat (0-2%)
- gentle (3-5%)
- moderate (6-10%)
- rolling (11-15%)
- hilly (16-30%)
- steep (31-60%)
- very steep (>60%)
Landforms:
- plateau/plains
- ridges
- mountain slopes
- hill slopes
- footslopes
- valley floors
Altitudinal zone:
- 0-100 m a.s.l.
- 101-500 m a.s.l.
- 501-1,000 m a.s.l.
- 1,001-1,500 m a.s.l.
- 1,501-2,000 m a.s.l.
- 2,001-2,500 m a.s.l.
- 2,501-3,000 m a.s.l.
- 3,001-4,000 m a.s.l.
- > 4,000 m a.s.l.
Indicate if the Technology is specifically applied in:
- not relevant
Comments and further specifications on topography:
Scattered rocky outcrops
5.3 Soils
Soil depth on average:
- very shallow (0-20 cm)
- shallow (21-50 cm)
- moderately deep (51-80 cm)
- deep (81-120 cm)
- very deep (> 120 cm)
Soil texture (topsoil):
- coarse/ light (sandy)
Soil texture (> 20 cm below surface):
- coarse/ light (sandy)
Topsoil organic matter:
- low (<1%)
If available, attach full soil description or specify the available information, e.g. soil type, soil PH/ acidity, Cation Exchange Capacity, nitrogen, salinity etc.
A calcrete layer is occasionally exposed at the soil surfacce
5.4 Water availability and quality
Ground water table:
5-50 m
Availability of surface water:
poor/ none
Water quality (untreated):
poor drinking water (treatment required)
Is water salinity a problem?
Ja
Specify:
The water is only slightly brackish
Is flooding of the area occurring?
Nee
5.5 Biodiversity
Species diversity:
- medium
Habitat diversity:
- medium
5.6 Characteristics of land users applying the Technology
Sedentary or nomadic:
- Sedentary
Market orientation of production system:
- commercial/ market
Off-farm income:
- 10-50% of all income
Relative level of wealth:
- average
Individuals or groups:
- individual/ household
Level of mechanization:
- manual work
- mechanized/ motorized
Gender:
- women
- men
Age of land users:
- middle-aged
5.7 Average area of land used by land users applying the Technology
- < 0.5 ha
- 0.5-1 ha
- 1-2 ha
- 2-5 ha
- 5-15 ha
- 15-50 ha
- 50-100 ha
- 100-500 ha
- 500-1,000 ha
- 1,000-10,000 ha
- > 10,000 ha
Is this considered small-, medium- or large-scale (referring to local context)?
- large-scale
5.8 Land ownership, land use rights, and water use rights
Land ownership:
- individual, titled
Land use rights:
- individual
Water use rights:
- individual
5.9 Access to services and infrastructure
health:
- poor
- moderate
- good
education:
- poor
- moderate
- good
technical assistance:
- poor
- moderate
- good
employment (e.g. off-farm):
- poor
- moderate
- good
markets:
- poor
- moderate
- good
energy:
- poor
- moderate
- good
roads and transport:
- poor
- moderate
- good
drinking water and sanitation:
- poor
- moderate
- good
financial services:
- poor
- moderate
- good
6. Impacts and concluding statements
6.1 On-site impacts the Technology has shown
Socio-economic impacts
Production
fodder production
Comments/ specify:
Mainly Moringa oleifera
fodder quality
Comments/ specify:
Moringa leaves
animal production
Comments/ specify:
Moringa heavily browsed
non-wood forest production
Comments/ specify:
Still saplings
product diversity
Comments/ specify:
Moringa leaves and fruits of other species could be harvested
Water availability and quality
water availability for livestock
Comments/ specify:
Livestock need less water after feeding on lush forage
Income and costs
expenses on agricultural inputs
Comments/ specify:
High initial cost of earthmoving
diversity of income sources
Comments/ specify:
Potential from Moringa
workload
Comments/ specify:
To water saplings
Socio-cultural impacts
food security/ self-sufficiency
Comments/ specify:
Nutritious Moringa leaves may be added to diets
health situation
Comments/ specify:
If nutritious Moringa leaves are eaten
SLM/ land degradation knowledge
Comments/ specify:
Learning from action research
Ecological impacts
Water cycle/ runoff
surface runoff
Comments/ specify:
Slowed, spread and infiltrated by ditches and ponds
groundwater table/ aquifer
Comments/ specify:
From improved infiltration
Soil
soil moisture
Comments/ specify:
Near ditches and banks
soil cover
Comments/ specify:
In ditches and ponds
nutrient cycling/ recharge
Comments/ specify:
Below ditches and ponds
soil organic matter/ below ground C
Comments/ specify:
Through tree and grass roots
Biodiversity: vegetation, animals
Vegetation cover
Comments/ specify:
In ditches and ponds
biomass/ above ground C
Comments/ specify:
In ditches and ponds
plant diversity
Comments/ specify:
In ditches and ponds
habitat diversity
Comments/ specify:
Along ditches and ponds
Climate and disaster risk reduction
drought impacts
Comments/ specify:
Along ditches and ponds
fire risk
Comments/ specify:
Along ditches and ponds, due to increased grass
6.2 Off-site impacts the Technology has shown
downstream flooding
Comments/ specify:
Through improved infiltration on the farm
6.3 Exposure and sensitivity of the Technology to gradual climate change and climate-related extremes/ disasters (as perceived by land users)
Gradual climate change
Gradual climate change
| Season | increase or decrease | How does the Technology cope with it? | |
|---|---|---|---|
| other gradual climate change | Increased variability in temperature and rainfall | increase | well |
Climate-related extremes (disasters)
Meteorological disasters
| How does the Technology cope with it? | |
|---|---|
| local rainstorm | well |
| local thunderstorm | well |
Climatological disasters
| How does the Technology cope with it? | |
|---|---|
| heatwave | well |
| cold wave | well |
| drought | well |
| land fire | moderately |
Hydrological disasters
| How does the Technology cope with it? | |
|---|---|
| flash flood | well |
Biological disasters
| How does the Technology cope with it? | |
|---|---|
| insect/ worm infestation | well |
Other climate-related consequences
Other climate-related consequences
| How does the Technology cope with it? | |
|---|---|
| reduced growing period | well |
6.4 Cost-benefit analysis
How do the benefits compare with the establishment costs (from land users’ perspective)?
Short-term returns:
negative
Long-term returns:
positive
How do the benefits compare with the maintenance/ recurrent costs (from land users' perspective)?
Short-term returns:
slightly negative
Long-term returns:
positive
6.5 Adoption of the Technology
- single cases/ experimental
Of all those who have adopted the Technology, how many did so spontaneously, i.e. without receiving any material incentives/ payments?
- 0-10%
6.6 Adaptation
Has the Technology been modified recently to adapt to changing conditions?
Ja
If yes, indicate to which changing conditions it was adapted:
- climatic change/ extremes
Specify adaptation of the Technology (design, material/ species, etc.):
After initial death of tree seedlings from extreme drought, the decision was taken to irrigate them until sufficiently well established.
6.7 Strengths/ advantages/ opportunities of the Technology
| Strengths/ advantages/ opportunities in the land user’s view |
|---|
| Avoids wastage of rainwater lost as runoff from the farm and puts it to good use on the farm. |
| Strengths/ advantages/ opportunities in the compiler’s or other key resource person’s view |
|---|
| Improved water and nutrient cycling, resulting in better plant growth and higher animal production. |
| Reduced erosion of soil. |
6.8 Weaknesses/ disadvantages/ risks of the Technology and ways of overcoming them
| Weaknesses/ disadvantages/ risks in the land user’s view | How can they be overcome? |
|---|---|
| Death of many tree seedlings | By irrigating tree seedlings until they are sufficiently well established which may take one or two years. |
| Weaknesses/ disadvantages/ risks in the compiler’s or other key resource person’s view | How can they be overcome? |
|---|---|
| High cost of earthmoving | Growing of high value plants to recoup costs as quickly as possible, such as Moringa and dates. |
7. References and links
7.1 Methods/ sources of information
- field visits, field surveys
- interviews with land users
When were the data compiled (in the field)?
2017
7.2 References to available publications
Title, author, year, ISBN:
Rainwater harvesting for drylands and beyond: Vol 2 – Water-harvesting earthworks, Lancaster, 0-977-246418
Available from where? Costs?
https://www.amazon.com/Rainwater-Harvesting-Drylands-Beyond-Vol/dp/0977246418 $28
7.3 Links to relevant online information
Title/ description:
Planning and managing farm roads Manual
URL:
www.sasscal.org/downloads/Planning_and_managing_farm_roads_in_Namibia.pdf
Title/ description:
Rangeland Rehydration Field Guide
URL:
https://emulandrecovery.org.au/~emulandr/files/Rangeland-Rehydration-Field-Guide.pdf
Links and modules
Expand all Collapse allLinks
Arrangements to convert degraded rangeland into fruitful landscape [Namibia]
Making arrangements between a commercial farmer and agriculture students to raise the productivity of rangeland - through managing runoff to grow multipurpose trees and bushes.
- Compiler: Ibo Zimmermann
Modules
No modules