Zero grazing [Uganda]
- Creation:
- Update:
- Compiler: Wilson Bamwerinde
- Editor: –
- Reviewers: Fabian Ottiger, Alexandra Gavilano
Okurisiza hamwe
technologies_1188 - Uganda
View sections
Expand all Collapse all1. General information
1.2 Contact details of resource persons and institutions involved in the assessment and documentation of the Technology
SLM specialist:
SLM specialist:
SLM specialist:
Name of project which facilitated the documentation/ evaluation of the Technology (if relevant)
The Transboundary Agro-ecosystem Management Project for the Kagera River Basin (GEF-FAO / Kagera TAMP )Name of the institution(s) which facilitated the documentation/ evaluation of the Technology (if relevant)
Food and Agriculture Organization of the United Nations (FAO) - ItalyName of the institution(s) which facilitated the documentation/ evaluation of the Technology (if relevant)
Ministry of Agriculture, Animal Industry, and Fisheries of Uganda (MAAIF) - Uganda1.3 Conditions regarding the use of data documented through WOCAT
The compiler and key resource person(s) accept the conditions regarding the use of data documented through WOCAT:
Ja
2. Description of the SLM Technology
2.1 Short description of the Technology
Definition of the Technology:
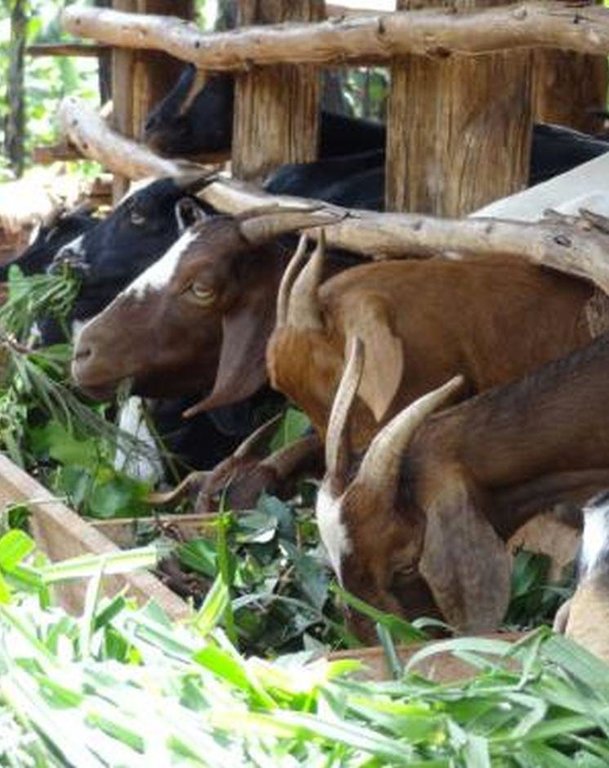
Stall-fed livestock production is an efficient method to produce organic fertilizers (manure) for the conservation and improvement of soil fertility.
2.2 Detailed description of the Technology
Description:
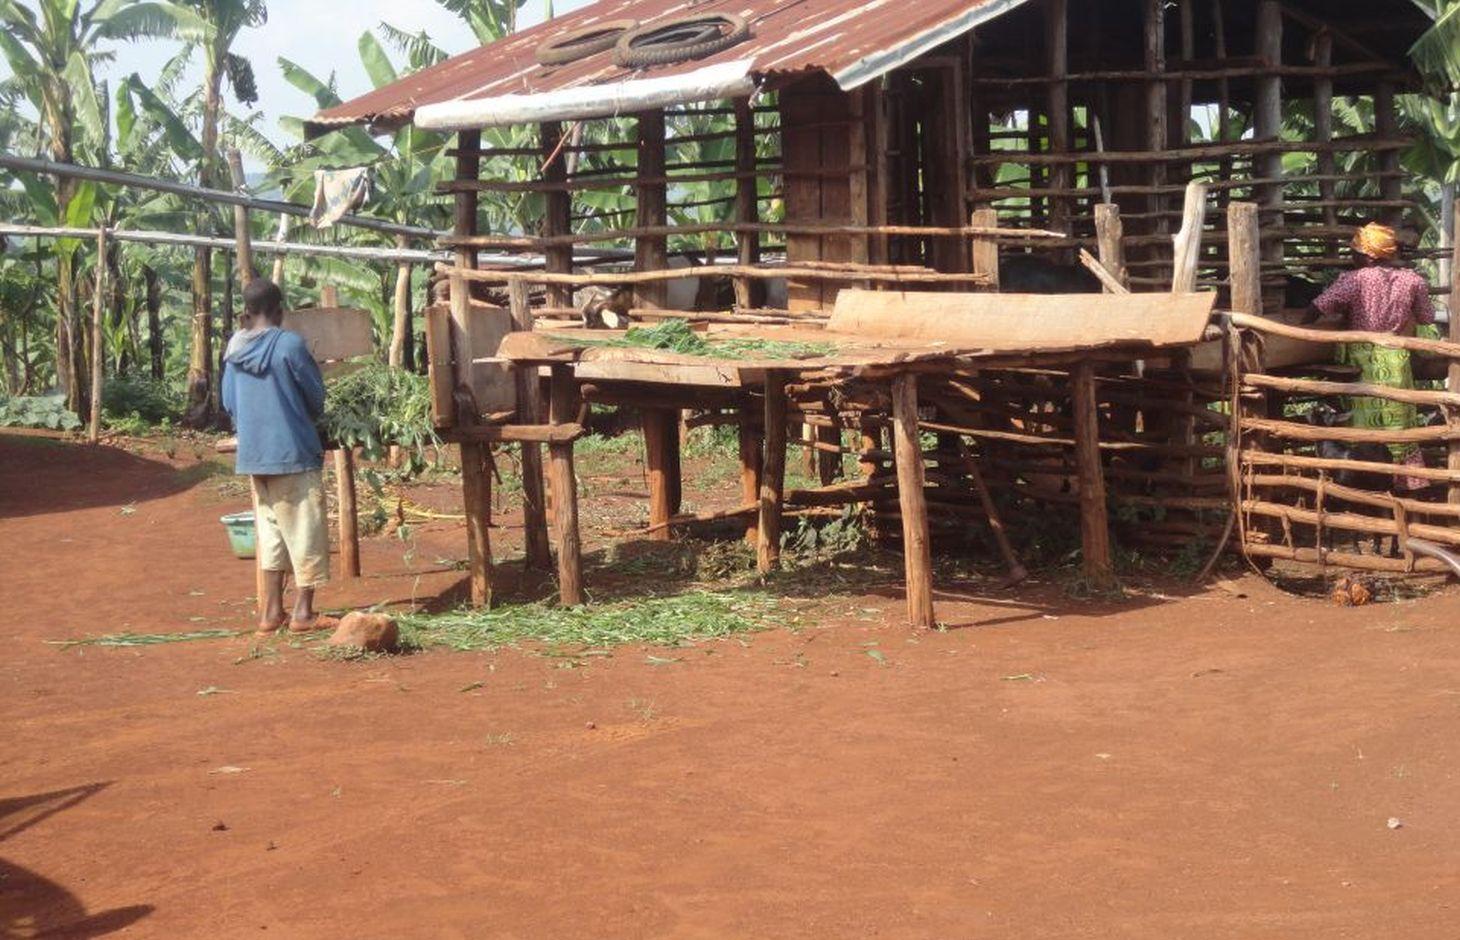
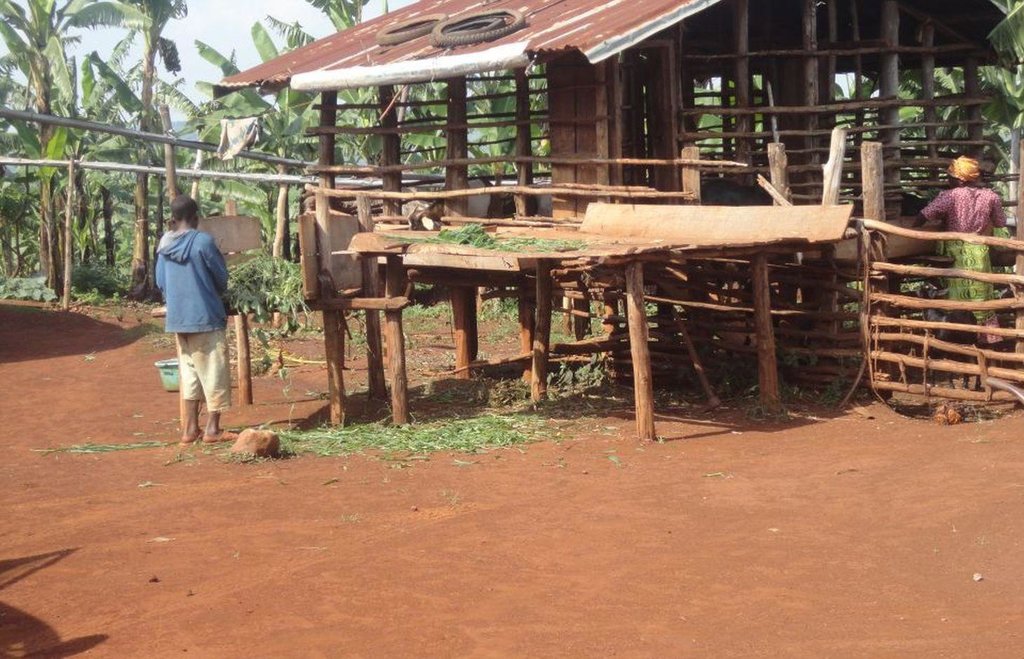
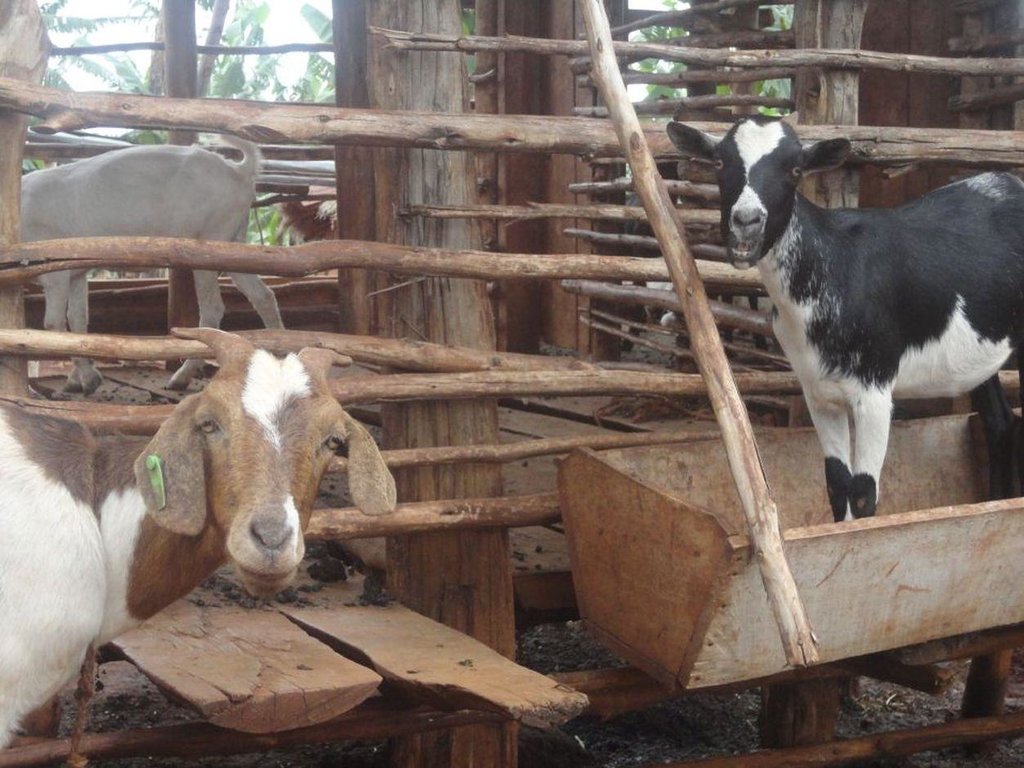
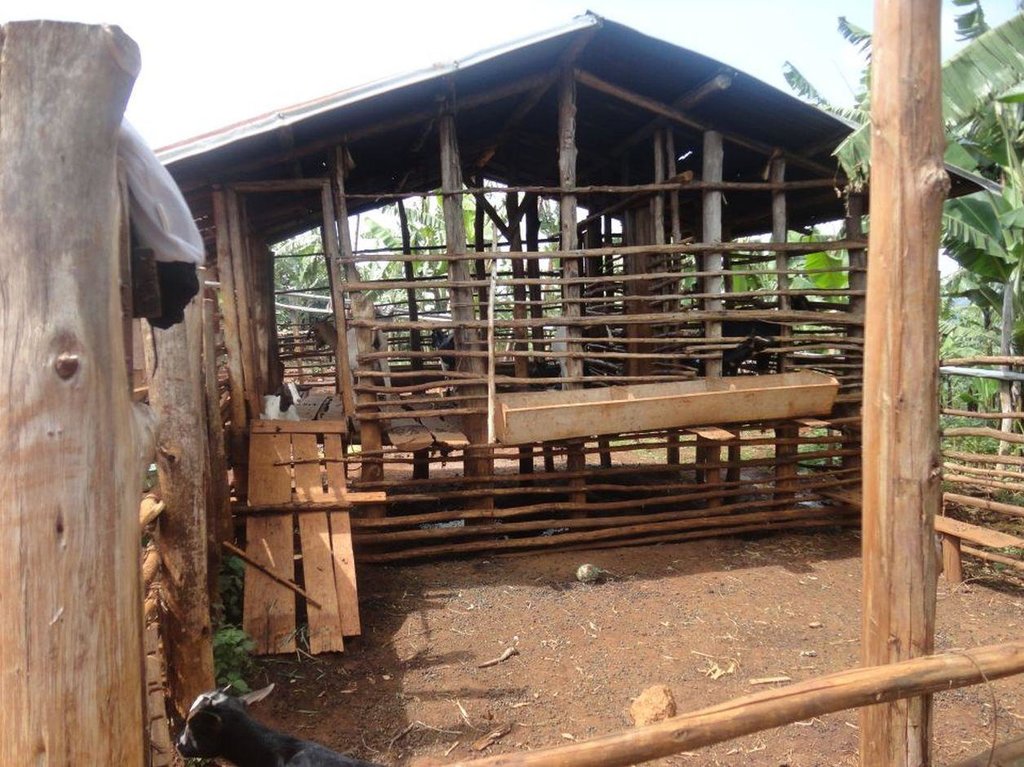
Zero-grazing has been a common livestock (cattle and pigs) management practice in most areas of south-western Uganda due to reduced communal grazing land. In the predominantly annual cropping system communities, free grazing livestock often damage crops and are a major cause of conflict. On the other hand, farmers observe that crop yields have declined season after season. For example, the bunch of bananas has grown smaller, it has smaller fingers, and many banana stands have no fruit during much of the year. The most important ways through which croplands in Rubagano are degraded include nutrient transfer through harvest and crop residue movement and use; nutrient mining whereby continuous cultivation is done with little or no replenishment; and soil and water runoff on steep slopes. Farmers know that one of the most important ways to reverse declining soil fertility is to apply manure, but it is expensive. Therefore farmers acquired goats or pigs primarily for the provision of manure for their cropland, but also as a household income generating enterprise. In stall-fed goat or pig production, The zero-grazing unit is designed in such a way that it is well ventilated and protected from wind, rain and constant direct sunshine to avoid livestock developing coughs, colds and stress. The unit has 3 major parts: the feeding and rest area, the exercise area and the manure collection area. The feeding/rest area is raised 1 m above the ground. Below it is the manure collection area and above it, a corrugated iron roof. There is a feeding vat on each side of the feeding/rest area in which mixed fodder is fed to the livestock. A wooden food preparation slab for cutting and mixing fodder is in front of the feeding/rest area. The unit for housing 12 goats is 4 m by 8 m on the ground and 3 m high at the feeding area.
Purpose of the Technology: The major objective of stall-feeding is to maximize manure collection for sustaining soil fertility in cropland. Other goals are to improve household income, reduce expenditure on pests and disease management through livestock isolation from other animals and to reduce labor by cutting and storing fodder for use over a period instead of grazing in distant pastures daily.
Establishment / maintenance activities and inputs: The materials required for establishment of the zero-grazing unit for goats are wooden posts or poles, cut-off planks, wooden slats/timber, iron sheets and nails. The 4 m by 4 m feeding/rest area is raised 1 m above the ground on strong Eucalyptus or pine posts of diameter 5-10 cm. Its wall is 2 m high and is made of widely spaced cut-off planks or light wooden poles not more than 3 cm diameter nailed to strong upright posts. The floor is made of wooden slats placed 2 cm apart, big enough to allow livestock droppings to fall through but too small for adult goats’ or kids’ hooves pass, in order to avoid injury to livestock. There is a 1.5 m by 0.5 m feeding vat on each side of the feeding/rest area and a 1 m by 1 m fodder mixing wooden slab at the front. On the ground to one side of the feeding/rest area is the 4m by 4m exercise area. The unit can be constructed at any time of the year.
Natural / human environment: Regular maintenance of the unit is done to ensure the floor does not develop holes that can lead to injury of the livestock, and the roof does not leak when it rains. Increased manure collection and application increases crop yields and supports crop diversification.
2.3 Photos of the Technology
2.5 Country/ region/ locations where the Technology has been applied and which are covered by this assessment
Country:
Uganda
Region/ State/ Province:
Uganda
Further specification of location:
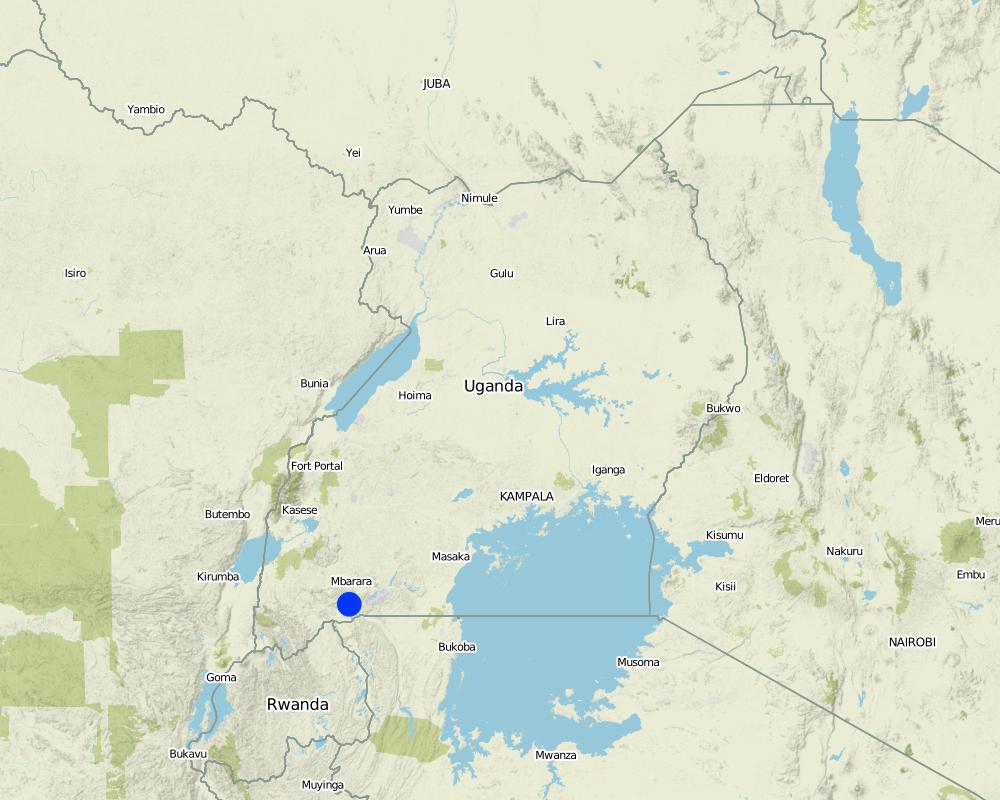
Mbarara District
Comments:
Boundary points of the Technology area: -0.86313 30.62564; -0.86314 30.62561; -0.86316 30.62569; -0.86319 30.62567
Total area covered by the SLM Technology is 0.002 km2.
There are 20 zero grazing units (goats and pigs) in the area and with a total area of about 2 hectares. The technology is being adopted slowly throughout the community.
Map
×2.6 Date of implementation
If precise year is not known, indicate approximate date:
- less than 10 years ago (recently)
2.7 Introduction of the Technology
Specify how the Technology was introduced:
- through projects/ external interventions
Comments (type of project, etc.):
This technology was introduced in 2008 by NAADS and later by Africa2000 with aim to improve manure and compost production in Kagera region. Recently, Kagera TAMP project provided additional support to introduce exotic breeds of the goats and increase livestock productivity.
3. Classification of the SLM Technology
3.1 Main purpose(s) of the Technology
- reduce, prevent, restore land degradation
- conserve ecosystem
3.2 Current land use type(s) where the Technology is applied

Cropland
- Annual cropping
- Perennial (non-woody) cropping
Annual cropping - Specify crops:
- legumes and pulses - beans
- root/tuber crops - potatoes
Perennial (non-woody) cropping - Specify crops:
- banana/plantain/abaca
Number of growing seasons per year:
- 2
Specify:
Longest growing period in days: 120 Longest growing period from month to month: February to May Second longest growing period in days: 90 Second longest growing period from month to month: September to November
Grazing land
Intensive grazing/ fodder production:
- Cut-and-carry/ zero grazing
Animal type:
- cattle - dairy
- goats
- pigs
Comments:
Major land use problems (compiler’s opinion): Reduction of soil organic matter content
Major land use problems (land users’ perception): Decline of soil fertility and decreased crop yields
Cut-and-carry/ zero grazing: Yes
Future (final) land use (after implementation of SLM Technology): Grazing land: Gi: Intensive grazing/ fodder production
Type of cropping system and major crops comments: other crops like peas, millet, maize and sorghum are also grown.
Livestock is grazing on crop residues
3.3 Has land use changed due to the implementation of the Technology?
Land use mixed within the same land unit:
Ja
Specify mixed land use (crops/ grazing/ trees):
- Agro-pastoralism (incl. integrated crop-livestock)

Grazing land
Comments:
Extensive grazing land
3.4 Water supply
Water supply for the land on which the Technology is applied:
- rainfed
3.5 SLM group to which the Technology belongs
- pastoralism and grazing land management
- integrated crop-livestock management
3.6 SLM measures comprising the Technology
agronomic measures
- A2: Organic matter/ soil fertility
vegetative measures
- V2: Grasses and perennial herbaceous plants
management measures
- M2: Change of management/ intensity level
Comments:
Main measures: agronomic measures, vegetative measures, management measures
Type of agronomic measures: manure / compost / residues
Type of vegetative measures: aligned: -linear
3.7 Main types of land degradation addressed by the Technology
chemical soil deterioration
- Cn: fertility decline and reduced organic matter content (not caused by erosion)

biological degradation
- Bc: reduction of vegetation cover
Comments:
Main type of degradation addressed: Cn: fertility decline and reduced organic matter content, Bc: reduction of vegetation cover
Main causes of degradation: soil management (Poor methods of cultivation), crop management (annual, perennial, tree/shrub) (Poor agronomic practices), over-exploitation of vegetation for domestic use (Vegetation destroyed for domestic use (firewood and thatch).)
Secondary causes of degradation: education, access to knowledge and support services
3.8 Prevention, reduction, or restoration of land degradation
Specify the goal of the Technology with regard to land degradation:
- prevent land degradation
- reduce land degradation
Comments:
Main goals: mitigation / reduction of land degradation
Secondary goals: prevention of land degradation
4. Technical specifications, implementation activities, inputs, and costs
4.1 Technical drawing of the Technology
Technical specifications (related to technical drawing):
Details of zero grazing shed structure : A. Overview of the livestock shed with manure colelction area (below) B. View on the feeding arrangement with the fodder vats abouve ground level C. Deatils of the fodder vat D. Overview of the fodder preparation structures
Location: Rubagano, Mwizi, Mbarara District. Uganda
Date: 29-DEC-2013
Technical knowledge required for field staff / advisors: moderate (Comprehensive knowledge on shed construction (e.g. planning, design of shed levels) and livestock management (fodder quality, feeding, diseases))
Technical knowledge required for land users: moderate (Comprehensive knowledge on shed construction (e.g. planning, design of shed levels) and livestock management (fodder quality, feeding, diseases))
Main technical functions: improvement of ground cover, increase in organic matter, increase in nutrient availability (supply, recycling,…)
Secondary technical functions: improvement of surface structure (crusting, sealing), promotion of vegetation species and varieties (quality, eg palatable fodder)
Manure / compost / residues
Material/ species: Manure (Pigs or goats)
Aligned: -linear
Vegetative material: G : grass
Number of plants per (ha): 900
Vertical interval between rows / strips / blocks (m): 3
Spacing between rows / strips / blocks (m): 3
Grass species: Pennisetum purpereum (napier grass), Calliandra Spp.)
Slope (which determines the spacing indicated above): 25-30%
Change of land use type: Mixed crop and livestock husbandry
Change of land use practices / intensity level: Planting fodder in addition to traditional annual and perennial crops
Author:
Byonabye Proscovia, Kagera TAMP, Kabala
4.2 General information regarding the calculation of inputs and costs
other/ national currency (specify):
UGX
If relevant, indicate exchange rate from USD to local currency (e.g. 1 USD = 79.9 Brazilian Real): 1 USD =:
2600.0
Indicate average wage cost of hired labour per day:
3.85
4.3 Establishment activities
| Activity | Timing (season) | |
|---|---|---|
| 1. | Purchase of tools | Wet season |
| 2. | Purchase of construction materials | |
| 3. | Construction of zero grazing shed ( including vats and manura collecion area) | |
| 4. | Purchase of livestock | |
| 5. | Grass seed procurement and sowing | Wet season |
| 6. | Converting part of the cropland (annual and perrenial crops) into fodder production |
4.4 Costs and inputs needed for establishment
| Specify input | Unit | Quantity | Costs per Unit | Total costs per input | % of costs borne by land users | |
|---|---|---|---|---|---|---|
| Labour | Construction of zero grazing shed ( including vats and manura collecion area) | ha | 1.0 | 115.4 | 115.4 | 100.0 |
| Equipment | Tools | Set | 1.0 | 115.4 | 115.4 | 100.0 |
| Construction material | Tree poles,nails,sorghum stalk | ha | 1.0 | 38.46 | 38.46 | 100.0 |
| Construction material | Corrugated iron sheets | ha | 1.0 | 250.0 | 250.0 | 100.0 |
| Other | Livestock (3 Does) | ha | 1.0 | 173.1 | 173.1 | 100.0 |
| Total costs for establishment of the Technology | 692.36 | |||||
| Total costs for establishment of the Technology in USD | 0.27 | |||||
Comments:
Duration of establishment phase: 6 month(s)
Lifespan of:
Tools - 1 year
Construction material - 10 years
Zero grazing shed - 1 year
Livestock - 20 years
4.5 Maintenance/ recurrent activities
| Activity | Timing/ frequency | |
|---|---|---|
| 1. | Cutting and carrying and application of fodder | Daily |
| 2. | Collection, composting and application of manure | Daily |
| 3. | Purchase of tools and materials for reconstruction/repairs of the shed structure | annual |
| 4. | Weeding and gapping | Seasonal |
4.6 Costs and inputs needed for maintenance/ recurrent activities (per year)
| Specify input | Unit | Quantity | Costs per Unit | Total costs per input | % of costs borne by land users | |
|---|---|---|---|---|---|---|
| Labour | Labour | ha | 1.0 | 38.46 | 38.46 | |
| Equipment | Tools | ha | 1.0 | 11.54 | 11.54 | 100.0 |
| Construction material | Tree poles,nails,sorghum stalk | ha | 1.0 | 3.85 | 3.85 | 100.0 |
| Construction material | Corrugated iron sheets | ha | 1.0 | |||
| Other | Livestock (3 Does) | ha | 1.0 | 18.0 | 18.0 | 100.0 |
| Total costs for maintenance of the Technology | 71.85 | |||||
| Total costs for maintenance of the Technology in USD | 0.03 | |||||
Comments:
Machinery/ tools: Panga, hoe, tree poles nails, soka jembe, spade, and wheel barrow., Hand hoe, panga.
The costs were calculated for the construction of the shed, acquisition of 3 does and establishment of fodder crops on part of cropland formerly used for annual and perrenial crops. The calculations were done for the technology in August 2011.
4.7 Most important factors affecting the costs
Describe the most determinate factors affecting the costs:
The most determinate factors in the establishment of the technology are: labour for planting, maintaining and cutting grass and other pastures and carrying the fodder to the zero-grazing unit; labour for fetching water for the animals; and labour for removing and composting manure and spreading into the garden.
5. Natural and human environment
5.1 Climate
Annual rainfall
- < 250 mm
- 251-500 mm
- 501-750 mm
- 751-1,000 mm
- 1,001-1,500 mm
- 1,501-2,000 mm
- 2,001-3,000 mm
- 3,001-4,000 mm
- > 4,000 mm
Specify average annual rainfall (if known), in mm:
1041.00
Agro-climatic zone
- sub-humid
Thermal climate class: tropics. All months above 18°C.
Rubagano receives at least 6 months of rain in 2 seasons, February to May and September to November
5.2 Topography
Slopes on average:
- flat (0-2%)
- gentle (3-5%)
- moderate (6-10%)
- rolling (11-15%)
- hilly (16-30%)
- steep (31-60%)
- very steep (>60%)
Landforms:
- plateau/plains
- ridges
- mountain slopes
- hill slopes
- footslopes
- valley floors
Altitudinal zone:
- 0-100 m a.s.l.
- 101-500 m a.s.l.
- 501-1,000 m a.s.l.
- 1,001-1,500 m a.s.l.
- 1,501-2,000 m a.s.l.
- 2,001-2,500 m a.s.l.
- 2,501-3,000 m a.s.l.
- 3,001-4,000 m a.s.l.
- > 4,000 m a.s.l.
Indicate if the Technology is specifically applied in:
- concave situations
Comments and further specifications on topography:
Altitudinal zone: 1501-2000 m a.s.l. (1740 m.a.s.l)
Slopes on average: Hilly (Fairly steep slopes in places)
5.3 Soils
Soil depth on average:
- very shallow (0-20 cm)
- shallow (21-50 cm)
- moderately deep (51-80 cm)
- deep (81-120 cm)
- very deep (> 120 cm)
Soil texture (topsoil):
- coarse/ light (sandy)
Topsoil organic matter:
- medium (1-3%)
If available, attach full soil description or specify the available information, e.g. soil type, soil PH/ acidity, Cation Exchange Capacity, nitrogen, salinity etc.
Soil depth on average: Shallow (Mother rock easily reached on pitting)
Soil texture: Coarse/light (Sand and stones)
Soil fertility: Low (Fertility depleted; being slowly replenished by application of technology)
Soil drainage/infiltration: Good (Water easily penetrates into the soil)
Soil water storage capacity: Low (Crops easily dry during the dry spell)
5.4 Water availability and quality
Ground water table:
> 50 m
Availability of surface water:
poor/ none
Water quality (untreated):
poor drinking water (treatment required)
Comments and further specifications on water quality and quantity:
Ground water table: >50m (Not possible to reach water table)
Availability of surface water: Poor/none (No surface water except when it rains)
Water quality (untreated): Poor drinking water (treatement required, muddy water collected by damming runoff in natural rock depressions)
5.5 Biodiversity
Species diversity:
- low
Comments and further specifications on biodiversity:
Low, noticed improvements after application of the technology
5.6 Characteristics of land users applying the Technology
Market orientation of production system:
- mixed (subsistence/ commercial)
Off-farm income:
- 10-50% of all income
Relative level of wealth:
- average
Individuals or groups:
- individual/ household
Level of mechanization:
- manual work
Gender:
- women
- men
Indicate other relevant characteristics of the land users:
Land users applying the Technology are mainly common / average land users
Difference in the involvement of women and men: No difference in involvement of men and women.
Population density: 100-200 persons/km2
Annual population growth: 2% - 3%
14% of the land users are rich and own 37% of the land.
48% of the land users are average wealthy and own 42% of the land.
21% of the land users are poor and own 14% of the land.
17% of the land users are poor and own 7% of the land.
Off-farm income specification: There is increased yield where the technology has been applied, increasing the income generated on-site thereby reducing off-farm percentage.
Level of mechanization: Manual work (use hand hoes)
Market orientation: Mixed (Some crops are sold to generate household income. Goats will be mainly for sale)
5.7 Average area of land used by land users applying the Technology
- < 0.5 ha
- 0.5-1 ha
- 1-2 ha
- 2-5 ha
- 5-15 ha
- 15-50 ha
- 50-100 ha
- 100-500 ha
- 500-1,000 ha
- 1,000-10,000 ha
- > 10,000 ha
Is this considered small-, medium- or large-scale (referring to local context)?
- small-scale
Comments:
Some households have more while others have less land.
5.8 Land ownership, land use rights, and water use rights
Land ownership:
- individual, not titled
Land use rights:
- individual
Water use rights:
- open access (unorganized)
- individual
Comments:
Individual land ownership. Recent introduction of the water harvesting measures provided land owners with access to own water sources
5.9 Access to services and infrastructure
health:
- poor
- moderate
- good
education:
- poor
- moderate
- good
technical assistance:
- poor
- moderate
- good
employment (e.g. off-farm):
- poor
- moderate
- good
markets:
- poor
- moderate
- good
energy:
- poor
- moderate
- good
roads and transport:
- poor
- moderate
- good
drinking water and sanitation:
- poor
- moderate
- good
financial services:
- poor
- moderate
- good
6. Impacts and concluding statements
6.1 On-site impacts the Technology has shown
Socio-economic impacts
Production
crop production
Quantity before SLM:
10kg
Quantity after SLM:
60kg
Comments/ specify:
increased yields for beans realised.
fodder production
fodder quality
animal production
risk of production failure
product diversity
production area
Income and costs
farm income
Quantity before SLM:
23dollars per yr
Quantity after SLM:
92 dollars per yr.
Comments/ specify:
yields increased from sell of goats
diversity of income sources
workload
Comments/ specify:
As there is now a lot more activity on-farm
Socio-cultural impacts
food security/ self-sufficiency
community institutions
national institutions
SLM/ land degradation knowledge
Comments/ specify:
Vegetation cover has been improved.
Improved livelihoods and human well-being
Comments/ specify:
Food security and household income have improved. This has resulted in children in these households having more time for school and in case of illness, there in some money for accessing treatment.
Ecological impacts
Soil
soil cover
nutrient cycling/ recharge
soil organic matter/ below ground C
Biodiversity: vegetation, animals
biomass/ above ground C
habitat diversity
6.2 Off-site impacts the Technology has shown
damage on neighbours' fields
Comments/ specify:
livestock is confined
6.3 Exposure and sensitivity of the Technology to gradual climate change and climate-related extremes/ disasters (as perceived by land users)
Gradual climate change
Gradual climate change
| Season | increase or decrease | How does the Technology cope with it? | |
|---|---|---|---|
| annual temperature | increase | well |
Climate-related extremes (disasters)
Meteorological disasters
| How does the Technology cope with it? | |
|---|---|
| local rainstorm | well |
Climatological disasters
| How does the Technology cope with it? | |
|---|---|
| drought | well |
Comments:
Forage and fodder usually become scorched during seasons of long drought and livestock may die from lack of food. Grass is cut in the wet season while it is plentiful and turned into hay for the time of scarcity. For this, a barn unit needs to be constructed.
6.4 Cost-benefit analysis
How do the benefits compare with the establishment costs (from land users’ perspective)?
Short-term returns:
negative
Long-term returns:
very positive
How do the benefits compare with the maintenance/ recurrent costs (from land users' perspective)?
Short-term returns:
positive
Long-term returns:
very positive
Comments:
The benefits far outweigh the establishment and maintenance costs. The negative on short-term returns is due to the cost of the technology (construction and procuring livestock) which is a little high for the farmers in this area.
6.5 Adoption of the Technology
If available, quantify (no. of households and/ or area covered):
20 on 2 hectares
Of all those who have adopted the Technology, how many did so spontaneously, i.e. without receiving any material incentives/ payments?
- 11-50%
Comments:
90% of land user families have adopted the Technology with external material support
18 land user families have adopted the Technology with external material support
Comments on acceptance with external material support: The does were supplied to farmers using project funds.
10% of land user families have adopted the Technology without any external material support
2 land user families have adopted the Technology without any external material support
Comments on spontaneous adoption: these farmers are rich and procured the technology without support from the project
There is a moderate trend towards spontaneous adoption of the Technology
Comments on adoption trend: 20 households in one village have adopted the technology
6.7 Strengths/ advantages/ opportunities of the Technology
| Strengths/ advantages/ opportunities in the land user’s view |
|---|
|
Technology easy to establish and maintain How can they be sustained / enhanced? Proper management of the livestock |
|
Helps in soil fertility management How can they be sustained / enhanced? Good manure management |
|
Imporove soil cover and reduce soil erosion How can they be sustained / enhanced? using the manure in a proper /recommended way i.e. using it when planting or putting it in the plot before primary cultivation |
| Strengths/ advantages/ opportunities in the compiler’s or other key resource person’s view |
|---|
|
Animals are fed on selected pasture How can they be sustained / enhanced? Promote the growing of that pasture |
|
The technology promotes us of organic manure How can they be sustained / enhanced? Use of compost pits to recycle the wastes into manure |
6.8 Weaknesses/ disadvantages/ risks of the Technology and ways of overcoming them
| Weaknesses/ disadvantages/ risks in the compiler’s or other key resource person’s view | How can they be overcome? |
|---|---|
| The technology may contribute to loss of vegetation | Planting pasture & other grass for feeding the animals |
7. References and links
7.2 References to available publications
Title, author, year, ISBN:
Kagera TAMP project website
Available from where? Costs?
http://www.fao.org/nr/kagera/en/
Links and modules
Expand all Collapse allLinks
No links
Modules
No modules


