Franja Ribereña [Ecuador]
- Creation:
- Update:
- Compiler: Pablo Caza
- Editor: Carlos Samaniego
- Reviewers: Giacomo Morelli, Nicole Harari, Johanna Jacobi
Franja Ribereña
technologies_3278 - Ecuador
View sections
Expand all Collapse all1. General information
1.2 Contact details of resource persons and institutions involved in the assessment and documentation of the Technology
Key resource person(s)
land user:
Ecuador
Name of project which facilitated the documentation/ evaluation of the Technology (if relevant)
Decision Support for Mainstreaming and Scaling out Sustainable Land Management (GEF-FAO / DS-SLM)Name of the institution(s) which facilitated the documentation/ evaluation of the Technology (if relevant)
Ministerio de Ambiente y Agua Ecuador (MAAE) - EcuadorName of the institution(s) which facilitated the documentation/ evaluation of the Technology (if relevant)
Ministerio de Agricultura y Ganadería Ecuador (MAG) - EcuadorName of the institution(s) which facilitated the documentation/ evaluation of the Technology (if relevant)
Organización de la Naciones Unidas para la Alimentación y la Agricultura Ecuador (FAO Ecuador) - Ecuador1.3 Conditions regarding the use of data documented through WOCAT
When were the data compiled (in the field)?
15/10/2017
The compiler and key resource person(s) accept the conditions regarding the use of data documented through WOCAT:
Ja
1.4 Declaration on sustainability of the described Technology
Is the Technology described here problematic with regard to land degradation, so that it cannot be declared a sustainable land management technology?
Nee
Comments:
Práctica ancestral en la zona
2. Description of the SLM Technology
2.1 Short description of the Technology
Definition of the Technology:
Franja Ribereña
2.2 Detailed description of the Technology
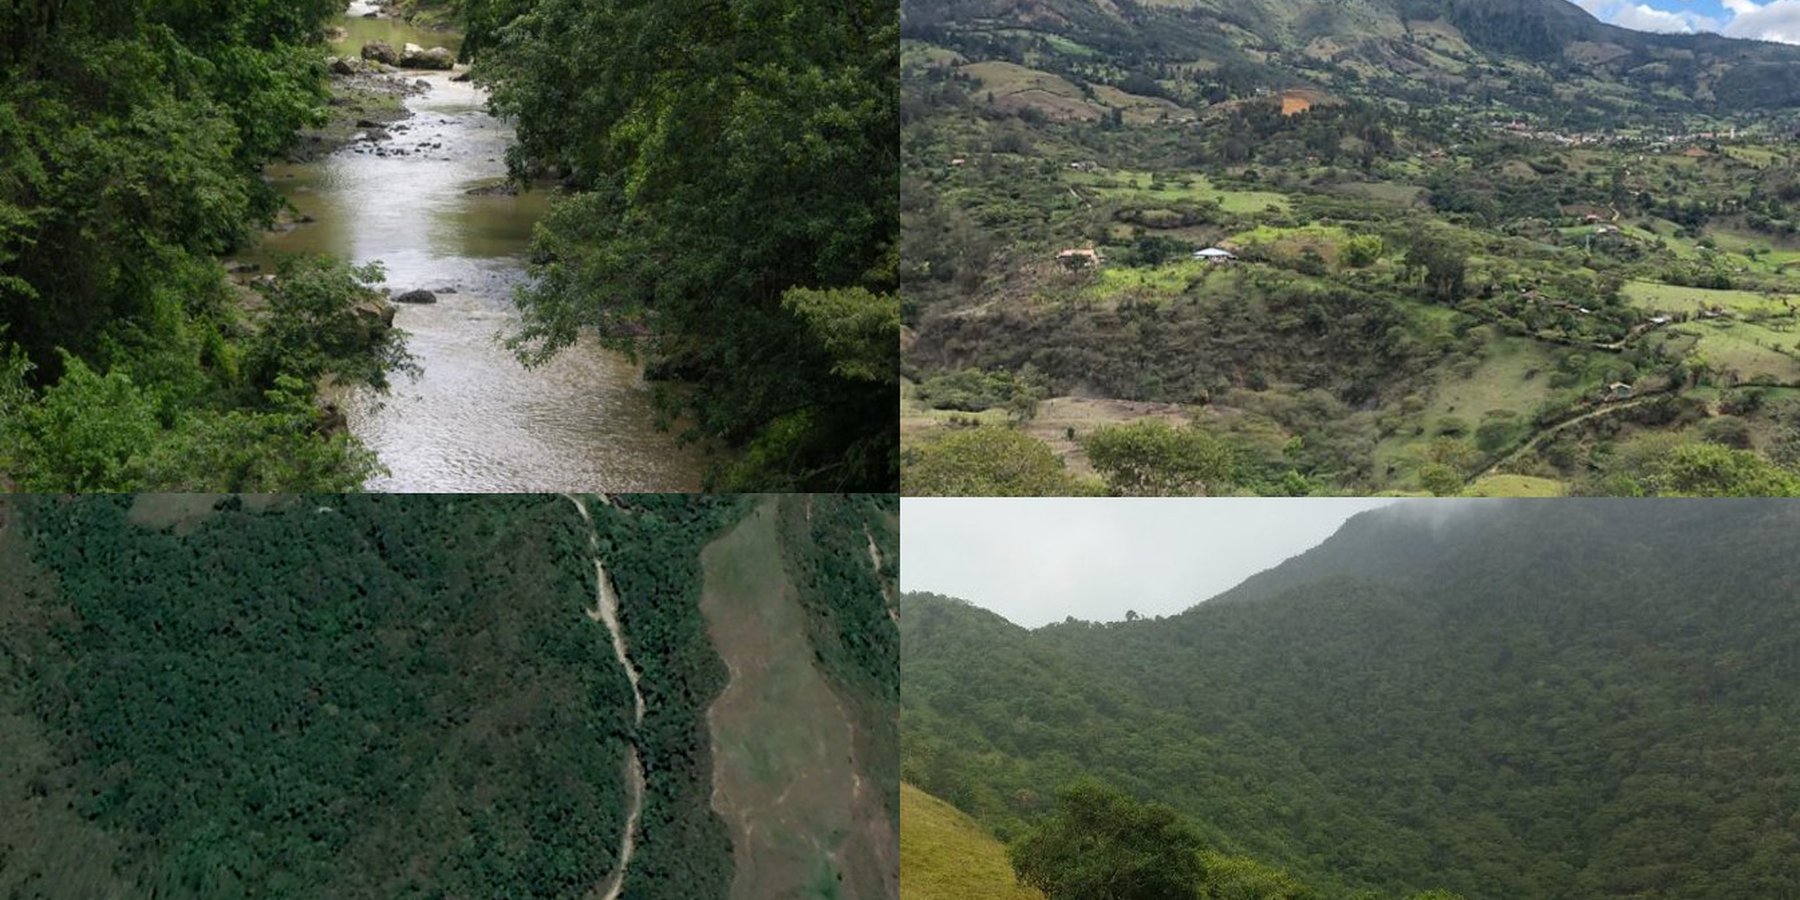
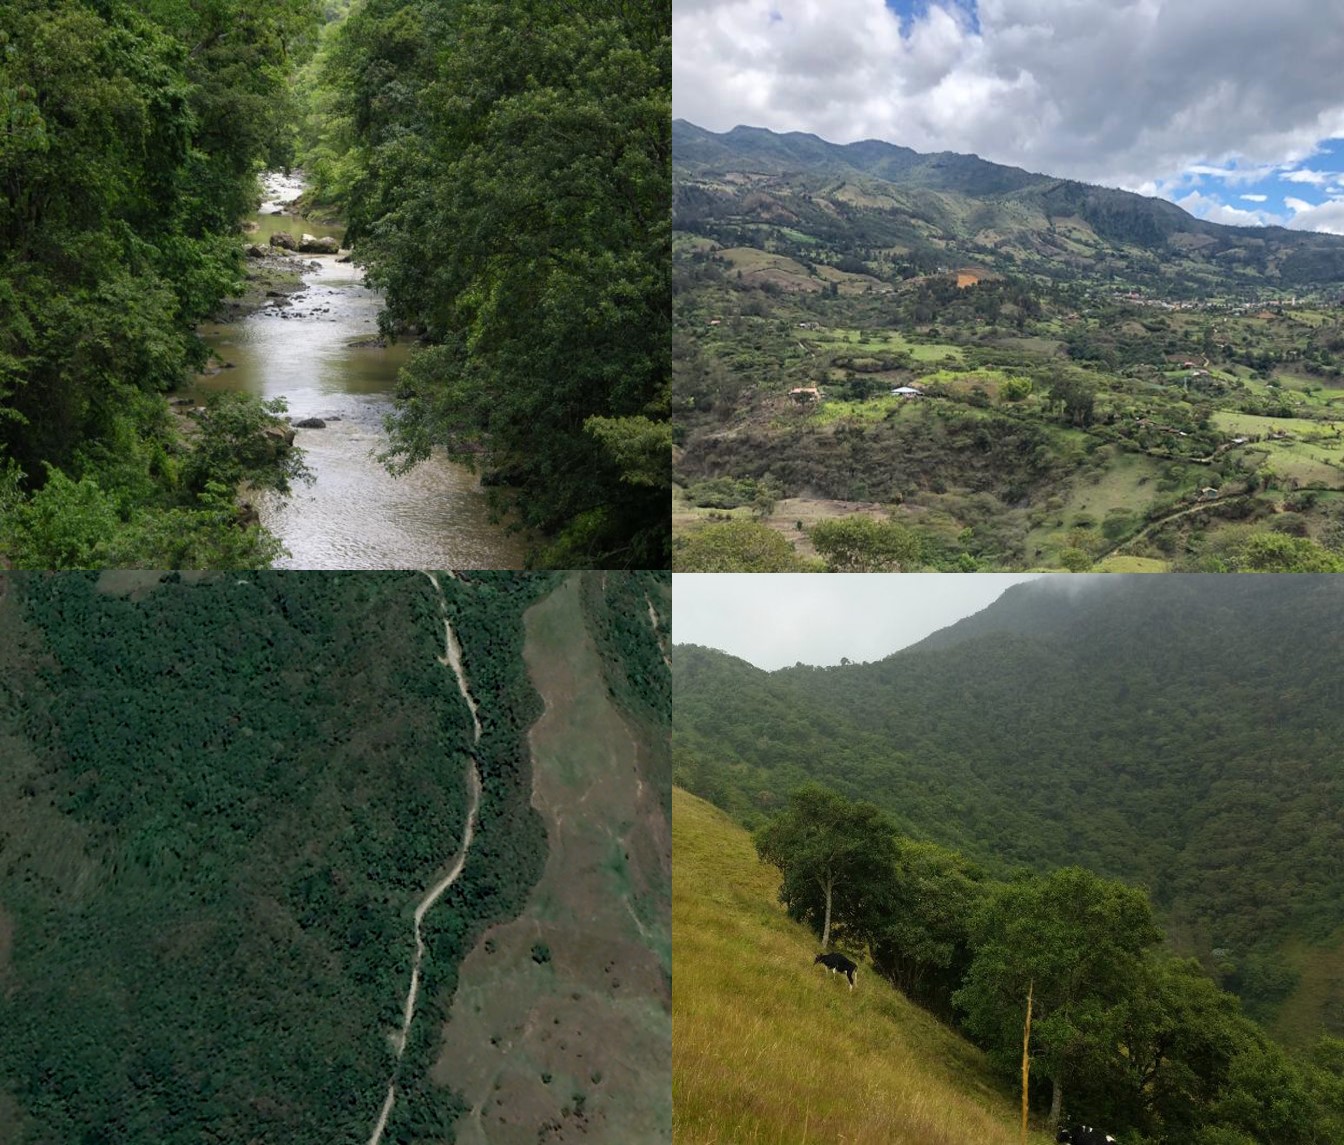
Description:
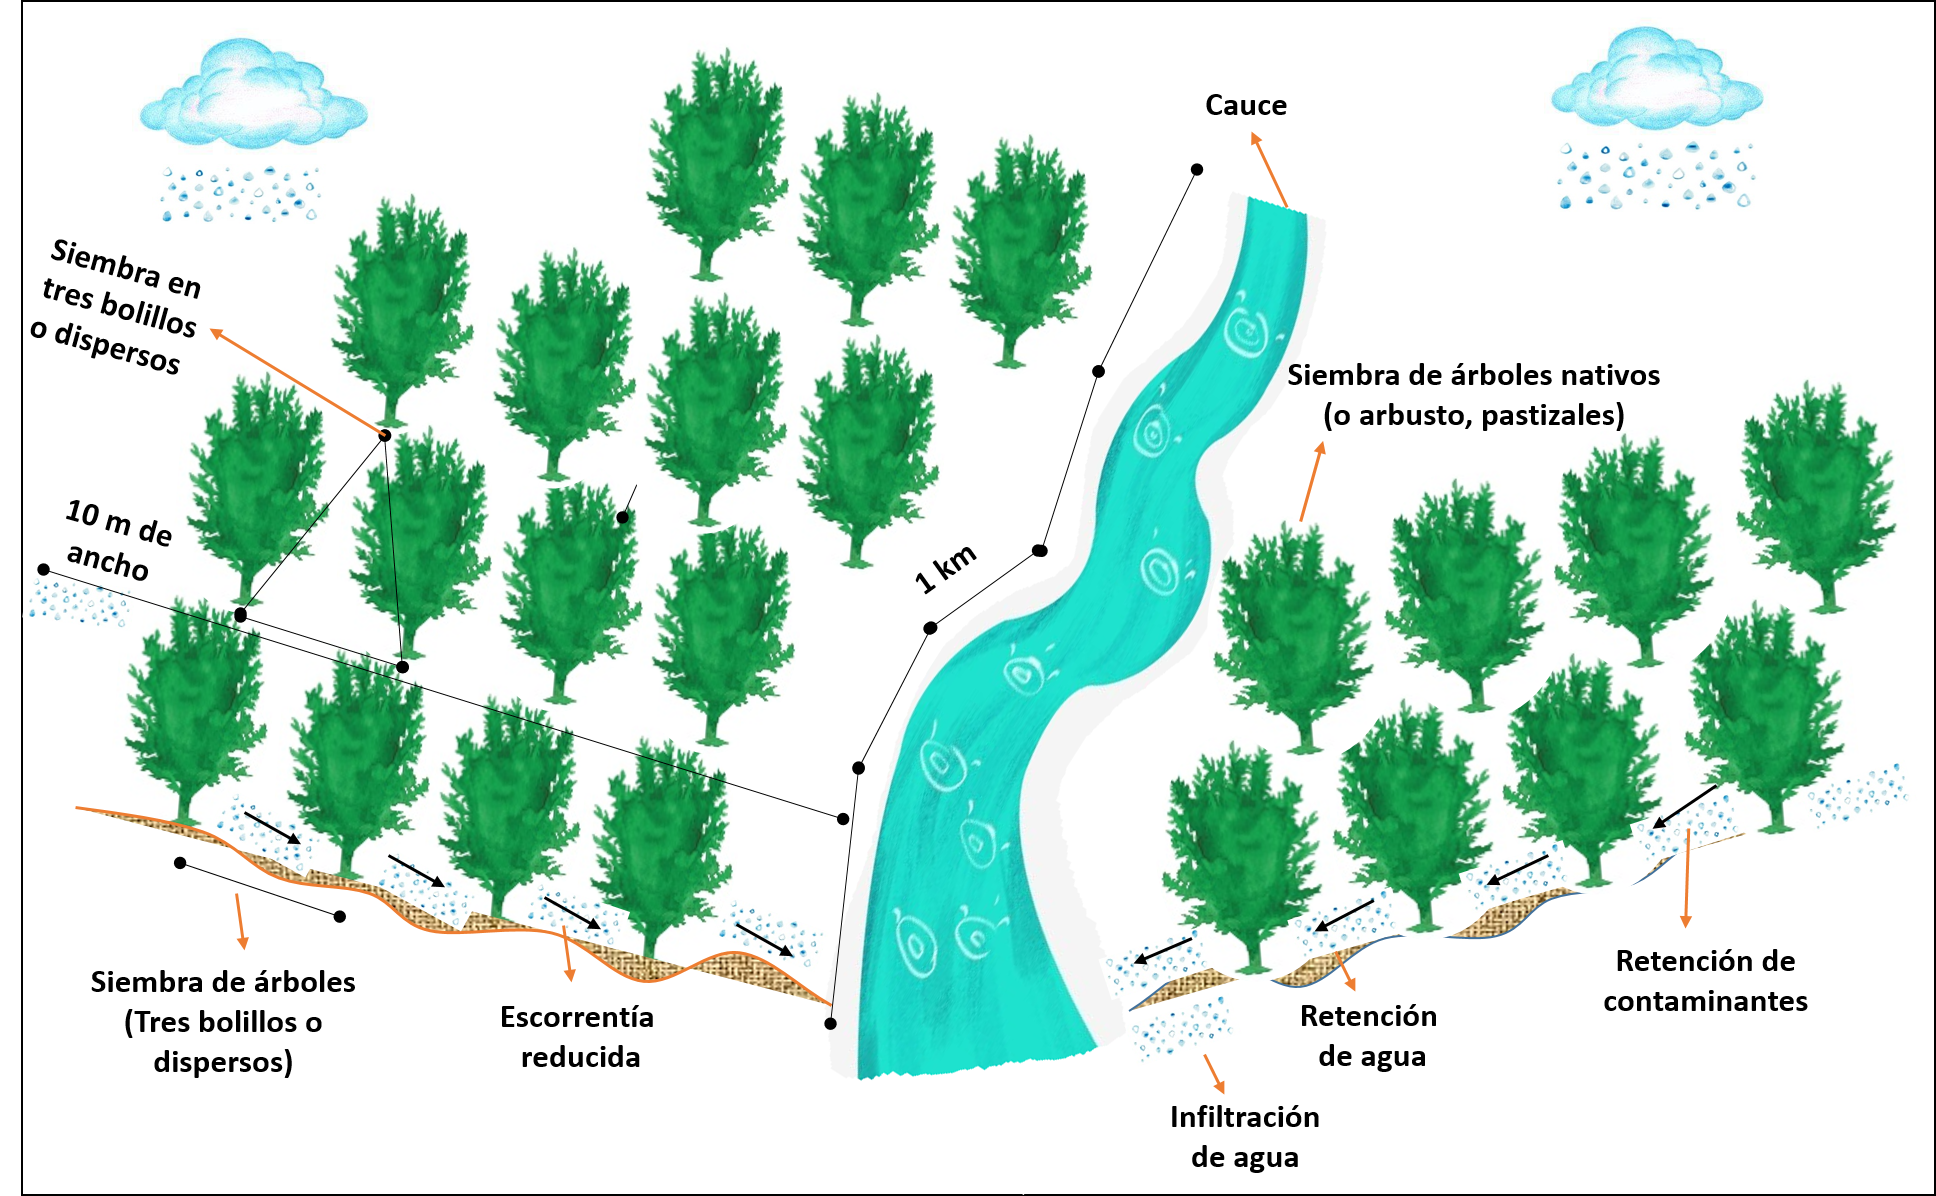
Franja ribereña a cada lado de la quebrada, una longitud de 1 km y 10 m de ancho a cada lado, se lo puede hacer mediante regeneración natural o regeneración asistida, para este caso se tomará el ejemplo de regeneración natural para lo cual se necesita hacer una protección física con postes vivos o de madera y alambre de púas para evitar el ingreso de animales. El alambrado debe tener 4 hileras de alambre y los postes ubicados cada 3 m de distanciamiento
La vegetación ribereña es aquella que ocupa las riberas de los ríos, en ocasiones extendiéndose hasta las planicies de inundación adyacentes a los cursos de agua.
Está demostrado el papel de este tipo de vegetación como un amortiguador de las influencias que provienen desde zonas extra ribereñas, dominadas por actividades agropecuarias, forestales, industriales y asentamientos humanos. Se considera que estas franjas ribereñas están implicadas en el control de los caudales, evitando que ellos aumenten fuertemente tras lluvias intensas, o que disminuyan drásticamente en verano, en comparación a lugares donde no existe este tipo de cobertura vegetal. Por otro lado están implicadas en la retención de sedimentos y nutrientes que de otra forma generarían una mayor turbidez en el agua de los arroyos. Las franjas ribereñas también sirven como reguladores de la temperatura de los cursos de agua, creando las condiciones propicias para las poblaciones de peces, crustáceos e insectos acuáticos.
Diversas especies de aves, mamíferos y anfibios hacen uso de los corredores ribereños que aún persisten, proveyendo hábitat y conectividad para poblaciones de animales dispersas.
Asimismo, las franjas ribereñas están asociadas a un efecto filtro sobre los patógenos microbianos, se produce una disminución en la cantidad de coliformes totales y fecales a medida que el agua fluye bajo la superficie del suelo hacia los arroyos, tanto en la zona no saturada de agua, así como en la zona saturada correspondiente a la capa freática subterránea.
Los agricultores gusta de esta tecnologías porque les ayuda a mitigar la erosión de los suelos y con ello evitar la pérdida de los nutrientes. La tecnología es aplicada también para retener, en las raíces de las plantas, el agua proveniente de la lluvia la cual se infiltra y se incorpora a las vertientes de forma paulatina.
2.3 Photos of the Technology
Media Gallery
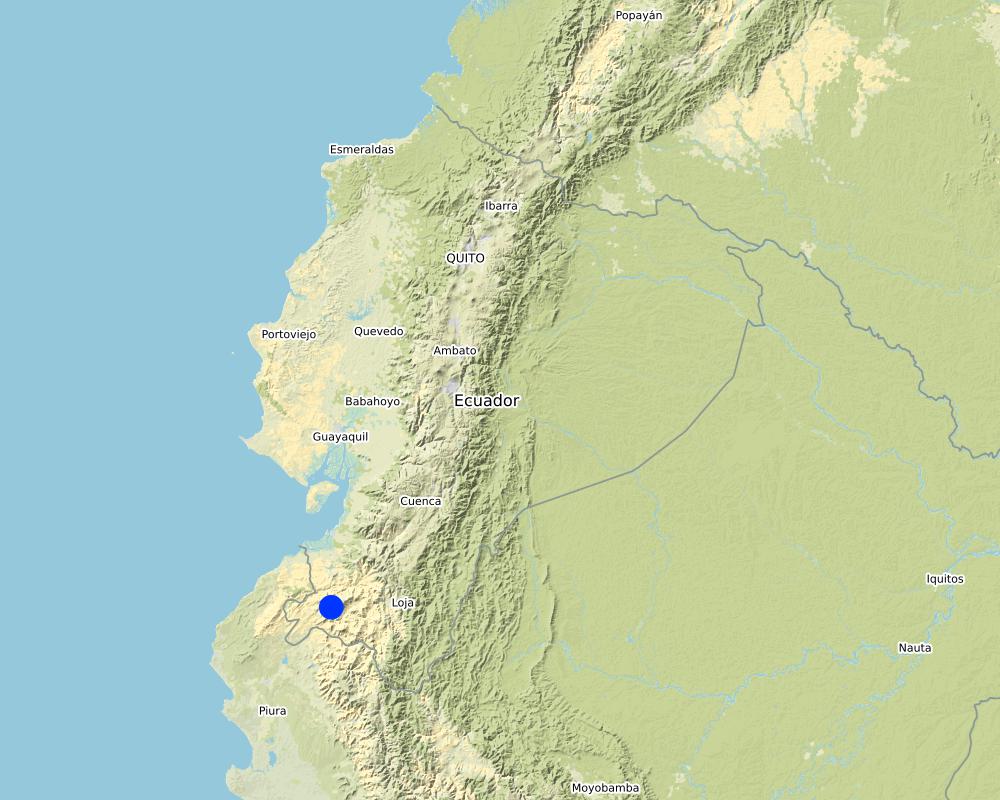
2.5 Country/ region/ locations where the Technology has been applied and which are covered by this assessment
Country:
Ecuador
Region/ State/ Province:
Cantón Celicia, Provincia de Loja
Further specification of location:
San Juan de Pozul
Map
×2.6 Date of implementation
Indicate year of implementation:
1980
If precise year is not known, indicate approximate date:
- 10-50 years ago
2.7 Introduction of the Technology
Specify how the Technology was introduced:
- as part of a traditional system (> 50 years)
3. Classification of the SLM Technology
3.1 Main purpose(s) of the Technology
- reduce, prevent, restore land degradation
- conserve ecosystem
- protect a watershed/ downstream areas – in combination with other Technologies
- preserve/ improve biodiversity
- reduce risk of disasters
- adapt to climate change/ extremes and its impacts
- mitigate climate change and its impacts
- create beneficial economic impact
- create beneficial social impact
3.2 Current land use type(s) where the Technology is applied

Cropland
- Tree and shrub cropping

Waterways, waterbodies, wetlands
- Drainage lines, waterways
- Ponds, dams
- Swamps, wetlands
3.3 Further information about land use
Water supply for the land on which the Technology is applied:
- mixed rainfed-irrigated
Number of growing seasons per year:
- 2
3.4 SLM group to which the Technology belongs
- area closure (stop use, support restoration)
- water harvesting
- ecosystem-based disaster risk reduction
3.5 Spread of the Technology
Specify the spread of the Technology:
- evenly spread over an area
If the Technology is evenly spread over an area, indicate approximate area covered:
- 1-10 km2
3.6 SLM measures comprising the Technology

management measures
- M1: Change of land use type
- M2: Change of management/ intensity level
3.7 Main types of land degradation addressed by the Technology

soil erosion by water
- Wt: loss of topsoil/ surface erosion
- Wr: riverbank erosion

chemical soil deterioration
- Cp: soil pollution

biological degradation
- Bh: loss of habitats
water degradation
- Ha: aridification
- Hg: change in groundwater/aquifer level
- Hp: decline of surface water quality
- Hq: decline of groundwater quality
- Hw: reduction of the buffering capacity of wetland areas
3.8 Prevention, reduction, or restoration of land degradation
Specify the goal of the Technology with regard to land degradation:
- reduce land degradation
- restore/ rehabilitate severely degraded land
4. Technical specifications, implementation activities, inputs, and costs
4.1 Technical drawing of the Technology
Author:
https://condesan.org/wp-content/uploads/2019/09/Ganader%C3%ADa-Sostenible-NO-Pichincha_web_final-1.pdf
Date:
20/07/2020
4.2 Technical specifications/ explanations of technical drawing
La franja se estableció a lo largo de 1 km aproximadamente siguiendo el cauce y dirección de aguas desde la parte alta a las partes media y baja. Se considera un margen de 10 metros cada uno de los cauces de la franja ribereña a protegerse para favorecer la regeneración natural y el mantenimiento de la cubierta vegetal con arboles y arbustos.
4.3 General information regarding the calculation of inputs and costs
Specify how costs and inputs were calculated:
- per Technology area
Indicate size and area unit:
Franja de 1 km de largo con ancho de 20 metros
If using a local area unit, indicate conversion factor to one hectare:
2 ha
Specify currency used for cost calculations:
- US Dollars
Indicate average wage cost of hired labour per day:
15 USD
4.4 Establishment activities
| Activity | Type of measure | Timing | |
|---|---|---|---|
| 1. | Limpieza de terreno | Vegetative | None |
| 2. | Transporte de materiales | Structural | None |
| 3. | Elaboración de hoyado | Structural | None |
| 4. | Colocación de postes | Vegetative | None |
| 5. | Colocación de alambre | Structural | None |
| 6. | None | Structural | None |
4.5 Costs and inputs needed for establishment
| Specify input | Unit | Quantity | Costs per Unit | Total costs per input | % of costs borne by land users | |
|---|---|---|---|---|---|---|
| Labour | Limpieza de terreno | jornal | 4.0 | 15.0 | 60.0 | 100.0 |
| Labour | Transporte de materiales | jornal | 2.0 | 15.0 | 30.0 | 20.0 |
| Labour | Hoyado | jornal | 7.0 | 15.0 | 105.0 | 100.0 |
| Labour | Colocación de postes | jornal | 6.0 | 15.0 | 90.0 | 100.0 |
| Equipment | Alambre | jornal | 5.0 | 15.0 | 75.0 | 100.0 |
| Equipment | Alambre de púas de 500 m | rollo | 5.0 | 14.0 | 70.0 | 100.0 |
| Equipment | Postes de madera de la zona | poste de 2 m | 400.0 | 10.0 | 4000.0 | |
| Equipment | None | None | 15.0 | 60.0 | 900.0 | |
| Equipment | None | None | 2.0 | 30.0 | 60.0 | 100.0 |
| Equipment | None | None | 3.0 | 15.0 | 45.0 | 100.0 |
| Equipment | None | None | 3.0 | 15.0 | 45.0 | 100.0 |
| Plant material | None | None | 2222.0 | 0.25 | 555.5 | |
| Total costs for establishment of the Technology | 6035.5 | |||||
If land user bore less than 100% of costs, indicate who covered the remaining costs:
Apoyo de Gobierno local
4.6 Maintenance/ recurrent activities
| Activity | Type of measure | Timing/ frequency | |
|---|---|---|---|
| 1. | Limpieza de terreno | Agronomic | anualmente |
| 2. | Transporte de materiales | Vegetative | anualmente |
| 3. | Hoyado | Structural | anualmente |
| 4. | Colocación de postes | anualmente | |
| 5. | Colocación de alambre | anualmente |
Comments:
Se hace referencia a la anualidad de las actividades debido al mantenimiento previsto cada 12 meses
4.7 Costs and inputs needed for maintenance/ recurrent activities (per year)
| Specify input | Unit | Quantity | Costs per Unit | Total costs per input | % of costs borne by land users | |
|---|---|---|---|---|---|---|
| Labour | Limpieza de terreno | jornal | 2.0 | 15.0 | 30.0 | 100.0 |
| Labour | Cambio de postes | jornal | 3.0 | 15.0 | 45.0 | 100.0 |
| Labour | Cambio de alambre | jornal | ||||
| Labour | Alambre de púas | rollo | ||||
| Equipment | Postes de madera | postes 2 m | 1.0 | 60.0 | 60.0 | 100.0 |
| Plant material | None | None | 100.0 | 0.25 | 25.0 | |
| Total costs for maintenance of the Technology | 160.0 | |||||
If land user bore less than 100% of costs, indicate who covered the remaining costs:
Apoyo del Gobierno local
4.8 Most important factors affecting the costs
Describe the most determinate factors affecting the costs:
El grado de afectación de la estructura implementada. Los daños mucha de las veces son ocasionados por personas desaprensivas de la zona.
5. Natural and human environment
5.1 Climate
Annual rainfall
- < 250 mm
- 251-500 mm
- 501-750 mm
- 751-1,000 mm
- 1,001-1,500 mm
- 1,501-2,000 mm
- 2,001-3,000 mm
- 3,001-4,000 mm
- > 4,000 mm
Specify average annual rainfall (if known), in mm:
912.00
Agro-climatic zone
- semi-arid
5.2 Topography
Slopes on average:
- flat (0-2%)
- gentle (3-5%)
- moderate (6-10%)
- rolling (11-15%)
- hilly (16-30%)
- steep (31-60%)
- very steep (>60%)
Landforms:
- plateau/plains
- ridges
- mountain slopes
- hill slopes
- footslopes
- valley floors
Altitudinal zone:
- 0-100 m a.s.l.
- 101-500 m a.s.l.
- 501-1,000 m a.s.l.
- 1,001-1,500 m a.s.l.
- 1,501-2,000 m a.s.l.
- 2,001-2,500 m a.s.l.
- 2,501-3,000 m a.s.l.
- 3,001-4,000 m a.s.l.
- > 4,000 m a.s.l.
Indicate if the Technology is specifically applied in:
- concave situations
5.3 Soils
Soil depth on average:
- very shallow (0-20 cm)
- shallow (21-50 cm)
- moderately deep (51-80 cm)
- deep (81-120 cm)
- very deep (> 120 cm)
Soil texture (topsoil):
- coarse/ light (sandy)
- fine/ heavy (clay)
Soil texture (> 20 cm below surface):
- coarse/ light (sandy)
- fine/ heavy (clay)
Topsoil organic matter:
- medium (1-3%)
5.4 Water availability and quality
Ground water table:
< 5 m
Availability of surface water:
medium
Water quality (untreated):
for agricultural use only (irrigation)
Is water salinity a problem?
Nee
Is flooding of the area occurring?
Nee
5.5 Biodiversity
Species diversity:
- medium
Habitat diversity:
- medium
5.6 Characteristics of land users applying the Technology
Sedentary or nomadic:
- Sedentary
Market orientation of production system:
- mixed (subsistence/ commercial
Off-farm income:
- less than 10% of all income
Relative level of wealth:
- poor
- average
Individuals or groups:
- individual/ household
- groups/ community
Level of mechanization:
- manual work
- animal traction
Gender:
- women
- men
Age of land users:
- middle-aged
- elderly
5.7 Average area of land owned or leased by land users applying the Technology
- < 0.5 ha
- 0.5-1 ha
- 1-2 ha
- 2-5 ha
- 5-15 ha
- 15-50 ha
- 50-100 ha
- 100-500 ha
- 500-1,000 ha
- 1,000-10,000 ha
- > 10,000 ha
Is this considered small-, medium- or large-scale (referring to local context)?
- small-scale
5.8 Land ownership, land use rights, and water use rights
Land ownership:
- individual, titled
Land use rights:
- communal (organized)
Water use rights:
- communal (organized)
5.9 Access to services and infrastructure
health:
- poor
- moderate
- good
education:
- poor
- moderate
- good
technical assistance:
- poor
- moderate
- good
employment (e.g. off-farm):
- poor
- moderate
- good
markets:
- poor
- moderate
- good
energy:
- poor
- moderate
- good
roads and transport:
- poor
- moderate
- good
drinking water and sanitation:
- poor
- moderate
- good
financial services:
- poor
- moderate
- good
6. Impacts and concluding statements
6.1 On-site impacts the Technology has shown
Socio-economic impacts
Production
crop production
Water availability and quality
drinking water availability
water availability for livestock
irrigation water availability
Socio-cultural impacts
SLM/ land degradation knowledge
conflict mitigation
Ecological impacts
Water cycle/ runoff
water quantity
Quantity before SLM:
1 pulgada
Quantity after SLM:
2 pulgadas
water quality
surface runoff
excess water drainage
evaporation
Soil
soil moisture
soil cover
soil loss
soil compaction
nutrient cycling/ recharge
Biodiversity: vegetation, animals
Vegetation cover
plant diversity
animal diversity
habitat diversity
Climate and disaster risk reduction
flood impacts
drought impacts
6.2 Off-site impacts the Technology has shown
water availability
reliable and stable stream flows in dry season
downstream flooding
downstream siltation
buffering/ filtering capacity
6.3 Exposure and sensitivity of the Technology to gradual climate change and climate-related extremes/ disasters (as perceived by land users)
Climate-related extremes (disasters)
Climatological disasters
| How does the Technology cope with it? | |
|---|---|
| heatwave | very well |
| drought | very well |
| forest fire | moderately |
Hydrological disasters
| How does the Technology cope with it? | |
|---|---|
| general (river) flood | moderately |
| flash flood | well |
6.4 Cost-benefit analysis
How do the benefits compare with the establishment costs (from land users’ perspective)?
Short-term returns:
neutral/ balanced
Long-term returns:
very positive
How do the benefits compare with the maintenance/ recurrent costs (from land users' perspective)?
Short-term returns:
neutral/ balanced
Long-term returns:
positive
6.5 Adoption of the Technology
- 1-10%
Of all those who have adopted the Technology, how many have did so spontaneously, i.e. without receiving any material incentives/ payments?
- 0-10%
6.6 Adaptation
Has the Technology been modified recently to adapt to changing conditions?
Nee
6.7 Strengths/ advantages/ opportunities of the Technology
| Strengths/ advantages/ opportunities in the land user’s view |
|---|
| Almacenamiento natural de agua en períodos de lluvia para usarse en época seca |
| Valoración de productores y oportunidad de replicar la actividad en zonas aledañas |
| Práctica ancestral con funcionalidad probada por generaciones |
| Almacenamiento natural de agua en períodos de lluvia para usarse en época seca |
| Almacenamiento natural de agua en períodos de lluvia para usarse en época seca |
| Strengths/ advantages/ opportunities in the compiler’s or other key resource person’s view |
|---|
| Amortiguador de las influencias provienientes desde zonas extra ribereñas |
| Control de caudales |
| Retención de sedimentos y nutrientes |
| Reguladores de la temperatura de los cursos de agua |
| Provee hábitat y conectividad para poblaciones de animales dispersas. |
6.8 Weaknesses/ disadvantages/ risks of the Technology and ways of overcoming them
| Weaknesses/ disadvantages/ risks in the land user’s view | How can they be overcome? |
|---|---|
| Riesgo de daños por personas desaprensivas | |
| Desplazamiento de otras tecnologías como uso de geomembrana |
| Weaknesses/ disadvantages/ risks in the compiler’s or other key resource person’s view | How can they be overcome? |
|---|---|
| Requiere importante mano de obra | |
7. References and links
7.1 Methods/ sources of information
- field visits, field surveys
- interviews with SLM specialists/ experts
- compilation from reports and other existing documentation
7.3 Links to relevant information which is available online
Title/ description:
Recomendaciones para el diseño de Franjas Ribereñas
URL:
https://www.uach.cl/externos/epicforce/pdf/boletin_recomen_zmc.pdf
Links and modules
Expand all Collapse allLinks
No links
Modules
No modules