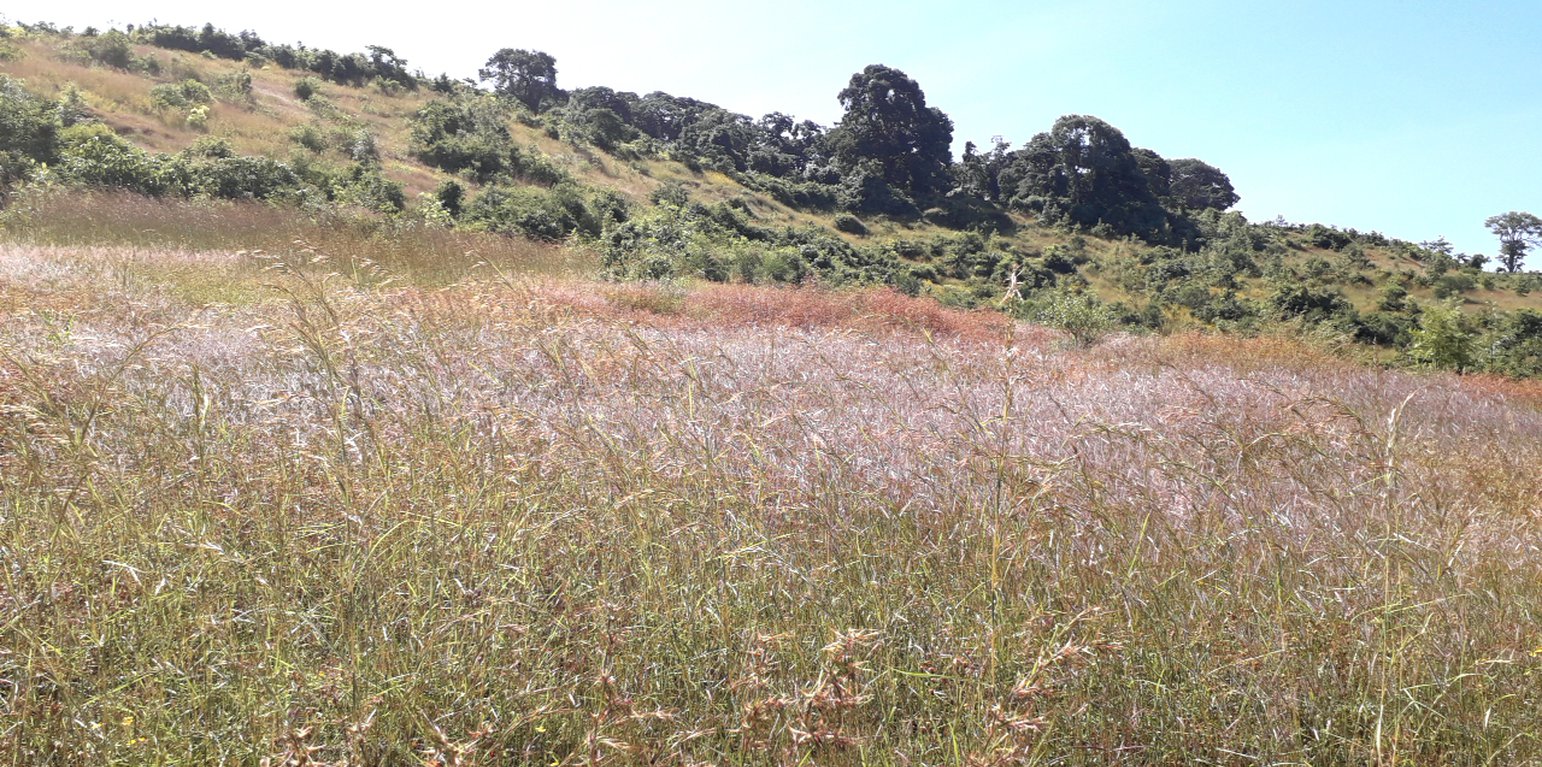
Abagerima closed area managment overview photo, with grasses on fallow land in the foreground, and bush and tree recovery in the background. (Melese Bililign)

Closed Area Management in Abagerima Learning Watershed (Ethiopia)

Closed area management

Description

Closed area management is an area within a watershed into which human and livestock access is limited, and the area is left for natural recovery of vegetation and soil. Management relates to activities by the community to ensure such protection and to support regeneration, such as constructing drainage and retention structures, selective bush removal, regular grass cutting, occasional tree planting, and organisation of economic activities like grass cutting.

1. The closed area management technology is applied within Abagerima Learning Watershed of the Water and Land Resource Centre project.
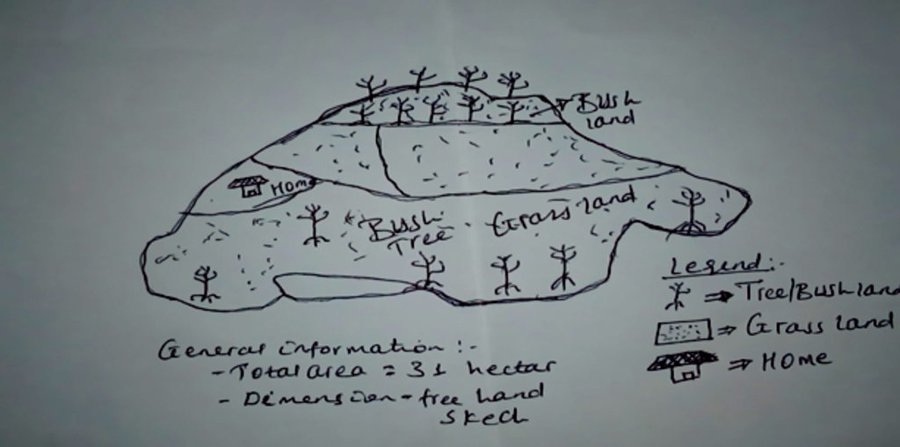
2. In the area closures, community-based participatory management is applied to recover degraded areas.
3. The area is closed from agricultural activities and livestock grazing, while water harvesting and drainage structures are constructed, like small trenches and cut-off drains.
4. Natural grasses are regularly cut and carried, and selective trees are planted.
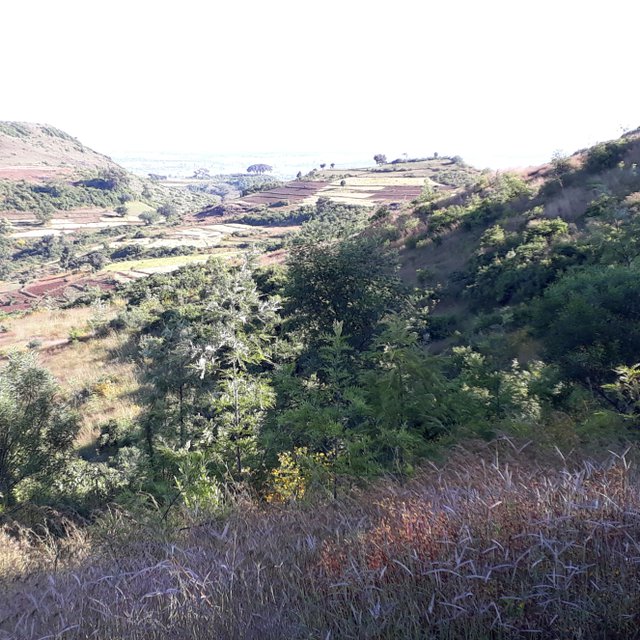
5. Forage growth for animal feed is encouraged, thereby reducing soil erosion, storing water, reducing soil loss, and avoiding conflicts with down-stream users.
6. The community is committed and responsible for closed area management, such as construction of trenches for water drainage and harvesting, plantation of trees, and to reduce soil erosion. The communities of the Abagerima Learning Watershed are very happy to manage their closed areas and equally share the grass biomass, and later on selective trees.
7. As a consequence, forage biomass has been increasing over the past 6 years and is regularly cut and carried, while indigenous and introduced trees are growing.
8. Through these activities, heavily degraded and overgrazed land could be transformed into productive land.

Location

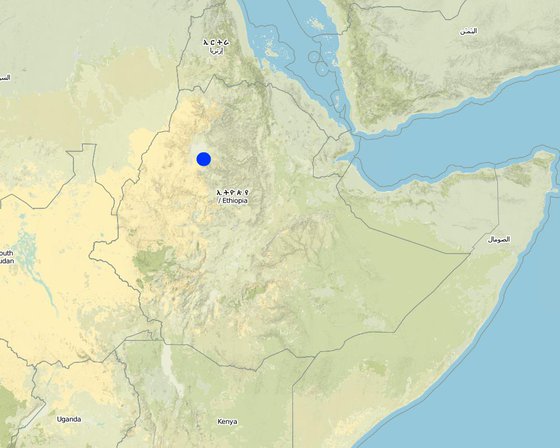
Location: the area is near Bahir Dar regional capital, Amhara Region, West Gojam Zone, Bahir Dar Zurya, Ethiopia

No. of Technology sites analysed: 2-10 sites

Geo-reference of selected sites
  • 37.50862, 11.65783
  • 37.50725, 11.66502
  • 37.49008, 11.65485

Spread of the Technology: evenly spread over an area (0.306 km²)

In a permanently protected area?: No

Date of implementation: 2012; less than 10 years ago (recently)

Type of introduction
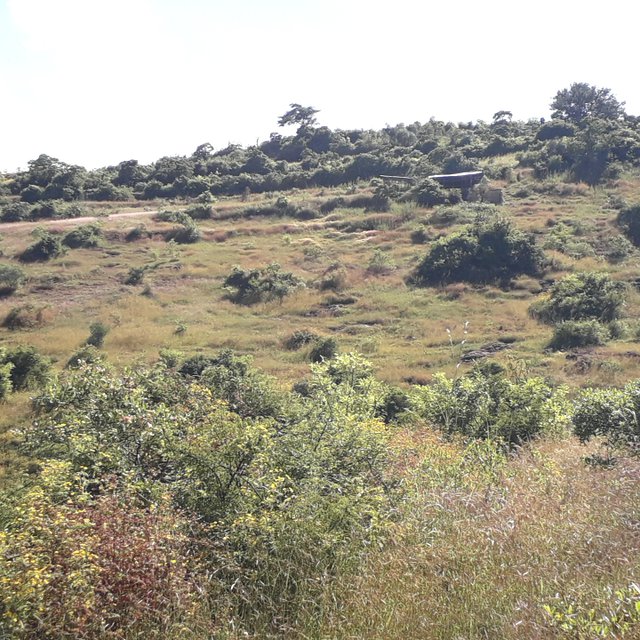
Overview of area closure, in the centre of which there is a source of holy water for the church community. (Melese Bililign)
Closed areas in Abagerima Learning Watershed six years after their establishment. (Hans Hurni)

Classification of the Technology

Main purpose
  • improve production
  • reduce, prevent, restore land degradation
  • conserve ecosystem
  • protect a watershed/ downstream areas – in combination with other Technologies
  • preserve/ improve biodiversity
  • reduce risk of disasters
  • adapt to climate change/ extremes and its impacts
  • mitigate climate change and its impacts
  • create beneficial economic impact
  • create beneficial social impact
Land use
Land use mixed within the same land unit: Yes - Agroforestry

  • Grazing land
    • Cut-and-carry/ zero grazing
    Animal type: cattle - dairy, cattle - non-dairy beef, cattle - non-dairy working, goats, horses, mules and asses, poultry, sheep, Cattle (differentiation between different types of cattles is difficult)
    Is integrated crop-livestock management practiced? Yes
    Products and services: meat, milk, skins/ hides, transport/ draught
      SpeciesCount
      cattle - non-dairy beef1656
      sheep284
      goats186
      horses30
      mules and asses605
    • Forest/ woodlandsTree types (mixed deciduous/ evergreen): Acacia senegal, Grevillea robusta
      Products and services: Fuelwood, Nature conservation/ protection

    Water supply
    • rainfed
    • mixed rainfed-irrigated
    • full irrigation

    Purpose related to land degradation
    • prevent land degradation
    • reduce land degradation
    • restore/ rehabilitate severely degraded land
    • adapt to land degradation
    • not applicable
    Degradation addressed
    • soil erosion by water - Wt: loss of topsoil/ surface erosion
    • physical soil deterioration - Pc: compaction
    • biological degradation - Bc: reduction of vegetation cover, Bh: loss of habitats, Bq: quantity/ biomass decline, Bs: quality and species composition/ diversity decline, Bl: loss of soil life
    • water degradation - Hs: change in quantity of surface water
    SLM group
    • agroforestry
    • area closure (stop use, support restoration)
    SLM measures
    • vegetative measures - V1: Tree and shrub cover, V2: Grasses and perennial herbaceous plants
    • structural measures - S3: Graded ditches, channels, waterways, S4: Level ditches, pits
    • management measures - M2: Change of management/ intensity level, M3: Layout according to natural and human environment

    Technical drawing

    Technical specifications
    The drawing is a free-hand sketch of the area closure near Laguna Giyorgis Church in Abagerima Learning Watershed.
    The boarder of the closed area consists of cut off drains, forests, roads and croplands.
    Author: Melese Blilign, Bekalu Bitew

    Establishment and maintenance: activities, inputs and costs

    Calculation of inputs and costs
    • Costs are calculated: per Technology area (size and area unit: 31 ha)
    • Currency used for cost calculation: USD
    • Exchange rate (to USD): 1 USD = n.a
    • Average wage cost of hired labour per day: 3.7
    Most important factors affecting the costs
    Establishment of the technology at the initial stage (digging of trenches, cut-off drains and waterways) causes high costs.
    Establishment activities
    1. survey (Timing/ frequency: October (end of rainy season))
    2. planning & community awareness (Timing/ frequency: October)
    3. preparing materials (Timing/ frequency: October)
    4. design & layout (Timing/ frequency: November)
    5. implementation (Timing/ frequency: December (beginning of dry season))
    Establishment inputs and costs (per 31 ha)
    Specify input Unit Quantity Costs per Unit (USD) Total costs per input (USD) % of costs borne by land users
    Labour
    construction of trenches person-days 210.0 3.7 777.0
    pit preparation for tree planting numbers 90.0 1.5 135.0
    Equipment
    hand tools numbers 240.0 2.8 672.0
    Plant material
    tree seedlings numbers 106.0 1.5 159.0 50.0
    grass and legume seeds kg 200.0 22.0 4400.0 50.0
    Total costs for establishment of the Technology 6'143.0
    Total costs for establishment of the Technology in USD 6'143.0
    Maintenance activities
    1. grass cutting (Timing/ frequency: once per year)
    2. bush clearing (Timing/ frequency: irregular)
    Maintenance inputs and costs (per 31 ha)
    Specify input Unit Quantity Costs per Unit (USD) Total costs per input (USD) % of costs borne by land users
    Labour
    grass cutting person-days 150.0 3.7 555.0 100.0
    bush clearing person-days 20.0 3.7 74.0 100.0
    Total costs for maintenance of the Technology 629.0
    Total costs for maintenance of the Technology in USD 629.0

    Natural environment

    Average annual rainfall
    • < 250 mm
    • 251-500 mm
    • 501-750 mm
    • 751-1,000 mm
    • 1,001-1,500 mm
    • 1,501-2,000 mm
    • 2,001-3,000 mm
    • 3,001-4,000 mm
    • > 4,000 mm
    Agro-climatic zone
    • humid
    • sub-humid
    • semi-arid
    • arid
    Specifications on climate
    Average annual rainfall in mm: 1350.0
    Name of the meteorological station: Abagerima Learning Watershed meteo station
    Slope
    • flat (0-2%)
    • gentle (3-5%)
    • moderate (6-10%)
    • rolling (11-15%)
    • hilly (16-30%)
    • steep (31-60%)
    • very steep (>60%)
    Landforms
    • plateau/plains
    • ridges
    • mountain slopes
    • hill slopes
    • footslopes
    • valley floors
    Altitude
    • 0-100 m a.s.l.
    • 101-500 m a.s.l.
    • 501-1,000 m a.s.l.
    • 1,001-1,500 m a.s.l.
    • 1,501-2,000 m a.s.l.
    • 2,001-2,500 m a.s.l.
    • 2,501-3,000 m a.s.l.
    • 3,001-4,000 m a.s.l.
    • > 4,000 m a.s.l.
    Technology is applied in
    • convex situations
    • concave situations
    • not relevant
    Soil depth
    • very shallow (0-20 cm)
    • shallow (21-50 cm)
    • moderately deep (51-80 cm)
    • deep (81-120 cm)
    • very deep (> 120 cm)
    Soil texture (topsoil)
    • coarse/ light (sandy)
    • medium (loamy, silty)
    • fine/ heavy (clay)
    Soil texture (> 20 cm below surface)
    • coarse/ light (sandy)
    • medium (loamy, silty)
    • fine/ heavy (clay)
    Topsoil organic matter content
    • high (>3%)
    • medium (1-3%)
    • low (<1%)
    Groundwater table
    • on surface
    • < 5 m
    • 5-50 m
    • > 50 m
    Availability of surface water
    • excess
    • good
    • medium
    • poor/ none
    Water quality (untreated)
    • good drinking water
    • poor drinking water (treatment required)
    • for agricultural use only (irrigation)
    • unusable
    Water quality refers to: both ground and surface water
    Is salinity a problem?
    • Yes
    • No

    Occurrence of flooding
    • Yes
    • No
    Species diversity
    • high
    • medium
    • low
    Habitat diversity
    • high
    • medium
    • low

    Characteristics of land users applying the Technology

    Market orientation
    • subsistence (self-supply)
    • mixed (subsistence/ commercial)
    • commercial/ market
    Off-farm income
    • less than 10% of all income
    • 10-50% of all income
    • > 50% of all income
    Relative level of wealth
    • very poor
    • poor
    • average
    • rich
    • very rich
    Level of mechanization
    • manual work
    • animal traction
    • mechanized/ motorized
    Sedentary or nomadic
    • Sedentary
    • Semi-nomadic
    • Nomadic
    Individuals or groups
    • individual/ household
    • groups/ community
    • cooperative
    • employee (company, government)
    Gender
    • women
    • men
    Age
    • children
    • youth
    • middle-aged
    • elderly
    Area used per household
    • < 0.5 ha
    • 0.5-1 ha
    • 1-2 ha
    • 2-5 ha
    • 5-15 ha
    • 15-50 ha
    • 50-100 ha
    • 100-500 ha
    • 500-1,000 ha
    • 1,000-10,000 ha
    • > 10,000 ha
    Scale
    • small-scale
    • medium-scale
    • large-scale
    Land ownership
    • state
    • company
    • communal/ village
    • group
    • individual, not titled
    • individual, titled
    Land use rights
    • open access (unorganized)
    • communal (organized)
    • leased
    • individual
    Water use rights
    • open access (unorganized)
    • communal (organized)
    • leased
    • individual
    Access to services and infrastructure
    health

    poor
    good
    education

    poor
    good
    technical assistance

    poor
    good
    employment (e.g. off-farm)

    poor
    good
    markets

    poor
    good
    energy

    poor
    good
    roads and transport

    poor
    good
    drinking water and sanitation

    poor
    good
    financial services

    poor
    good

    Impacts

    Socio-economic impacts
    Crop production
    decreased
    increased

    crop quality
    decreased
    increased

    fodder production
    decreased
    increased

    fodder quality
    decreased
    increased

    animal production
    decreased
    increased

    wood production
    decreased
    increased

    forest/ woodland quality
    decreased
    increased

    non-wood forest production
    decreased
    increased

    product diversity
    decreased
    increased

    production area (new land under cultivation/ use)
    decreased
    increased

    land management
    hindered
    simplified

    energy generation (e.g. hydro, bio)
    decreased
    increased

    drinking water availability
    decreased
    increased

    drinking water quality
    decreased
    increased

    water availability for livestock
    decreased
    increased

    water quality for livestock
    decreased
    increased

    irrigation water availability
    decreased
    increased

    irrigation water quality
    decreased
    increased

    demand for irrigation water
    increased
    decreased

    farm income
    decreased
    increased

    diversity of income sources
    decreased
    increased

    economic disparities
    increased
    decreased

    workload
    increased
    decreased

    Socio-cultural impacts
    food security/ self-sufficiency
    reduced
    improved

    health situation
    worsened
    improved

    land use/ water rights
    worsened
    improved

    cultural opportunities (eg spiritual, aesthetic, others)
    reduced
    improved

    recreational opportunities
    reduced
    improved

    community institutions
    weakened
    strengthened

    national institutions
    weakened
    strengthened

    SLM/ land degradation knowledge
    reduced
    improved

    conflict mitigation
    worsened
    improved

    situation of socially and economically disadvantaged groups (gender, age, status, ehtnicity etc.)
    worsened
    improved

    Ecological impacts
    water quantity
    decreased
    increased

    water quality
    decreased
    increased

    harvesting/ collection of water (runoff, dew, snow, etc)
    reduced
    improved

    surface runoff
    increased
    decreased

    excess water drainage
    reduced
    improved

    groundwater table/ aquifer
    lowered
    recharge

    evaporation
    increased
    decreased

    soil moisture
    decreased
    increased

    soil cover
    reduced
    improved

    soil loss
    increased
    decreased

    soil accumulation
    decreased
    increased

    soil crusting/ sealing
    increased
    reduced

    soil compaction
    increased
    reduced

    nutrient cycling/ recharge
    decreased
    increased

    salinity
    increased
    decreased

    soil organic matter/ below ground C
    decreased
    increased

    acidity
    increased
    reduced

    vegetation cover
    decreased
    increased

    biomass/ above ground C
    decreased
    increased

    plant diversity
    decreased
    increased

    invasive alien species
    increased
    reduced

    animal diversity
    decreased
    increased

    beneficial species (predators, earthworms, pollinators)
    decreased
    increased

    habitat diversity
    decreased
    increased

    pest/ disease control
    decreased
    increased

    flood impacts
    increased
    decreased

    landslides/ debris flows
    increased
    decreased

    drought impacts
    increased
    decreased

    impacts of cyclones, rain storms
    increased
    decreased

    emission of carbon and greenhouse gases
    increased
    decreased

    fire risk
    increased
    decreased

    wind velocity
    increased
    decreased

    micro-climate
    worsened
    improved

    Off-site impacts
    water availability (groundwater, springs)
    decreased
    increased

    reliable and stable stream flows in dry season (incl. low flows)
    reduced
    increased

    downstream flooding (undesired)
    increased
    reduced

    downstream siltation
    increased
    decreased

    groundwater/ river pollution
    increased
    reduced

    buffering/ filtering capacity (by soil, vegetation, wetlands)
    reduced
    improved

    wind transported sediments
    increased
    reduced

    damage on neighbours' fields
    increased
    reduced

    damage on public/ private infrastructure
    increased
    reduced

    impact of greenhouse gases
    increased
    reduced

    Cost-benefit analysis

    Benefits compared with establishment costs
    Short-term returns
    very negative
    very positive

    Long-term returns
    very negative
    very positive

    Benefits compared with maintenance costs
    Short-term returns
    very negative
    very positive

    Long-term returns
    very negative
    very positive

    Climate change

    Gradual climate change
    annual temperature increase

    not well at all
    very well
    seasonal temperature increase

    not well at all
    very well
    Season: winter
    annual rainfall

    not well at all
    very well
    Climate-related extremes (disasters)
    local rainstorm

    not well at all
    very well
    local thunderstorm

    not well at all
    very well
    epidemic diseases

    not well at all
    very well
    insect/ worm infestation

    not well at all
    very well

    Adoption and adaptation

    Percentage of land users in the area who have adopted the Technology
    • single cases/ experimental
    • 1-10%
    • 11-50%
    • > 50%
    Of all those who have adopted the Technology, how many have done so without receiving material incentives?
    • 0-10%
    • 11-50%
    • 51-90%
    • 91-100%
    Number of households and/ or area covered
    400-480 households
    Has the Technology been modified recently to adapt to changing conditions?
    • Yes
    • No
    To which changing conditions?
    • climatic change/ extremes
    • changing markets
    • labour availability (e.g. due to migration)

    Conclusions and lessons learnt

    Strengths: land user's view
    • Grass biomass increased, run off to foot slope of cultivated land decreased, water availability increased and conflicts resolved.
      Closed area is also used as a home for wild animals.
    Strengths: compiler’s or other key resource person’s view
    • Areas are giving high forage biomass for animals.
    • Restoring the water & the vegetation cover are fine.
    • Generally the closed areas improve the livelihoods of the community due to its economical, social & environmental advantages.
    Weaknesses/ disadvantages/ risks: land user's viewhow to overcome
    • Older people complain that animals should still be allowed to openly graze. Give continuous service for the community.
    • Trees are not fully adapt to climate, environment and use. Select appropriate technology; reintroduce moisture harvesting structures (hillside terraces)
    • Resource allocation Raise external support for the Learning watershed
    Weaknesses/ disadvantages/ risks: compiler’s or other key resource person’s viewhow to overcome
    • Resources allocation & sharing of benefits Needs to be organized by group & clear bylaws for better management & sharing of resources

    References

    Compiler
    • Melese Bililign
    Editors
    Reviewer
    • Tatenda Lemann
    Date of documentation: Oct. 25, 2018
    Last update: June 4, 2019
    Resource persons
    Full description in the WOCAT database
    Linked SLM data
    Documentation was faciliated by
    Institution Project
    Key references
    • none:
    Links to relevant information which is available online
    This work is licensed under Creative Commons Attribution-NonCommercial-ShareaAlike 4.0 International