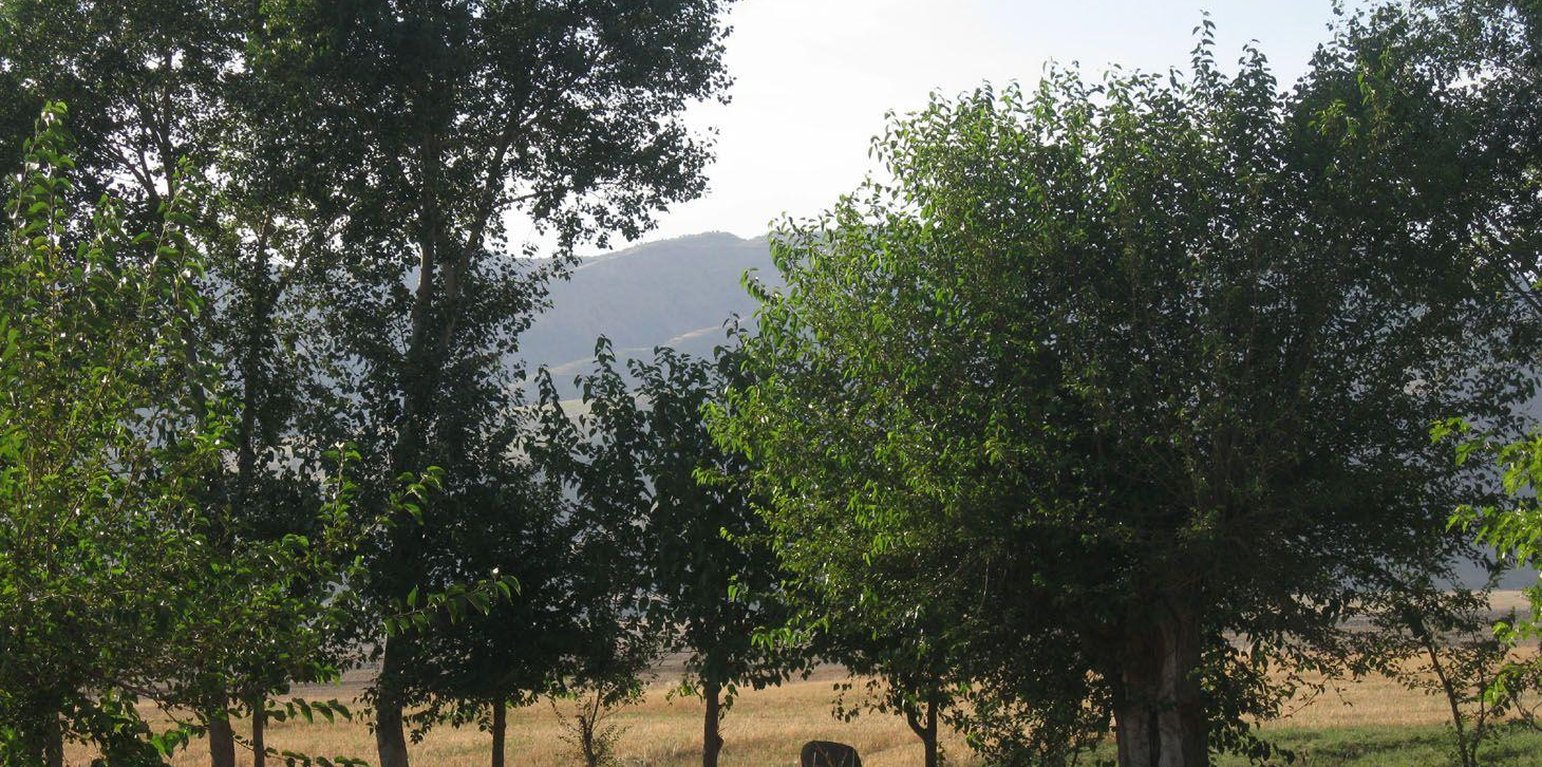
Grazing cattle in the mulberry and apple orchards (Malgorzata Conder)

Current agroforestry: orchard with wheat intercropping (Tajikistan)

Description

Current agroforestry of a degraded mulberry and apple orchard with wheat intercropping

Since 1992 an area of around one ha has been owned by the farmer. He planted mulberry trees the same year. At that time, orchards were established in the whole surrounding area because the government decreed that a territory should have plenty of mulberry trees. Despite the government plan, all the land users of that area began to switch their orchards into wheat crops. Five years later the farmer planted apple trees within the mulberry orchard. The orchard had 200 mulberry and 100 apple trees. The motivation was to feed the working farmers of the fields around. Five years later the apple trees gave fruits. But only the first two years gave a good yield and income from selling them. Later on the fruits were just eaten by the farmer’s family. After another seven or eight years the farmer grew a wheat crop in between the tree lines. Nowadays it's the only remaining orchard in that area. Due to the lack of proper maintenance and water availability the orchard is degraded and the output is very low.

Purpose of the Technology: The government established a large territory of mulberry orchards, for three reasons: First to reduce the impact of natural hazards, second to increase silk production and last to improve fire wood availability. The planting of apple trees should be beneficial for farmers working in the surrounding crops and well as for the family, who sell the fruits and the mulberry leaves. As the yield started to decrease the wheat crop was established to have a bigger output for that crop.

Establishment / maintenance activities and inputs: Due to the government’s order to establish orchards, the local authorities provided the mulberry trees. Hence, it was in the responsibility of the farmer to plant the trees and to look after them by soil loosening and pruning. The latter activity must be done once in the first five years after planting. The farmer bought the apple trees himself as they were cheap at that time. To establish the wheat crop, ploughing, seeding, fertilizing and finally harvesting must be done. One person is supposed to guard the orchard and wheat crop every day. Yearly maintenance consists of soil loosening around the fruit trees and the above mentioned task for cropping. The maintenance of the orchard seems to be abandoned more and more, probably because the output decreases year by year.

Natural / human environment: The orchard is situated below Momandion village, on the very last foot slope before the valley plain begins and, hence, it has a slight slope,. In the past, orchards were numerous, but nowadays wheat crops have mostly replaced the orchard. As there is no fence and no one to control it regularly, livestock invades the property. During its first two years there was a water source, which had dried up by the time. The orchard is a relic being the only and last one in that area. Broken branches, unpruned trees and a trampled crop, show signs of insufficient control and maintenance and therefore of a gradual abandonment of the orchard.

Location

Location: Muminabad, Khatlon, Tajikistan, Tajikistan

No. of Technology sites analysed:

Geo-reference of selected sites
  • 70.03103, 38.09097

Spread of the Technology: evenly spread over an area (approx. < 0.1 km2 (10 ha))

In a permanently protected area?:

Date of implementation: 10-50 years ago

Type of introduction
Wheat cropping between the tree rows (Malgorzata Conder)

Classification of the Technology

Main purpose
  • improve production
  • reduce, prevent, restore land degradation
  • conserve ecosystem
  • protect a watershed/ downstream areas – in combination with other Technologies
  • preserve/ improve biodiversity
  • reduce risk of disasters
  • adapt to climate change/ extremes and its impacts
  • mitigate climate change and its impacts
  • create beneficial economic impact
  • create beneficial social impact
Land use
Land use mixed within the same land unit: Yes - Agroforestry

  • Cropland
    • Annual cropping: cereals - wheat (spring)
    • Perennial (non-woody) cropping: berries
    • Tree and shrub cropping: fruits, other, pome fruits (apples, pears, quinces, etc.)
    Number of growing seasons per year: 1
    Is intercropping practiced? Yes
  • Grazing land
  • Forest/ woodlands

Water supply
  • rainfed
  • mixed rainfed-irrigated
  • full irrigation

Purpose related to land degradation
  • prevent land degradation
  • reduce land degradation
  • restore/ rehabilitate severely degraded land
  • adapt to land degradation
  • not applicable
Degradation addressed
  • physical soil deterioration - Pc: compaction, Pk: slaking and crusting
  • biological degradation - Bc: reduction of vegetation cover
SLM group
  • agroforestry
  • rotational systems (crop rotation, fallows, shifting cultivation)
SLM measures
  • agronomic measures - A1: Vegetation/ soil cover
  • vegetative measures - V1: Tree and shrub cover

Technical drawing

Technical specifications

Establishment and maintenance: activities, inputs and costs

Calculation of inputs and costs
  • Costs are calculated:
  • Currency used for cost calculation: Somoni
  • Exchange rate (to USD): 1 USD = 4.83 Somoni
  • Average wage cost of hired labour per day: 12.40
Most important factors affecting the costs
Labour is the most important input, but as it is done mostly by the farmer or the family itself it's mainly agricultural material as seedlings, seeds and fertilizer. Latter particularly as recurrent costs.
Establishment activities
  1. Buying, transport and planting of mulberry trees, 10 days (7 hours/day), 3 people (Timing/ frequency: once, 1992)
  2. Buying, transport and planting of apple trees, 5 days (7 hours/day), 3 people (Timing/ frequency: once, 1997)
Establishment inputs and costs
Specify input Unit Quantity Costs per Unit (Somoni) Total costs per input (Somoni) % of costs borne by land users
Labour
Labour ha 1.0 497.4 497.4 100.0
Plant material
Seedlings ha 1.0 311.0 311.0 33.0
Total costs for establishment of the Technology 808.4
Total costs for establishment of the Technology in USD 167.37
Maintenance activities
  1. Plowing vertically, 4 hours of labour, tractor and petrol (Timing/ frequency: every year, spring (since 2007))
  2. Buying (200 kg) and sowing wheat, 2 hours, 3 persons (Timing/ frequency: every year, spring (since 2007))
  3. Applying fertilizer, 2 hours, 1 person, 2 bucks à 50 kg (Timing/ frequency: once a year, september)
  4. Cutting wheat, 4-5 days (6 hours/ day), 4 people (Timing/ frequency: September, once a year)
  5. Guardening (Timing/ frequency: every day)
  6. loosening around trees (ca. on 1/3 of the trees), 4-5 trees a day (Timing/ frequency: every year, spring)
  7. pruning (ca. 1/2 of mulberry trees), 7-8 days (2-3 hours/ day), 3 persons (Timing/ frequency: every year, autumn)
Maintenance inputs and costs
Specify input Unit Quantity Costs per Unit (Somoni) Total costs per input (Somoni) % of costs borne by land users
Labour
Labour ha 1.0 572.2 572.2 100.0
Equipment
Machine use ha 1.0 24.8 24.8 100.0
Petrol l 25.0 28.5 712.5 100.0
Plant material
Seeds ha 1.0 82.8 82.8 100.0
Fertilizers and biocides
Fertilizer ha 1.0 76.6 76.6 100.0
Total costs for maintenance of the Technology 1'468.9
Total costs for maintenance of the Technology in USD 304.12

Natural environment

Average annual rainfall
  • < 250 mm
  • 251-500 mm
  • 501-750 mm
  • 751-1,000 mm
  • 1,001-1,500 mm
  • 1,501-2,000 mm
  • 2,001-3,000 mm
  • 3,001-4,000 mm
  • > 4,000 mm
Agro-climatic zone
  • humid
  • sub-humid
  • semi-arid
  • arid
Specifications on climate
Totally 800 mm: 700mm in winter-spring, July-Sept dry season
Thermal climate class: temperate, LPG from end of March until September
Slope
  • flat (0-2%)
  • gentle (3-5%)
  • moderate (6-10%)
  • rolling (11-15%)
  • hilly (16-30%)
  • steep (31-60%)
  • very steep (>60%)
Landforms
  • plateau/plains
  • ridges
  • mountain slopes
  • hill slopes
  • footslopes
  • valley floors
Altitude
  • 0-100 m a.s.l.
  • 101-500 m a.s.l.
  • 501-1,000 m a.s.l.
  • 1,001-1,500 m a.s.l.
  • 1,501-2,000 m a.s.l.
  • 2,001-2,500 m a.s.l.
  • 2,501-3,000 m a.s.l.
  • 3,001-4,000 m a.s.l.
  • > 4,000 m a.s.l.
Technology is applied in
  • convex situations
  • concave situations
  • not relevant
Soil depth
  • very shallow (0-20 cm)
  • shallow (21-50 cm)
  • moderately deep (51-80 cm)
  • deep (81-120 cm)
  • very deep (> 120 cm)
Soil texture (topsoil)
  • coarse/ light (sandy)
  • medium (loamy, silty)
  • fine/ heavy (clay)
Soil texture (> 20 cm below surface)
  • coarse/ light (sandy)
  • medium (loamy, silty)
  • fine/ heavy (clay)
Topsoil organic matter content
  • high (>3%)
  • medium (1-3%)
  • low (<1%)
Groundwater table
  • on surface
  • < 5 m
  • 5-50 m
  • > 50 m
Availability of surface water
  • excess
  • good
  • medium
  • poor/ none
Water quality (untreated)
  • good drinking water
  • poor drinking water (treatment required)
  • for agricultural use only (irrigation)
  • unusable
Water quality refers to:
Is salinity a problem?
  • Yes
  • No

Occurrence of flooding
  • Yes
  • No
Species diversity
  • high
  • medium
  • low
Habitat diversity
  • high
  • medium
  • low

Characteristics of land users applying the Technology

Market orientation
  • subsistence (self-supply)
  • mixed (subsistence/ commercial)
  • commercial/ market
Off-farm income
  • less than 10% of all income
  • 10-50% of all income
  • > 50% of all income
Relative level of wealth
  • very poor
  • poor
  • average
  • rich
  • very rich
Level of mechanization
  • manual work
  • animal traction
  • mechanized/ motorized
Sedentary or nomadic
  • Sedentary
  • Semi-nomadic
  • Nomadic
Individuals or groups
  • individual/ household
  • groups/ community
  • cooperative
  • employee (company, government)
Gender
  • women
  • men
Age
  • children
  • youth
  • middle-aged
  • elderly
Area used per household
  • < 0.5 ha
  • 0.5-1 ha
  • 1-2 ha
  • 2-5 ha
  • 5-15 ha
  • 15-50 ha
  • 50-100 ha
  • 100-500 ha
  • 500-1,000 ha
  • 1,000-10,000 ha
  • > 10,000 ha
Scale
  • small-scale
  • medium-scale
  • large-scale
Land ownership
  • state
  • company
  • communal/ village
  • group
  • individual, not titled
  • individual, titled
Land use rights
  • open access (unorganized)
  • communal (organized)
  • leased
  • individual
Water use rights
  • open access (unorganized)
  • communal (organized)
  • leased
  • individual
Access to services and infrastructure
health

poor
good
education

poor
good
technical assistance

poor
good
employment (e.g. off-farm)

poor
good
markets

poor
good
energy

poor
good
roads and transport

poor
good
drinking water and sanitation

poor
good
financial services

poor
good

Impacts

Socio-economic impacts
Crop production
decreased
increased


less apple and wheat production

risk of production failure
increased
decreased

irrigation water availability
decreased
increased


First 2 years water source, which dried out later on

irrigation water quality
decreased
increased


First 2 years water source, which dried out later on

demand for irrigation water
increased
decreased


First 2 years water source, which dried out later on

expenses on agricultural inputs
increased
decreased


More fertilizer and pesticides needed than in the past

farm income
decreased
increased


Reduced crop production and fruit yield

workload
increased
decreased


less maintenance work

Socio-cultural impacts
food security/ self-sufficiency
reduced
improved

situation of socially and economically disadvantaged groups (gender, age, status, ehtnicity etc.)
worsened
improved


Mulberries were shared with other people working next to the field (no fence)

Ecological impacts
water quantity
decreased
increased

surface runoff
increased
decreased


negligible thanks to a little slope

evaporation
increased
decreased

soil moisture
decreased
increased

soil cover
reduced
improved

soil crusting/ sealing
increased
reduced

soil compaction
increased
reduced

soil organic matter/ below ground C
decreased
increased

Off-site impacts
buffering/ filtering capacity (by soil, vegetation, wetlands)
reduced
improved

Cost-benefit analysis

Benefits compared with establishment costs
Benefits compared with maintenance costs

Climate change

Gradual climate change
annual temperature increase

not well at all
very well
Answer: not known
Climate-related extremes (disasters)
local rainstorm

not well at all
very well
local windstorm

not well at all
very well
drought

not well at all
very well
general (river) flood

not well at all
very well
Other climate-related consequences
reduced growing period

not well at all
very well

Adoption and adaptation

Percentage of land users in the area who have adopted the Technology
  • single cases/ experimental
  • 1-10%
  • 11-50%
  • > 50%
Of all those who have adopted the Technology, how many have done so without receiving material incentives?
  • 0-10%
  • 11-50%
  • 51-90%
  • 91-100%
Has the Technology been modified recently to adapt to changing conditions?
  • Yes
  • No
To which changing conditions?
  • climatic change/ extremes
  • changing markets
  • labour availability (e.g. due to migration)

Conclusions and lessons learnt

Strengths: land user's view
  • The orchard gave by-product as leaves for silk production and branches.
Strengths: compiler’s or other key resource person’s view
  • It is the only orchard in the neighbourhood, which is why it would be worthy to maintain it.

    How can they be sustained / enhanced? Put more effort and labour into the orchard, currently only the wheat crops seems to be of interest for the farmer.
Weaknesses/ disadvantages/ risks: land user's viewhow to overcome
  • Currently the orchard is too old to get a good yield and maintenance activities are comparatively high.
Weaknesses/ disadvantages/ risks: compiler’s or other key resource person’s viewhow to overcome
  • Lack of maintenance and guarding or fencing. More focus on the orchard as it has also ecological benefits. Enhance the farmer to put more labour into the orchard.
  • None Show good examples of orchards and their resulting benefits. Round tables by and for farmers to share experiences.

References

Compiler
  • Malgorzata Conder
Editors
Reviewer
  • Fabian Ottiger
  • Alexandra Gavilano
Date of documentation: Jan. 14, 2013
Last update: Aug. 21, 2019
Resource persons
Full description in the WOCAT database
Linked SLM data
Documentation was faciliated by
Institution Project
This work is licensed under Creative Commons Attribution-NonCommercial-ShareaAlike 4.0 International