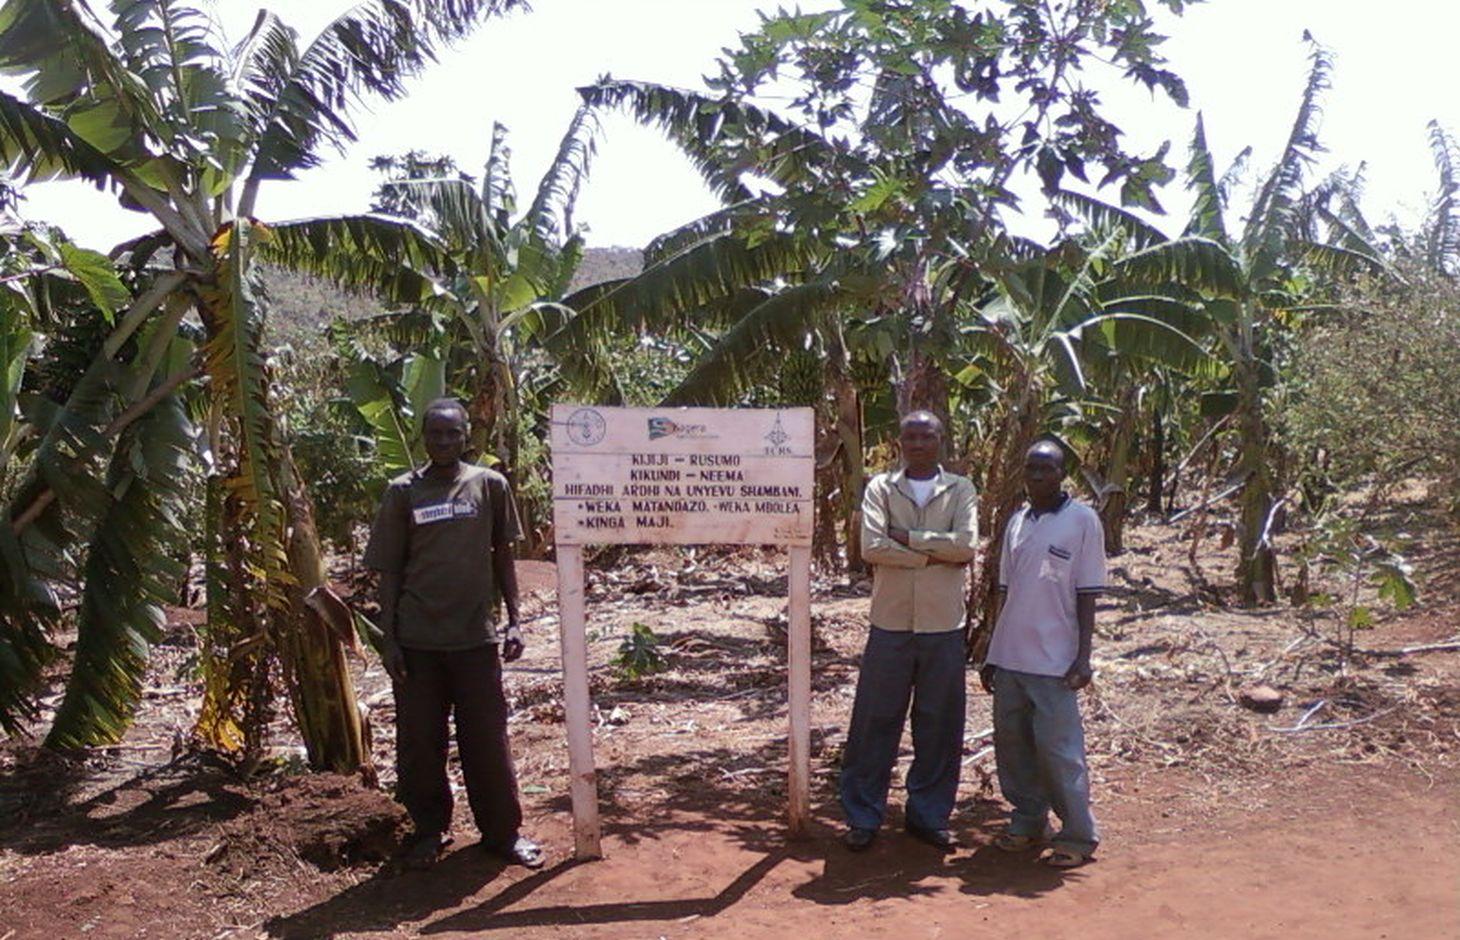
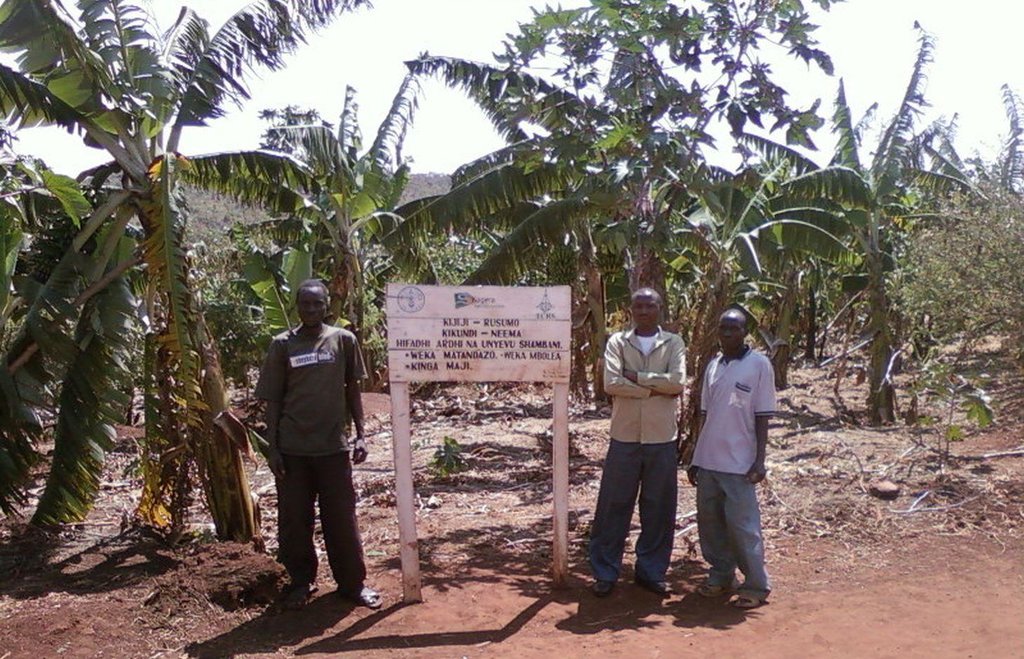
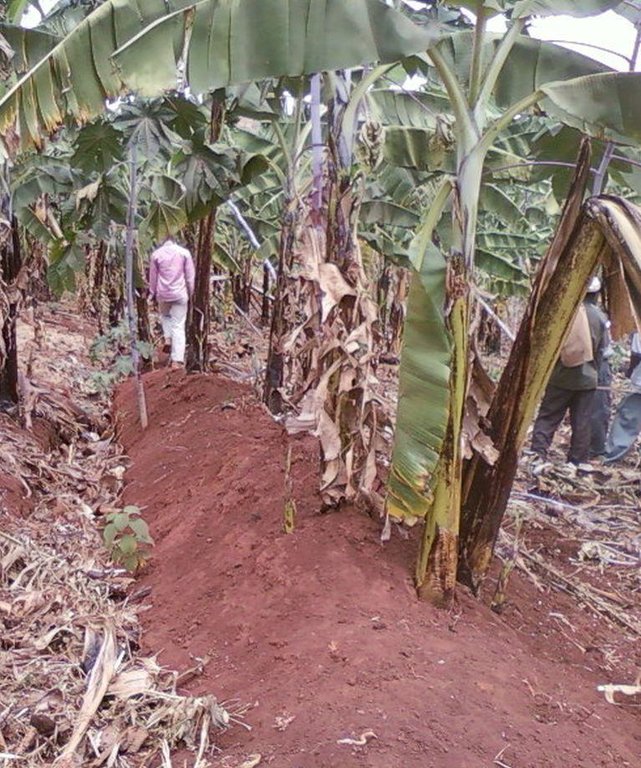
Cross slope berier characterised with furrow, bund, cajanus cajan, pinepples, farm yard manures and grass mulch in banana production [Tanzania, United Republic of]
- Creation:
- Update:
- Compiler: Godfrey Baraba
- Editor: –
- Reviewer: Deborah Niggli
Fanya chin fanya juu
technologies_1232 - Tanzania, United Republic of
- Full summary as PDF
- Full summary as PDF for print
- Full summary in the browser
- Full summary (unformatted)
- Cross slope berier characterised with furrow, bund, cajanus cajan, pinepples, farm yard manures and grass mulch in banana production: Jan. 5, 2017 (inactive)
- Cross slope berier characterised with furrow, bund, cajanus cajan, pinepples, farm yard manures and grass mulch in banana production: Aug. 6, 2019 (public)
View sections
Expand all Collapse all1. General information
1.2 Contact details of resource persons and institutions involved in the assessment and documentation of the Technology
SLM specialist:
1.3 Conditions regarding the use of data documented through WOCAT
When were the data compiled (in the field)?
25/07/2014
The compiler and key resource person(s) accept the conditions regarding the use of data documented through WOCAT:
Yes
1.4 Declaration on sustainability of the described Technology
Is the Technology described here problematic with regard to land degradation, so that it cannot be declared a sustainable land management technology?
No
2. Description of the SLM Technology
2.1 Short description of the Technology
Definition of the Technology:
Is the cross slope berrier charactrised by contour bunds, cajanus can, pineapples, farm yard manures and grass mulch in banana production.
2.2 Detailed description of the Technology
Description:
The contour band stabilized with cajanus cajan and pineapples in the composite manures and trushline application technology is the digging of a 0.6m wide by 0.6m deep along the demarcated contour line, while two rows of cajanus cajan planted along the band spaced at 0.3m and two rows of pineapples at alternating band spaced at 0.3m. The overall purpose of the technology is to reduce soil erosions while increasing soil water infiltration and retaining soil water moisture. The technology is applied perennial cropland in the sub humid climatic zone on the gentle to moderate slope, loam soils with medium soil depth. The technology is done manually using hand hoes and mattock in a mixed production system, land owned individually not titled while the total cost to implement a technology on 0.2ha in the banana field was calculated to be US$ …..
The purpose is to increase land productivity, improve livelihood as well as improved ecosystem and micro climate. This should be attained by improving water use efficiency, soil fertility inprovement to increase crop productivity and generating incomes.
The establishment procedures require the determination of the slope and demarcation of a contour line using a tool known as A-frame. This is done manually during the rainy season. The digging and excavation of the soils is done at the end of harvesting annual crops (bean and maize) using hand hoes manually. The cajanus cajan seeds are sown in two rows along the band and the next band is planted with two rows of pinepples at 0.3m between rows as well as between plants. The shallow ditch measuring 0.6m by 0.6m is excavated at the centre of four banana stools to collect crop residues to decompose and apply them. Old banana stools are up rooted at the end of rain season while measurements and digging of holes done. The spacing is 3.6m by 3.6m for the planted medium variety. The hole measurements is 0.6m width by 0.6m length by 0.3m depth. The farmyard manures are mixed with top soils and covered in the hole for three months before planting. The planting is done before the onset of rainfalls. The dry grass mulch is applied across the slope with a thickness of 0.15m at the onset of rainfalls.
The maintenance procedures require the remove of sedments at the end of rainseason done manually using spades. The trimming of cajanus cajan and pineapples are done manually during the harvesting season. Desuckering and detrushing of banana plants are done twice after harvesting annual crops while grass mulch followed.
Average annual rainfall (750 to 1,000)mm, Altitude (m a.s.l.) (1,000 -1,500)m Landform is hill slope to foot slope, Soil depth (>20 cm) shallow about 20%, (20-50cm) medium about 60% and (50-80cm) deep about 20%, Soil water storage capacity: medium, Soil texture: medium (loam), Soil fertility: low, Topsoil organic matter: medium (1-3%) and Soil drainage/infiltration: medium. Cropland per household is 2-5 ha, Land user are Individual / household, Small scale land users, common / average land users, men and women. Population density: 200-500 persons/km2, Annual population growth: < 0.5%, Land ownership: individual, not titled Land use rights: individual, Water use rights: open access (unorganised) Relative level of wealth: rich, which represents 5% of the land users; 21% of the total area is owned by rich land users average, which represents 64% of the land users; 64% of the total area is owned by average land users poor, which represents 21% of the land users; 5% of the total area is owned by poor land users Market orientation: mixed (subsistence and commercial) Mechanization: manual labour
2.3 Photos of the Technology
2.5 Country/ region/ locations where the Technology has been applied and which are covered by this assessment
Country:
Tanzania, United Republic of
Region/ State/ Province:
Tanzania
Further specification of location:
Ngara District Council
2.6 Date of implementation
If precise year is not known, indicate approximate date:
- less than 10 years ago (recently)
2.7 Introduction of the Technology
Specify how the Technology was introduced:
- through projects/ external interventions
Comments (type of project, etc.):
The technology was introduced in 2012 using FFS metodology (at host farmer sites) and results demonstration (at FEC) as a choice of technology.
3. Classification of the SLM Technology
3.1 Main purpose(s) of the Technology
- improve production
- reduce, prevent, restore land degradation
3.2 Current land use type(s) where the Technology is applied

Cropland
- Perennial (non-woody) cropping
Comments:
Major land use problems (compiler’s opinion): The major land use problem relatrd to soil, water and vegetation in the area without conservation was loss of soil water moisture, reduced soil nutrients and soil erosion.
Major land use problems (land users’ perception): The major land use problem related to soil, water and vegetation without conservation was declining soil productivity.
3.3 Further information about land use
Water supply for the land on which the Technology is applied:
- rainfed
Number of growing seasons per year:
- 2
Specify:
Longest growing period in days: 120, Longest growing period from month to month: September to December; Second longest growing period in days: 90, Second longest growing period from month to month: March to May
3.4 SLM group to which the Technology belongs
- cross-slope measure
3.5 Spread of the Technology
Specify the spread of the Technology:
- evenly spread over an area
If the Technology is evenly spread over an area, indicate approximate area covered:
- < 0.1 km2 (10 ha)
Comments:
Three host farmers isued 1.5 acres as site implimentation other 32 group members required to do what they learned at their homes.
3.6 SLM measures comprising the Technology
agronomic measures
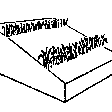
- A2: Organic matter/ soil fertility
vegetative measures
- V2: Grasses and perennial herbaceous plants
structural measures
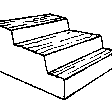
- S2: Bunds, banks
Comments:
Type of agronomic measures: mulching, legume inter-planting, manure / compost / residues
Type of vegetative measures: aligned: -contour, aligned: -linear
3.7 Main types of land degradation addressed by the Technology
soil erosion by water
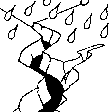
- Wt: loss of topsoil/ surface erosion
chemical soil deterioration
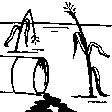
- Cn: fertility decline and reduced organic matter content (not caused by erosion)

biological degradation
- Bq: quantity/ biomass decline
- Bl: loss of soil life
Comments:
Main causes of degradation: soil management (Cultivation along the slope), disturbance of water cycle (infiltration / runoff) (cultivation along the slope), change of seasonal rainfall (un determined rainfall parterns), droughts (the area normally experiences a long dry spell of about 290 days), population pressure (croping along the slope and natural forests), poverty / wealth (Land user can not afford to invest in land conservation), education, access to knowledge and support services (lInadequate staffing to diseminate technology massages.), governance / institutional (weak environmental law inforcements and lack of community sensitization..)
3.8 Prevention, reduction, or restoration of land degradation
Specify the goal of the Technology with regard to land degradation:
- prevent land degradation
- reduce land degradation
4. Technical specifications, implementation activities, inputs, and costs
4.1 Technical drawing of the Technology
Author:
Baraba Godfrey, C/O DED Bukoba, P.O.BOX 491 Bukoba, Tanzania
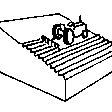
4.2 Technical specifications/ explanations of technical drawing
Furrow measurements is 0.6m wide by 0.6m deep across the slope; space between the structure is 18m, banana space is 3.6m by 3.6m; grass mulch thickness is 0.15m and composite is prepared at the center of four banana stools to be applied topically in the shallow furrow towards the grand daughter banana sacker.
Location: Rwabilulu sub village, Rusumo village. Ngara/Kagera/Tanzania
Date: 25/07/2014
Technical knowledge required for field staff / advisors: low (The technology basic principles are taught at colleges.)
Technical knowledge required for land users: moderate (Slope measurements and use of A-frame is a new idea to land users .)
Main technical functions: control of raindrop splash, control of dispersed runoff: retain / trap, control of dispersed runoff: impede / retard, reduction of slope length, stabilisation of soil (eg by tree roots against land slides), increase in organic matter, increase in nutrient availability (supply, recycling,…), increase of infiltration, increase / maintain water stored in soil
Secondary technical functions: control of concentrated runoff: retain / trap, increase of biomass (quantity)
Mulching
Material/ species: grass mulch
Quantity/ density: 1500
Remarks: spread across the slope with thckess 0.15m
Legume inter-planting
Quantity/ density: 0.25
Remarks: dibling betwen the structure
Manure / compost / residues
Material/ species: composite manures
Quantity/ density: 0.036
Remarks: mixed with soil in shallow furrow facing the grand daughter banana sucker
Aligned: -contour
Vegetative material: F : fruit trees / shrubs, O : other
Number of plants per (ha): 35
Aligned: -linear
Vegetative material: C : perennial crops
Number of plants per (ha): 714
Trees/ shrubs species: perennial fodder
Perennial crops species: banana
Other species: pinepples
Construction material (earth): excavated soils
Slope (which determines the spacing indicated above): 2%
Vegetation is used for stabilisation of structures.
4.3 General information regarding the calculation of inputs and costs
other/ national currency (specify):
TShs.
Indicate exchange rate from USD to local currency (if relevant): 1 USD =:
1700.0
Indicate average wage cost of hired labour per day:
2.06
4.4 Establishment activities
| Activity | Type of measure | Timing | |
|---|---|---|---|
| 1. | Ploughung | Vegetative | once at the end of short rainfals |
| 2. | Harrowing | Vegetative | Mid of dry spel |
| 3. | Spacing and demarcating holes | Vegetative | mid of dry spel |
| 4. | Digging holes | Vegetative | mid of dry spel |
| 5. | mixing farm yard manures | Vegetative | mid of dry spel |
| 6. | Planting banana suckers | Vegetative | lat dry spale |
| 7. | Sowing cajanus cajan | Vegetative | on set of long rainfals |
| 8. | Planting pinepples | Vegetative | on sertof long rainfals |
| 9. | To demarcate contour line | Structural | the end of short rainfall |
| 10. | To dig the furrow | Structural | at the end of dry spel |
4.5 Costs and inputs needed for establishment
| Specify input | Unit | Quantity | Costs per Unit | Total costs per input | % of costs borne by land users | |
|---|---|---|---|---|---|---|
| Labour | labour | ha | 1.0 | 1696.85 | 1696.85 | |
| Equipment | tools | ha | 1.0 | 4.71 | 4.71 | 100.0 |
| Plant material | seedlings | ha | 1.0 | 433.89 | 433.89 | |
| Total costs for establishment of the Technology | 2135.45 | |||||
Comments:
Duration of establishment phase: 12 month(s)
4.6 Maintenance/ recurrent activities
| Activity | Type of measure | Timing/ frequency | |
|---|---|---|---|
| 1. | weeding | Agronomic | Twice in the midle of rainfals |
| 2. | Desuckering | Agronomic | Twice in the midle of rainfals |
| 3. | Detrushing | Agronomic | Twice in the middle rainfals |
| 4. | Mulching | Agronomic | once at the end of dry spel |
| 5. | Banana weevils trapping | Agronomic | routenely |
| 6. | manures appliacation | Agronomic | at the end od dry spel |
| 7. | Sowing beans | Agronomic | once in the long rainfals |
| 8. | To prune cajanus cajan | Vegetative | routenly |
| 9. | To remove soil sediment | Structural | twice at the end of raifals |
4.7 Costs and inputs needed for maintenance/ recurrent activities (per year)
| Specify input | Unit | Quantity | Costs per Unit | Total costs per input | % of costs borne by land users | |
|---|---|---|---|---|---|---|
| Labour | labour | ha | 1.0 | 205.88 | 205.88 | 100.0 |
| Total costs for maintenance of the Technology | 205.88 | |||||
Comments:
The costs for agronomic measures calculated per 0.2 hectors the converted to per hectare. The costs for vegetative calculated per number of plants in 0.2 ha the converted per hectare and the costs for structural measures calculated per total length of structures foun in 0.2 ha then converted per hectare,
4.8 Most important factors affecting the costs
Describe the most determinate factors affecting the costs:
The most determinate factors are labour light indicating the technology to be labour intensive in nature.
5. Natural and human environment
5.1 Climate
Annual rainfall
- < 250 mm
- 251-500 mm
- 501-750 mm
- 751-1,000 mm
- 1,001-1,500 mm
- 1,501-2,000 mm
- 2,001-3,000 mm
- 3,001-4,000 mm
- > 4,000 mm
Specifications/ comments on rainfall:
long rains September to December, short rainsMarch to May.
Agro-climatic zone
- sub-humid
Thermal climate class: tropics
5.2 Topography
Slopes on average:
- flat (0-2%)
- gentle (3-5%)
- moderate (6-10%)
- rolling (11-15%)
- hilly (16-30%)
- steep (31-60%)
- very steep (>60%)
Landforms:
- plateau/plains
- ridges
- mountain slopes
- hill slopes
- footslopes
- valley floors
Altitudinal zone:
- 0-100 m a.s.l.
- 101-500 m a.s.l.
- 501-1,000 m a.s.l.
- 1,001-1,500 m a.s.l.
- 1,501-2,000 m a.s.l.
- 2,001-2,500 m a.s.l.
- 2,501-3,000 m a.s.l.
- 3,001-4,000 m a.s.l.
- > 4,000 m a.s.l.
5.3 Soils
Soil depth on average:
- very shallow (0-20 cm)
- shallow (21-50 cm)
- moderately deep (51-80 cm)
- deep (81-120 cm)
- very deep (> 120 cm)
Soil texture (topsoil):
- medium (loamy, silty)
Topsoil organic matter:
- medium (1-3%)
- low (<1%)
5.6 Characteristics of land users applying the Technology
Market orientation of production system:
- mixed (subsistence/ commercial
Off-farm income:
- less than 10% of all income
Individuals or groups:
- individual/ household
Level of mechanization:
- manual work
Gender:
- women
- men
Indicate other relevant characteristics of the land users:
Land users applying the Technology are mainly common / average land users
Population density: 200-500 persons/km2
Annual population growth: < 0.5%
Relative level of wealth: rich, average, poor
5% of the land users are rich and own 21% of the land.
64% of the land users are average wealthy and own 64% of the land.
21% of the land users are poor and own 5% of the land.
Off-farm income specification: Increased crop productivity from the use of technology has revealed excess crop produce for sale and sustain the house hold solely fro farm income.
5.7 Average area of land owned or leased by land users applying the Technology
- < 0.5 ha
- 0.5-1 ha
- 1-2 ha
- 2-5 ha
- 5-15 ha
- 15-50 ha
- 50-100 ha
- 100-500 ha
- 500-1,000 ha
- 1,000-10,000 ha
- > 10,000 ha
Is this considered small-, medium- or large-scale (referring to local context)?
- small-scale
5.8 Land ownership, land use rights, and water use rights
Land ownership:
- individual, not titled
Land use rights:
- individual
Water use rights:
- open access (unorganized)
5.9 Access to services and infrastructure
health:
- poor
- moderate
- good
education:
- poor
- moderate
- good
technical assistance:
- poor
- moderate
- good
employment (e.g. off-farm):
- poor
- moderate
- good
markets:
- poor
- moderate
- good
energy:
- poor
- moderate
- good
roads and transport:
- poor
- moderate
- good
drinking water and sanitation:
- poor
- moderate
- good
financial services:
- poor
- moderate
- good
6. Impacts and concluding statements
6.1 On-site impacts the Technology has shown
Socio-economic impacts
Production
crop production
Quantity before SLM:
5
Quantity after SLM:
24
Comments/ specify:
banana
Income and costs
expenses on agricultural inputs
Comments/ specify:
costs of manures, certified banana suckers
farm income
Comments/ specify:
sales of excess banana, beans and pinepples.
diversity of income sources
Quantity before SLM:
0
Quantity after SLM:
1
Comments/ specify:
sales of beans and pinepples
workload
Comments/ specify:
additonal activities at the sama season.
Socio-cultural impacts
food security/ self-sufficiency
Comments/ specify:
Household devoted labor to invrease productivity.
community institutions
Comments/ specify:
working as group on the training sites.
national institutions
Comments/ specify:
private service providers participation in project implementation.
SLM/ land degradation knowledge
Comments/ specify:
group members attended FFS
conflict mitigation
Quantity before SLM:
0
Quantity after SLM:
25
situation of socially and economically disadvantaged groups
Comments/ specify:
group formation considered gender equality
contribution to human well-being
Comments/ specify:
The technology maturity age of 18 months is too young to measure the livelihood indicators, though a positive perception is at hand.
Ecological impacts
Water cycle/ runoff
surface runoff
Comments/ specify:
contour
excess water drainage
Comments/ specify:
contour
evaporation
Comments/ specify:
grass mulch
Soil
soil moisture
Comments/ specify:
grass mulch
soil cover
Comments/ specify:
grass mulch
soil loss
Comments/ specify:
grass mulch to prevent soil erosion
nutrient cycling/ recharge
Comments/ specify:
cajanus cajan
soil organic matter/ below ground C
Comments/ specify:
composite manures application
Biodiversity: vegetation, animals
biomass/ above ground C
Comments/ specify:
grass mulch
Climate and disaster risk reduction
emission of carbon and greenhouse gases
Comments/ specify:
Composite manure utilization
6.2 Off-site impacts the Technology has shown
downstream flooding
Comments/ specify:
The area is too small to show the effects.
damage on neighbours' fields
Comments/ specify:
grass mulch retrds water run-off
damage on public/ private infrastructure
6.3 Exposure and sensitivity of the Technology to gradual climate change and climate-related extremes/ disasters (as perceived by land users)
Gradual climate change
Gradual climate change
| Season | Type of climatic change/ extreme | How does the Technology cope with it? | |
|---|---|---|---|
| annual temperature | increase | not known |
Climate-related extremes (disasters)
Meteorological disasters
| How does the Technology cope with it? | |
|---|---|
| local rainstorm | well |
Climatological disasters
| How does the Technology cope with it? | |
|---|---|
| drought | well |
Hydrological disasters
| How does the Technology cope with it? | |
|---|---|
| general (river) flood | not well |
Comments:
The technology could be modified by introducing the water spillways in heavy rainfalls and collect the water in reservor to be used during the dry spells.
6.4 Cost-benefit analysis
How do the benefits compare with the establishment costs (from land users’ perspective)?
Short-term returns:
slightly negative
Long-term returns:
positive
How do the benefits compare with the maintenance/ recurrent costs (from land users' perspective)?
Short-term returns:
slightly negative
Long-term returns:
slightly positive
Comments:
The cumulative accrues for three years should cover the establishment costs and while for the long period there will be no further establishments.
The maintenance costs for the first three years is greater than the returns while in the long run the increased productivity should overdue the maintenance costs.
6.5 Adoption of the Technology
Of all those who have adopted the Technology, how many have did so spontaneously, i.e. without receiving any material incentives/ payments?
- 50-90%
Comments:
12% of land user families have adopted the Technology with external material support
25 land user families have adopted the Technology with external material support
Only 3 host farners out of 25 total group members were supplied of certified banana suckers and grass mulch.
88% of land user families have adopted the Technology without any external material support
25 land user families have adopted the Technology without any external material support
23 group members were adopted with modification the technology at there own full costs.
There is a little trend towards spontaneous adoption of the Technology. The adoption with modification is high, but these modification tends to diverge from the SaLM though productivity is attained.
6.7 Strengths/ advantages/ opportunities of the Technology
| Strengths/ advantages/ opportunities in the compiler’s or other key resource person’s view |
|---|
| Increased land productivity: The furrow has increased water infiltration and reduced blue water evaporation.Cajanus cajan has stabilised the soil on the riser while improving nutrient cycling. Certified banana suckers has reduced production failure. micro climate |
| Improved livelihood: Increased banana productivity form 4 tones per hectare to 9 tones per hectare should ensure food security as well as income. |
| Improved ecosystem: prevent, mitigate and rehabilitate degradation |
| The technology is easy to learn and apply. |
6.8 Weaknesses/ disadvantages/ risks of the Technology and ways of overcoming them
| Weaknesses/ disadvantages/ risks in the compiler’s or other key resource person’s view | How can they be overcome? |
|---|---|
| Increased labour constraints to dig and excavate the furrow. | Reduce out migration of labour. |
| Increased farm input costs to purchase certified banana suckers and cajanus cajan seeds. | Establish banana nursries at local levels. |
7. References and links
7.1 Methods/ sources of information
- field visits, field surveys
- interviews with land users
Links and modules
Expand all Collapse allLinks
No links
Modules
No modules


