Ground water fed fish ponds [Uganda]
- Creation:
- Update:
- Compiler: Kamugisha Rick Nelson
- Editors: JOY TUKAHIRWA, Richard Otto Kawawa, Bernard Fungo
- Reviewers: John Stephen Tenywa, Nicole Harari, Renate Fleiner, Stephanie Jaquet, Donia Mühlematter
Pii it Pi Gwooko Rec
technologies_2796 - Uganda
View sections
Expand all Collapse all1. General information
1.2 Contact details of resource persons and institutions involved in the assessment and documentation of the Technology
Key resource person(s)
land user:
Okot Parikinson
Commercail farmer
Oyam South Village, Lamwo District
Uganda
Name of project which facilitated the documentation/ evaluation of the Technology (if relevant)
Scaling-up SLM practices by smallholder farmers (IFAD)Name of the institution(s) which facilitated the documentation/ evaluation of the Technology (if relevant)
CDE Centre for Development and Environment (CDE Centre for Development and Environment) - Switzerland1.3 Conditions regarding the use of data documented through WOCAT
When were the data compiled (in the field)?
12/05/2017
The compiler and key resource person(s) accept the conditions regarding the use of data documented through WOCAT:
Yes
1.4 Declaration on sustainability of the described Technology
Is the Technology described here problematic with regard to land degradation, so that it cannot be declared a sustainable land management technology?
No
Comments:
A high water table is favourable for digging shallow water wells for irrigation of cropland which increases production during the dry season.
2. Description of the SLM Technology
2.1 Short description of the Technology
Definition of the Technology:
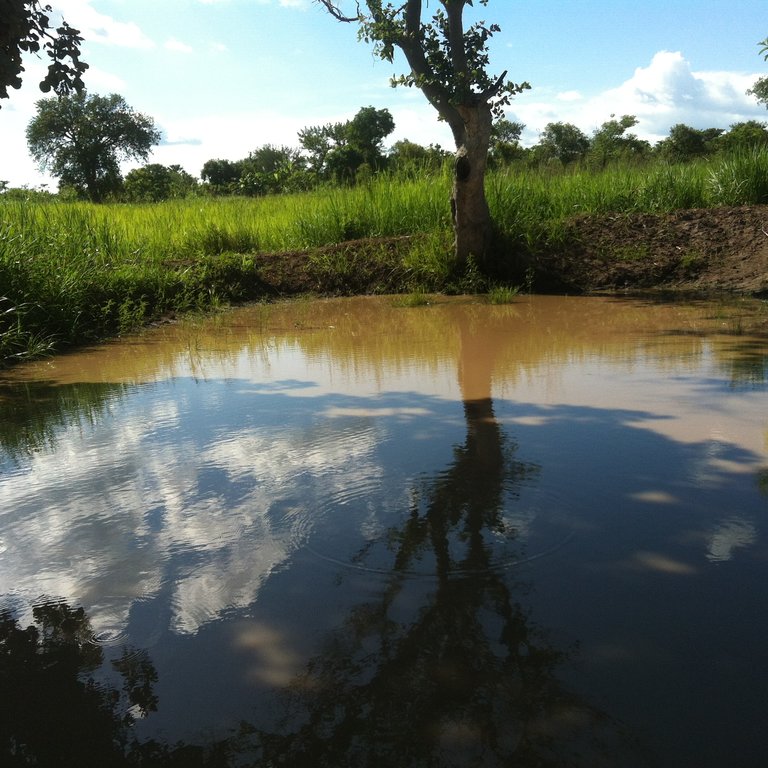
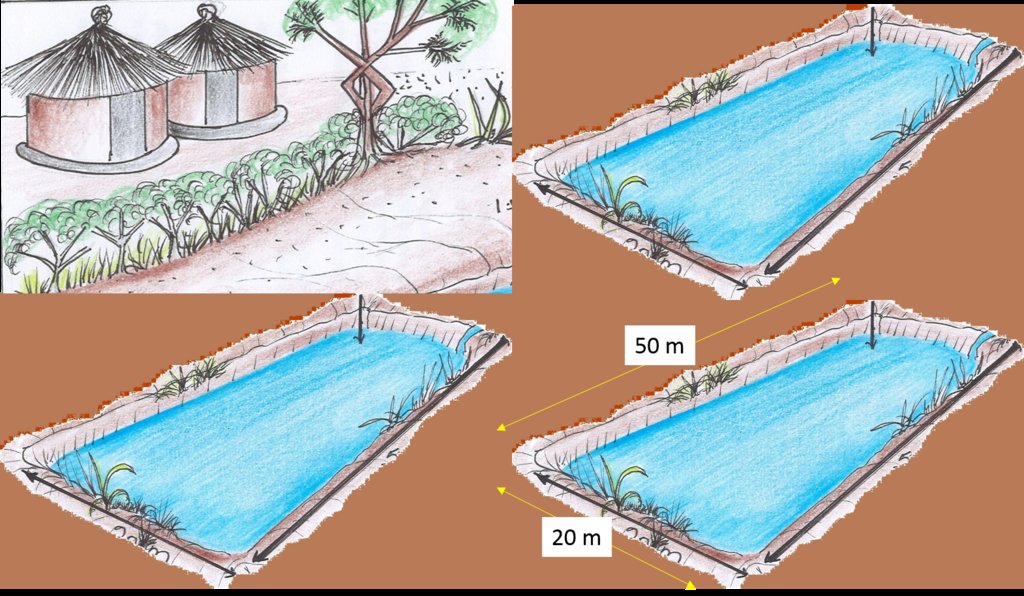
Fish farming supported by availability of water is considered as profitable enterprise in Northern Uganda. Farmers use areas with either high water tables or swamps to locate the ground water recharged fish ponds and water for fish production and crop irrigation during the dry season.
2.2 Detailed description of the Technology
Description:
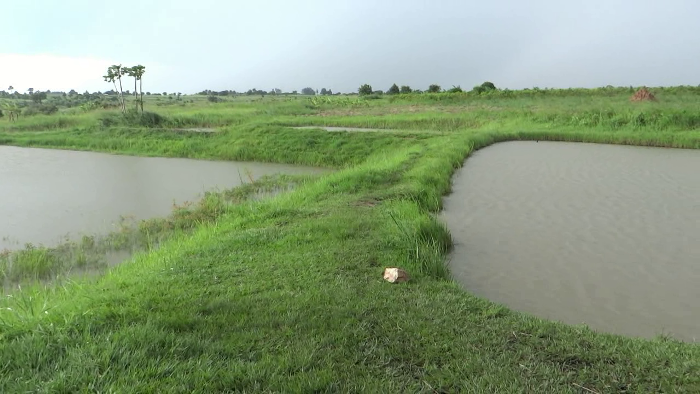
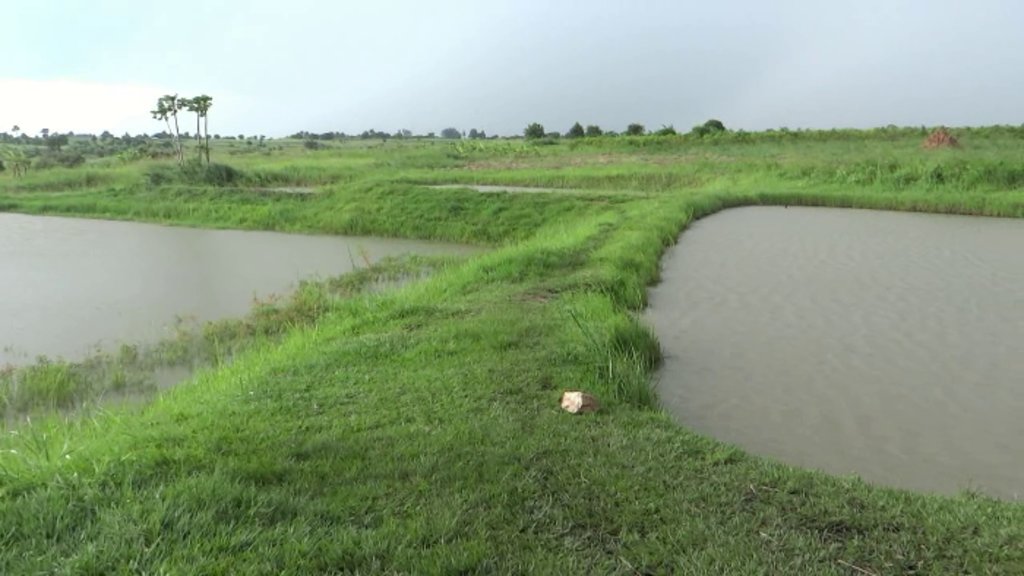
Fish farming is a sustainable land management agricultural practice promoted by farmers on medium sized farms in Northern Uganda, where ground water supply in wetland is used to recharge at least three adjacent fish ponds for fish production during the wet and dry season with each pond established measuring 50 m long x 20 m wide and 1.5 m depth with the following inputs hoes, spades, panga, wheel barrow, feeds and labour. The sides of the ponds are grown with grassy vegetation to stabilize soil, as well as feed the fish. It is, therefore imperative that farmers who want to invest in such sustainable land management practice first seek professional advice from extension agents or from other experienced farmers, on post-harvest fish handling and preservation. In Northern Uganda, fish theft and poisoning are also rampant, especially where ponds are not properly guarded or fenced. The most costly aspects of pond fish farming include pond excavation, laboratory testing of water and surrounding soil properties; procurement of fries especially tilapia, fencing and procurement of fish feeds. The average cost of establishing each pond is approximately US$428; while putting fish firies establishment goes for an average of US$ 71 per pond.
It is important to note that at the beginning the capital investments are high; these include paying for construction and buying fish fries to put in the ponds. However, in the long term the benefits exceed the costs. This is because fish farming is a high value enterprise with potential to provide household food, nutrition and income security.
2.3 Photos of the Technology
2.4 Videos of the Technology
Comments, short description:
Video on Ground water fish ponds in Lamwo District.
Date:
12/0/2017
Location:
Lamwo District
Name of videographer:
Issa Aiga
2.5 Country/ region/ locations where the Technology has been applied and which are covered by this assessment
Country:
Uganda
Region/ State/ Province:
Northern Region,Uganda
Further specification of location:
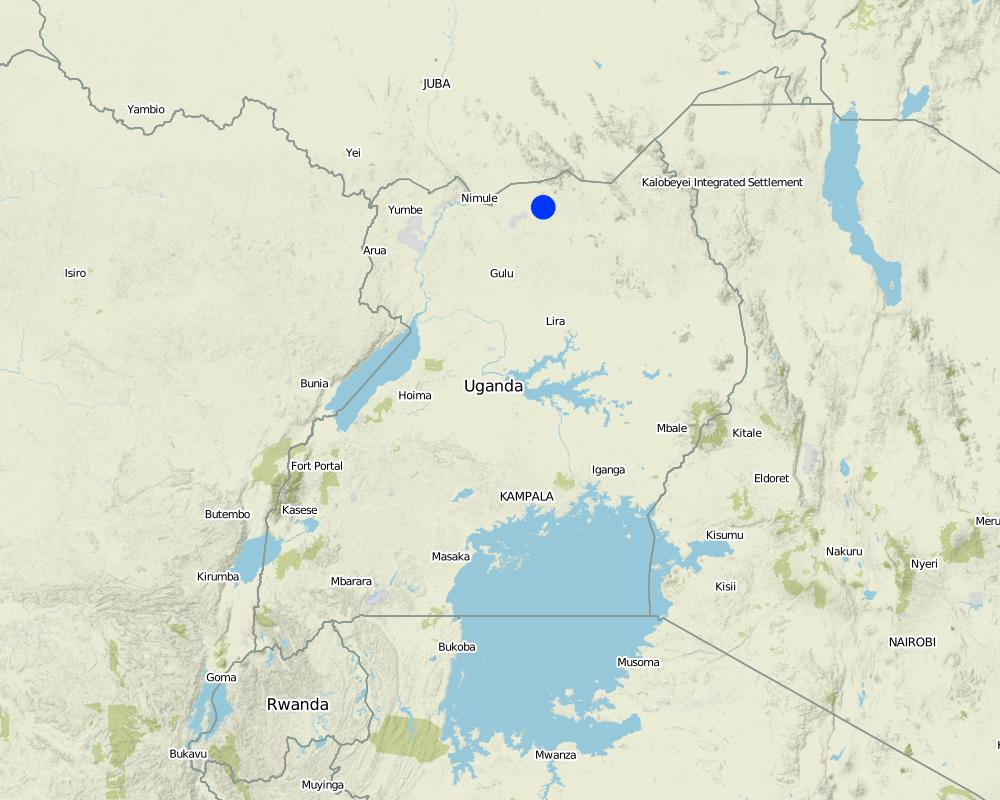
Lamwo District
Comments:
Map showing technology site in Northern Uganda.
Map
×2.6 Date of implementation
Indicate year of implementation:
2000
If precise year is not known, indicate approximate date:
- 10-50 years ago
2.7 Introduction of the Technology
Specify how the Technology was introduced:
- through land users' innovation
- through projects/ external interventions
Comments (type of project, etc.):
Received training from the extension agent.
3. Classification of the SLM Technology
3.1 Main purpose(s) of the Technology
- improve production
- create beneficial economic impact
3.2 Current land use type(s) where the Technology is applied

Cropland
- Annual cropping
Main crops (cash and food crops):
Maize

Waterways, waterbodies, wetlands
- Swamps, wetlands
Main products/ services:
Fish fingers.
If land use has changed due to the implementation of the Technology, indicate land use before implementation of the Technology:
Land was under maize plantation, which was usually planted within one year before the implementation of the technology.
3.3 Further information about land use
Water supply for the land on which the Technology is applied:
- rainfed
Number of growing seasons per year:
- 2
Specify:
Harvest twice a year (May and December).
Livestock density (if relevant):
4 cows and 5 goats.
3.4 SLM group to which the Technology belongs
- surface water management (spring, river, lakes, sea)
- beekeeping, aquaculture, poultry, rabbit farming, silkworm farming, etc.
3.5 Spread of the Technology
Specify the spread of the Technology:
- applied at specific points/ concentrated on a small area
Comments:
concentrated in a wetland.
3.6 SLM measures comprising the Technology
agronomic measures
- A1: Vegetation/ soil cover
- A2: Organic matter/ soil fertility
vegetative measures
- V2: Grasses and perennial herbaceous plants
- V3: Clearing of vegetation
structural measures
- S5: Dams, pans, ponds
management measures
- M1: Change of land use type
Comments:
Grasses are allowed to grow to stabilise the levees.
3.7 Main types of land degradation addressed by the Technology

biological degradation
- Bh: loss of habitats
- Bp: increase of pests/ diseases, loss of predators
water degradation
- Hs: change in quantity of surface water
- Hp: decline of surface water quality

other
Comments:
Vegetation around the pond stabilize the soils which reduces erosion.
3.8 Prevention, reduction, or restoration of land degradation
Specify the goal of the Technology with regard to land degradation:
- restore/ rehabilitate severely degraded land
Comments:
Due to vegetation growth around the fish ponds.
4. Technical specifications, implementation activities, inputs, and costs
4.1 Technical drawing of the Technology
4.2 Technical specifications/ explanations of technical drawing
Using 6 people paid on daily basis the farmer digs a three adjacent fish ponds either in a wetland on an average land size of less than 0.5 acres each water fed fish pond measuring 50 m long x 20 m wide dug to a depth of not more than 1.5 m. to allow water passively replenishes the pond, The Species kept are Nile perch, tilapia and wild fish.
4.3 General information regarding the calculation of inputs and costs
Specify how costs and inputs were calculated:
- per Technology area
Indicate size and area unit:
0.5 acres
other/ national currency (specify):
UGX
Indicate exchange rate from USD to local currency (if relevant): 1 USD =:
3500.0
Indicate average wage cost of hired labour per day:
5000 per person per day
4.4 Establishment activities
| Activity | Type of measure | Timing | |
|---|---|---|---|
| 1. | Excavation of soil for ponds | Vegetative | During the dry season |
| 2. | Soil testing | Agronomic | During the dry season |
| 3. | Water testing | Agronomic | Routine, dry and wet season |
| 4. | Buying fries | Other measures | Dry and wet season |
| 5. | Stocking the fish | Agronomic | Wet season and dry season |
| 6. | Feeding | Other measures | Dry and wet season |
| 7. | Planting around the pond | Other measures | Dry and wet season |
Comments:
Planted vegetation can also be used as feed supplement.
4.5 Costs and inputs needed for establishment
| Specify input | Unit | Quantity | Costs per Unit | Total costs per input | % of costs borne by land users | |
|---|---|---|---|---|---|---|
| Labour | Monthly persons days | persons | 6.0 | 150000.0 | 900000.0 | 1000.0 |
| Equipment | Hoes | pieces | 6.0 | 10000.0 | 60000.0 | 100.0 |
| Equipment | Spade | peices | 3.0 | 10000.0 | 30000.0 | 100.0 |
| Equipment | panga | pieces | 3.0 | 10000.0 | 30000.0 | 100.0 |
| Equipment | Wheel barrow | piece | 2.0 | 250000.0 | 500000.0 | |
| Other | Fish fries for 3 ponds | fries | 3000.0 | 1000.0 | 3000000.0 | 100.0 |
| Other | Soil tests | 1 | 2.0 | 350000.0 | 700000.0 | 1000.0 |
| Other | water tests | 1 | 2.0 | 380000.0 | 760000.0 | 100.0 |
| Total costs for establishment of the Technology | 5980000.0 | |||||
Comments:
Soil and water tests are done twice before establishment and once after establishment.
4.6 Maintenance/ recurrent activities
| Activity | Type of measure | Timing/ frequency | |
|---|---|---|---|
| 1. | Slashing | Management | twice a year |
| 2. | Feeding | Management | Routine |
4.7 Costs and inputs needed for maintenance/ recurrent activities (per year)
| Specify input | Unit | Quantity | Costs per Unit | Total costs per input | % of costs borne by land users | |
|---|---|---|---|---|---|---|
| Labour | Persons days for feeding and slashing/ monthly | Persons | 1.0 | 150000.0 | 150000.0 | 100.0 |
| Other | Feeds monthly | Kilograms | 15.0 | 4000.0 | 60000.0 | |
| Total costs for maintenance of the Technology | 210000.0 | |||||
Comments:
Low costs for paying labour due to reduced workload.
Also equipment like hoe , spade, panga are purchased at the time of establishment so no need to incur more costs. Additional costs are incurred when they wear out. At the time of the interview, the land user had not incurred costs on buying tools for maintaining the technology.
4.8 Most important factors affecting the costs
Describe the most determinate factors affecting the costs:
Labour for establishing and maintaining the pond.
5. Natural and human environment
5.1 Climate
Annual rainfall
- < 250 mm
- 251-500 mm
- 501-750 mm
- 751-1,000 mm
- 1,001-1,500 mm
- 1,501-2,000 mm
- 2,001-3,000 mm
- 3,001-4,000 mm
- > 4,000 mm
Specify average annual rainfall (if known), in mm:
1250.00
Specifications/ comments on rainfall:
Two rainy season and two dry season- Bi modal.
Agro-climatic zone
- humid
5.2 Topography
Slopes on average:
- flat (0-2%)
- gentle (3-5%)
- moderate (6-10%)
- rolling (11-15%)
- hilly (16-30%)
- steep (31-60%)
- very steep (>60%)
Landforms:
- plateau/plains
- ridges
- mountain slopes
- hill slopes
- footslopes
- valley floors
Altitudinal zone:
- 0-100 m a.s.l.
- 101-500 m a.s.l.
- 501-1,000 m a.s.l.
- 1,001-1,500 m a.s.l.
- 1,501-2,000 m a.s.l.
- 2,001-2,500 m a.s.l.
- 2,501-3,000 m a.s.l.
- 3,001-4,000 m a.s.l.
- > 4,000 m a.s.l.
Indicate if the Technology is specifically applied in:
- concave situations
Comments and further specifications on topography:
Situated in the wetland.
5.3 Soils
Soil depth on average:
- very shallow (0-20 cm)
- shallow (21-50 cm)
- moderately deep (51-80 cm)
- deep (81-120 cm)
- very deep (> 120 cm)
Soil texture (topsoil):
- medium (loamy, silty)
Soil texture (> 20 cm below surface):
- medium (loamy, silty)
Topsoil organic matter:
- medium (1-3%)
5.4 Water availability and quality
Ground water table:
< 5 m
Availability of surface water:
good
Water quality (untreated):
good drinking water
Is water salinity a problem?
No
Is flooding of the area occurring?
No
Comments and further specifications on water quality and quantity:
The farmer has put a drainage system and the levees long enough.
5.5 Biodiversity
Species diversity:
- medium
Habitat diversity:
- medium
5.6 Characteristics of land users applying the Technology
Sedentary or nomadic:
- Sedentary
Market orientation of production system:
- mixed (subsistence/ commercial
Off-farm income:
- less than 10% of all income
Relative level of wealth:
- poor
Individuals or groups:
- groups/ community
Level of mechanization:
- manual work
Gender:
- women
- men
Age of land users:
- youth
- middle-aged
5.7 Average area of land owned or leased by land users applying the Technology
- < 0.5 ha
- 0.5-1 ha
- 1-2 ha
- 2-5 ha
- 5-15 ha
- 15-50 ha
- 50-100 ha
- 100-500 ha
- 500-1,000 ha
- 1,000-10,000 ha
- > 10,000 ha
Is this considered small-, medium- or large-scale (referring to local context)?
- medium-scale
5.8 Land ownership, land use rights, and water use rights
Land ownership:
- communal/ village
- individual, not titled
Land use rights:
- communal (organized)
- individual
Water use rights:
- communal (organized)
- individual
Comments:
The technology on a communal land owned by the family.
5.9 Access to services and infrastructure
health:
- poor
- moderate
- good
education:
- poor
- moderate
- good
technical assistance:
- poor
- moderate
- good
employment (e.g. off-farm):
- poor
- moderate
- good
markets:
- poor
- moderate
- good
energy:
- poor
- moderate
- good
roads and transport:
- poor
- moderate
- good
drinking water and sanitation:
- poor
- moderate
- good
financial services:
- poor
- moderate
- good
6. Impacts and concluding statements
6.1 On-site impacts the Technology has shown
Socio-economic impacts
Production
risk of production failure
Comments/ specify:
Well managed with constant feeding.
product diversity
Comments/ specify:
Promoting different fish fries on the fish ponds.
production area
Quantity before SLM:
0
Quantity after SLM:
3
Comments/ specify:
Started with one fish pond and increased to three adjacent fish ponds.
land management
Comments/ specify:
Vegetation planted/ allowed to grow around the ponds to act as fodder and stabilizer
Water availability and quality
demand for irrigation water
Comments/ specify:
for fish production.
Income and costs
expenses on agricultural inputs
Comments/ specify:
Purchase of feeds.
farm income
Comments/ specify:
High due to sale of fish.
diversity of income sources
Comments/ specify:
Sale of fish.
economic disparities
Comments/ specify:
Between those who have fish ponds and those who don't have.
workload
Comments/ specify:
Increased workload at establishment for digging ponds, feeding the fish fries compared to maintenance.
Socio-cultural impacts
food security/ self-sufficiency
Comments/ specify:
Relies on fish from the pond.
recreational opportunities
Comments/ specify:
Other farmers coming to learn from the technology.
SLM/ land degradation knowledge
Comments/ specify:
Training by the extension worker on feeding and management.
Ecological impacts
Water cycle/ runoff
water quantity
Comments/ specify:
Water re-charged from underground.
harvesting/ collection of water
Comments/ specify:
Underground harvesting and kept in the pond for fish production during the dry season.
Biodiversity: vegetation, animals
Vegetation cover
Comments/ specify:
Vegetation allowed to grow on the ponds as stabilizer and feeds.
beneficial species
Comments/ specify:
More fish fries varieties stocked by the farmer in the ponds :3 different species.
pest/ disease control
Comments/ specify:
Training by the extension agent on how to control.
Climate and disaster risk reduction
drought impacts
Comments/ specify:
under ground water harvesting water to be favour fish survival during the dry season.
fire risk
Comments/ specify:
located in the wetland.
6.2 Off-site impacts the Technology has shown
water availability
Comments/ specify:
re-charged from under ground,
6.3 Exposure and sensitivity of the Technology to gradual climate change and climate-related extremes/ disasters (as perceived by land users)
Gradual climate change
Gradual climate change
| Season | Type of climatic change/ extreme | How does the Technology cope with it? | |
|---|---|---|---|
| annual temperature | decrease | well | |
| seasonal temperature | wet/ rainy season | decrease | well |
| annual rainfall | decrease | well | |
| seasonal rainfall | wet/ rainy season | decrease | moderately |
Climate-related extremes (disasters)
Climatological disasters
| How does the Technology cope with it? | |
|---|---|
| drought | very well |
| land fire | well |
Biological disasters
| How does the Technology cope with it? | |
|---|---|
| epidemic diseases | moderately |
6.4 Cost-benefit analysis
How do the benefits compare with the establishment costs (from land users’ perspective)?
Short-term returns:
slightly negative
Long-term returns:
positive
How do the benefits compare with the maintenance/ recurrent costs (from land users' perspective)?
Short-term returns:
slightly positive
Long-term returns:
slightly positive
Comments:
slightly negative at the time of establishment with purchase of labour, purchase of fish fries and lab testing but positive when workload reduces and its associated costs with the farmer harvesting and selling fish for income.
6.5 Adoption of the Technology
- 1-10%
If available, quantify (no. of households and/ or area covered):
Mostly those with some capital
Of all those who have adopted the Technology, how many have did so spontaneously, i.e. without receiving any material incentives/ payments?
- 10-50%
Comments:
More farmers were trained by National Agricultural Advisory services (NAADS) and Open Wealth Creation (OWC), acquired knowledge and skills and started on their own without material incentives.
6.6 Adaptation
Has the Technology been modified recently to adapt to changing conditions?
No
6.7 Strengths/ advantages/ opportunities of the Technology
| Strengths/ advantages/ opportunities in the land user’s view |
|---|
| Provides high benefits (income) in the short run. |
| Its replicable elsewhere by both small scale and large scale land users. |
| Uses recharged from under ground which is available all year round. |
| Strengths/ advantages/ opportunities in the compiler’s or other key resource person’s view |
|---|
| Good and sustainable technology. Does not require constant labour once its established. Low costs of labour required for routine and maintenance activities. |
| Can survive on planted vegetation to supplement fish feeds. |
6.8 Weaknesses/ disadvantages/ risks of the Technology and ways of overcoming them
| Weaknesses/ disadvantages/ risks in the land user’s view | How can they be overcome? |
|---|---|
| Requires high level sophisticated skills in water and soil testing / high costs. | Testing using local indicators. |
| Not fenced. Possibility of poisong the fish. | Fencing the fish pond and if possible employ a local secuirty guard. |
| Weaknesses/ disadvantages/ risks in the compiler’s or other key resource person’s view | How can they be overcome? |
|---|---|
| Labour and capital intentive at the time of establishment/ Appropriate to the rich. | Link farmers to Agricultural loans and pay after selling fish. |
7. References and links
7.1 Methods/ sources of information
- field visits, field surveys
01
- interviews with land users
01
Links and modules
Expand all Collapse allLinks
No links
Modules
No modules


