Modern Intensive Livestock Management. [Uganda]
- Creation:
- Update:
- Compiler: Kamugisha Rick Nelson
- Editors: JOY TUKAHIRWA, Richard Otto Kawawa, Sunday Balla Amale, Bernard Fungo
- Reviewers: Donia Mühlematter, John Stephen Tenywa, Nicole Harari, Renate Fleiner, Stephanie Jaquet, Alexandra Gavilano
Gwoko dyang cak
technologies_2143 - Uganda
View sections
Expand all Collapse all1. General information
1.2 Contact details of resource persons and institutions involved in the assessment and documentation of the Technology
Key resource person(s)
SLM specialist:
Sabiti Kidega Faith
Gulu Uganda Country Diary Farm
Name of project which facilitated the documentation/ evaluation of the Technology (if relevant)
Scaling-up SLM practices by smallholder farmers (IFAD)Name of the institution(s) which facilitated the documentation/ evaluation of the Technology (if relevant)
CDE Centre for Development and Environment (CDE Centre for Development and Environment) - Switzerland1.3 Conditions regarding the use of data documented through WOCAT
The compiler and key resource person(s) accept the conditions regarding the use of data documented through WOCAT:
Yes
1.4 Declaration on sustainability of the described Technology
Is the Technology described here problematic with regard to land degradation, so that it cannot be declared a sustainable land management technology?
No
Comments:
A highly successful example intensive zero-grazing of dairy cattle. The hybrid stock is progressively adopted to the climatic conditions of northern Uganda using selective gene replication technologies. Only female calves are produced on this farm through artificial insemination using sexed semen. Between February and April 2017, the herd increased from 54 to 63.
2. Description of the SLM Technology
2.1 Short description of the Technology
Definition of the Technology:
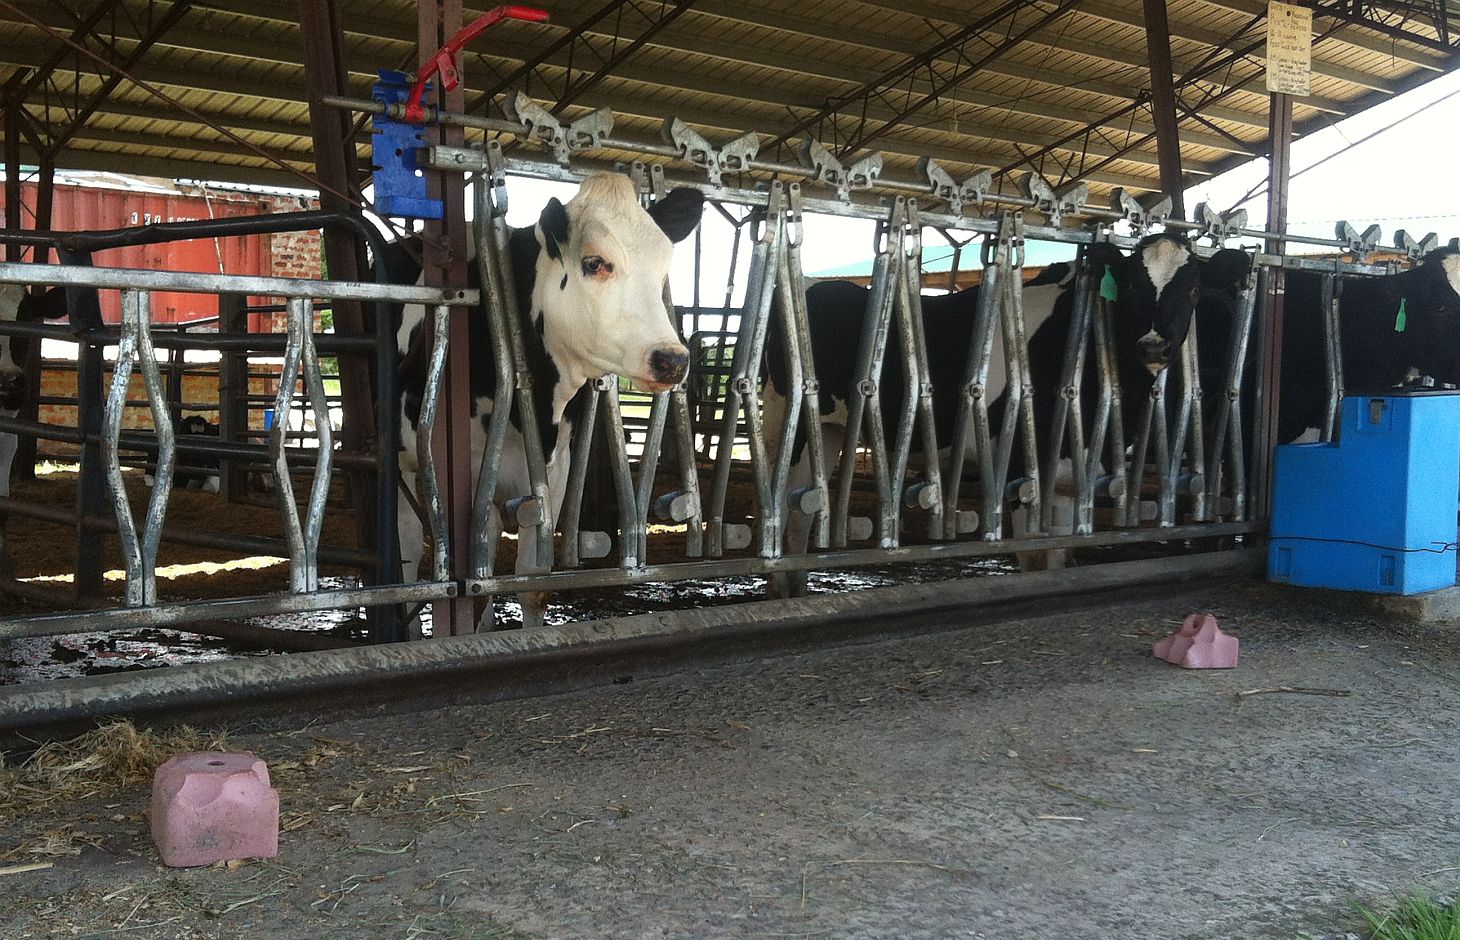
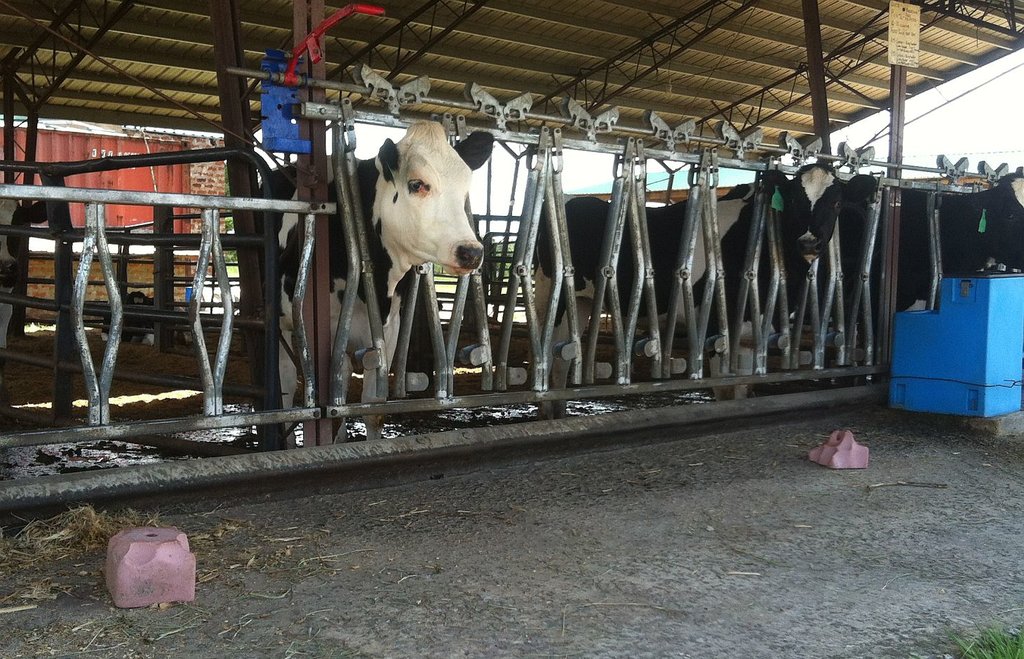
Intensive zero-grazing of hybrid dairy Hybrid (Holstein Friesian) cattle to produce a constant high yield of milk all-year around.
2.2 Detailed description of the Technology
Description:
The productivity of modern intensive livestock management systems in northern Uganda is highly constrained by increasing household land shortage, poor quality pastures and rampant spread of livestock pests and diseases. Thus a large number of improved cattle are reared in closed systems where they are fed, treated and supervised. Some bulk feeds are grown on the same farm and the manure from the livestock housing units is used to improve soil fertility and crop yields of the same farm.
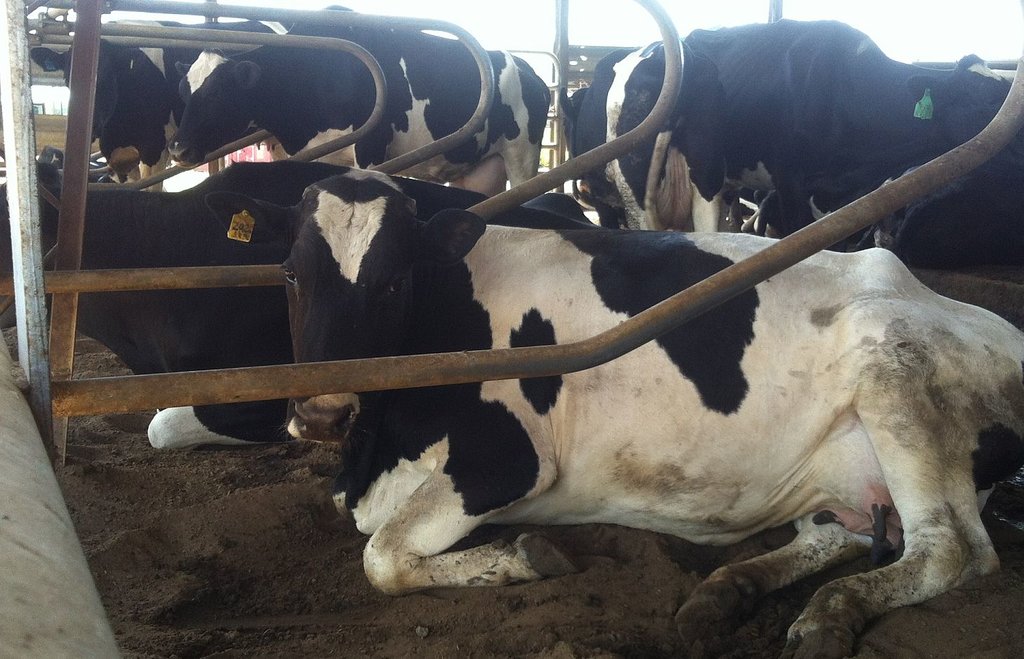
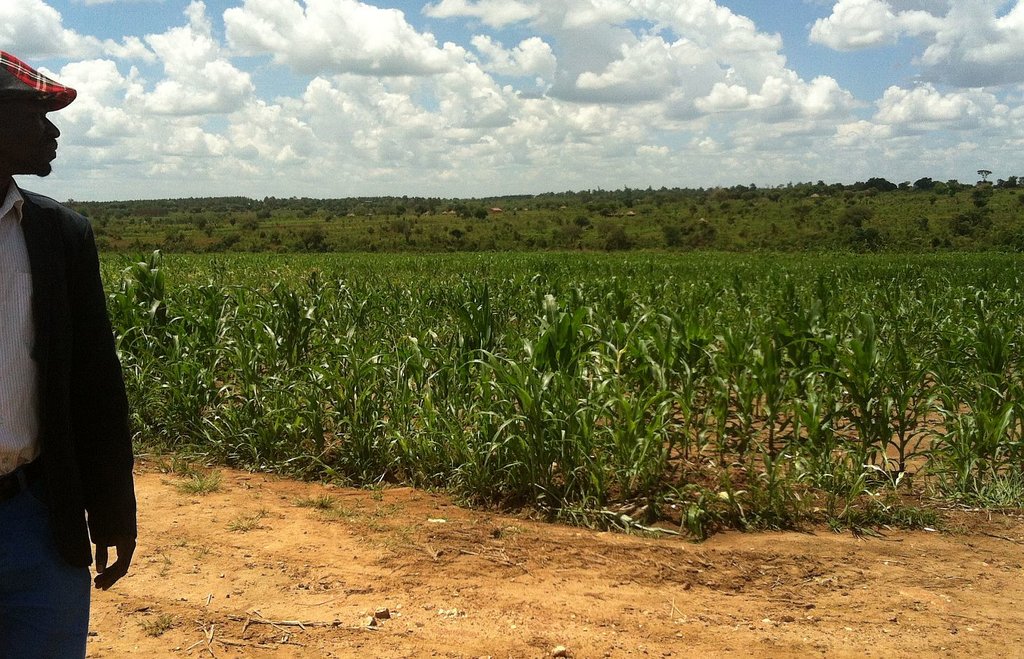
Improved breeds of cattle (75% Friesian and 25% local) are reared in paddocked land area of an average in 8 hectares, within which the animals are fed, watered and managed with medication. Approximately 25% of this land area is devoted to livestock structures, in which up to 64 Friesians are kept. The rest of the land is planted with improved pastures as well as other crops such as maize (Zea mays), cowpeas (Vigna unguiculata), fruit trees and vegetables. Manure is collected daily from an assembly point and applied to the crops. Improved pastures are also used for silage. The system further provides manure, which is valuable for soil fertility improvement in crop fields. Moreover, the confinement of the livestock system helps to reduce conflicts experienced in traditional free range grazing areas.
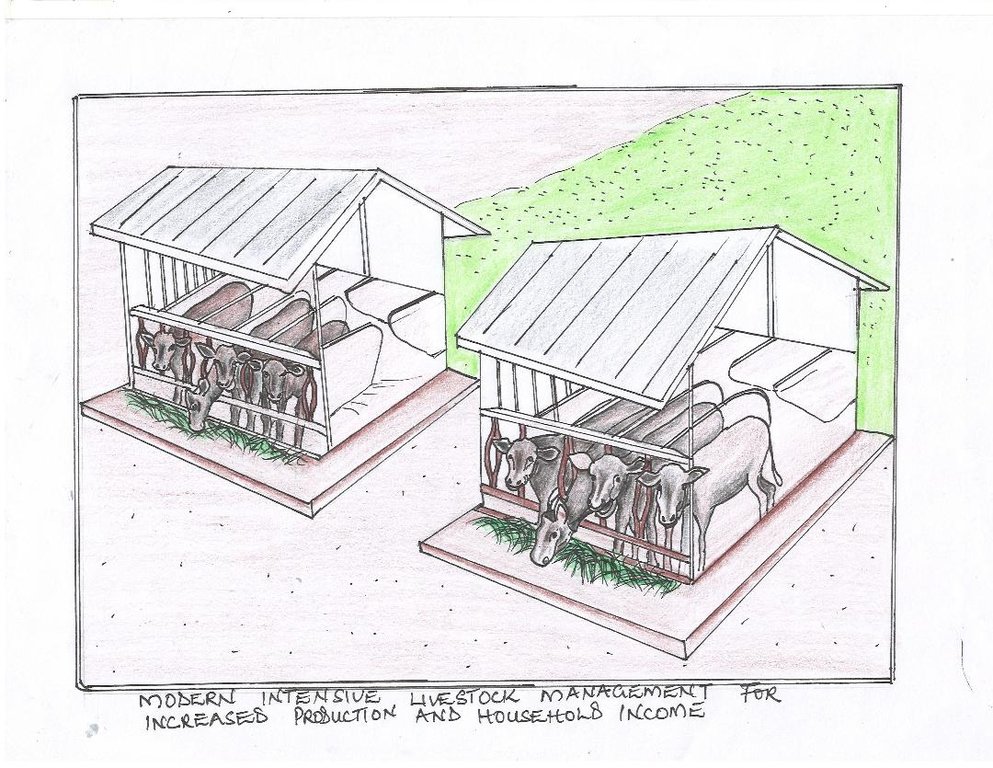
The approach and materials used in this intensive dairy cattle rearing system in northern Uganda closely follows specification for dairy cattle barns in New Zealand (www.simpleshelter.co.nz/). When properly implemented, the financial returns are substantial in the long term. However, establishment costs are relatively high for most average smallholder farmers in northern Uganda. The sustainable land management (SLM) benefits from this system justify its adoption, although carbon balance needs to be independently assessed.
2.3 Photos of the Technology
General remarks regarding photos:
On 20 acres of land 5 are built up while 15 are cropland. Maize and cowpeas are the main crops used as fodder. An orchard, banana plantation and a couple of fish ponds complete the sustainable food cycle.
2.4 Videos of the Technology
Date:
10/05/2017
Location:
Gulu District Northern Uganda
2.5 Country/ region/ locations where the Technology has been applied and which are covered by this assessment
Country:
Uganda
Region/ State/ Province:
Northern region
Further specification of location:
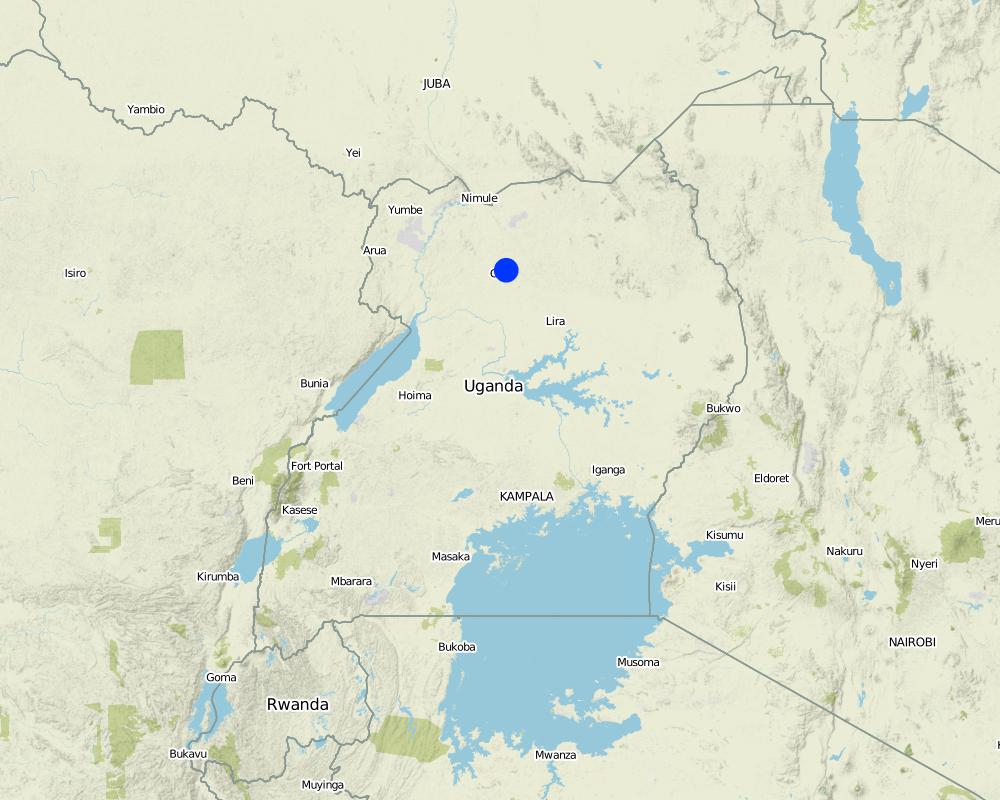
Gulu district
Specify the spread of the Technology:
- applied at specific points/ concentrated on a small area
Comments:
Map showing technology site in Northern Uganda.
Map
×2.6 Date of implementation
Indicate year of implementation:
2007
If precise year is not known, indicate approximate date:
- 10-50 years ago
2.7 Introduction of the Technology
Specify how the Technology was introduced:
- through land users' innovation
- through projects/ external interventions
Comments (type of project, etc.):
Started this innitiative after retiring from Heifer International Project as a Veterinary doctor.
3. Classification of the SLM Technology
3.1 Main purpose(s) of the Technology
- improve production
- reduce, prevent, restore land degradation
- conserve ecosystem
- create beneficial economic impact
3.2 Current land use type(s) where the Technology is applied

Cropland
- Annual cropping
Number of growing seasons per year:
- 3
Specify:
3 seasons achieved through innovative "dry-cropping".
Grazing land
Intensive grazing/ fodder production:
- Cut-and-carry/ zero grazing
- Improved pastures
Comments:
Several overlapping technologies have been designed to create a sustainable mixed crop and livestock agricultural system.
3.4 Water supply
Water supply for the land on which the Technology is applied:
- rainfed
Comments:
Three cropping seasons are managed from two seasons of rainfall through an innovative early planting philosophy referred to as "dry-planting", which splits the long rainy season into two. The three-season crop production system is necessary to ensure the production of enough fodder for the animals. 63 cows may be managed on the limited acreage using this system.
3.5 SLM group to which the Technology belongs
- integrated crop-livestock management
- integrated soil fertility management
3.6 SLM measures comprising the Technology
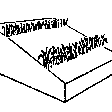
agronomic measures
- A1: Vegetation/ soil cover
- A2: Organic matter/ soil fertility
vegetative measures
- V4: Replacement or removal of alien/ invasive species
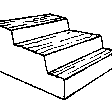
structural measures
- S9: Shelters for plants and animals
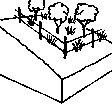
management measures
- M2: Change of management/ intensity level
- M4: Major change in timing of activities
- M6: Waste management (recycling, re-use or reduce)
Comments:
The intricate combination of agronomic, vegetative and management measures is necessary for sustaining the farm.
3.7 Main types of land degradation addressed by the Technology
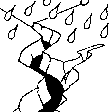
soil erosion by water
- Wt: loss of topsoil/ surface erosion

soil erosion by wind
chemical soil deterioration
- Cn: fertility decline and reduced organic matter content (not caused by erosion)
physical soil deterioration
- Pc: compaction
- Pu: loss of bio-productive function due to other activities

biological degradation
- Bc: reduction of vegetation cover

water degradation
- Ha: aridification
Comments:
Use of disc harrowing reduces soil disturbance that could lead to destruction of soil structure and induce water erosion during heavy rainfall episodes.
3.8 Prevention, reduction, or restoration of land degradation
Specify the goal of the Technology with regard to land degradation:
- prevent land degradation
- reduce land degradation
Comments:
Use of Animal manure.
4. Technical specifications, implementation activities, inputs, and costs
4.1 Technical drawing of the Technology
4.2 General information regarding the calculation of inputs and costs
Specify how costs and inputs were calculated:
- per Technology unit
Specify unit:
Livestock Unit (LU)
Specify dimensions of unit (if relevant):
1 Heifer
other/ national currency (specify):
UGX
If relevant, indicate exchange rate from USD to local currency (e.g. 1 USD = 79.9 Brazilian Real): 1 USD =:
3400.0
Indicate average wage cost of hired labour per day:
5000
4.3 Establishment activities
| Activity | Timing (season) | |
|---|---|---|
| 1. | Find and buy land | Anytime, before establishment |
| 2. | Survey land to get map especially for gradient and soils | Anytime, before harvesting |
| 3. | Remove all tree cover and stumps | Dry season |
| 4. | Disc Ploughing | Dry season |
| 5. | Plant Maize | Rainy season |
| 6. | Build silage bunker | Anytime |
| 7. | Construct Animal Barns | Anytime |
| 8. | Identify water source | anytime |
| 9. | Construct and fill water storage tanks | Just before stocking |
| 10. | Procure and stock in-calf cows | After harvest of first crop of maize |
4.4 Costs and inputs needed for establishment
| Specify input | Unit | Quantity | Costs per Unit | Total costs per input | % of costs borne by land users | |
|---|---|---|---|---|---|---|
| Labour | Procure stock | Pieces | 10.0 | 200000.0 | 2000000.0 | 100.0 |
| Labour | Survey and map land | Pieces | 1.0 | 23000000.0 | 23000000.0 | 100.0 |
| Labour | Slash, cut trees, remove stumps | Person-days | 60.0 | 5000.0 | 300000.0 | 100.0 |
| Equipment | Plant maize | Person-days | 10.0 | 5000.0 | 50000.0 | 100.0 |
| Equipment | Weed maize | Person-days | 20.0 | 5000.0 | 100000.0 | 100.0 |
| Equipment | Cut maize to make silage | Person-days | 20.0 | 500.0 | 10000.0 | 100.0 |
| Equipment | Tractor, pump, water tank, piping | Pieces | 1.0 | 7500000.0 | 7500000.0 | 100.0 |
| Plant material | Maize seed | Kg | 325.0 | 5000.0 | 1625000.0 | 100.0 |
| Fertilizers and biocides | NPK fertilizers | Kg | 1500.0 | 3000.0 | 4500000.0 | 100.0 |
| Construction material | Prefabs, roofing, bricks, sand, cement and construction costs | Pieces | 1.0 | 5000.0 | 5000.0 | |
| Total costs for establishment of the Technology | 39090000.0 | |||||
If you are unable to break down the costs in the table above, give an estimation of the total costs of establishing the Technology:
58000.0
Comments:
After retiring from active service, he acquired a huge loan from bank. The project has paid back the loan.
4.5 Maintenance/ recurrent activities
| Activity | Timing/ frequency | |
|---|---|---|
| 1. | Harrowing | Dry season |
| 2. | Planting | Dry season (dry planting) and wet season |
| 3. | Harvesting (cutting stalks for silage) | Wet season |
| 4. | Silage making | Wet season |
| 5. | Vaccination | Continuous |
| 6. | Deworming | Continuous |
| 7. | Milking and milk selling | Continuous |
| 8. | Maintenance of machinery | Continuous |
| 9. | Maintenance of barns | Continuous |
4.6 Costs and inputs needed for maintenance/ recurrent activities (per year)
| Specify input | Unit | Quantity | Costs per Unit | Total costs per input | % of costs borne by land users | |
|---|---|---|---|---|---|---|
| Labour | persons days paid monthly | persons | 50.0 | 150000.0 | 7500000.0 | 100.0 |
| Fertilizers and biocides | Vaccines monthly | 1 | 30.0 | |||
| Other | Servicing and mainting equipemnt monthly | 1 | 30.0 | |||
| Total costs for maintenance of the Technology | 7500000.0 | |||||
4.7 Most important factors affecting the costs
Describe the most determinate factors affecting the costs:
Labour and equipment takes most of the costs. Labour and equipment maintenance is routine monthly.
5. Natural and human environment
5.1 Climate
Annual rainfall
- < 250 mm
- 251-500 mm
- 501-750 mm
- 751-1,000 mm
- 1,001-1,500 mm
- 1,501-2,000 mm
- 2,001-3,000 mm
- 3,001-4,000 mm
- > 4,000 mm
Specify average annual rainfall (if known), in mm:
1350.00
Specifications/ comments on rainfall:
2 seasons of rainfall.
Agro-climatic zone
- humid
- sub-humid
5.2 Topography
Slopes on average:
- flat (0-2%)
- gentle (3-5%)
- moderate (6-10%)
- rolling (11-15%)
- hilly (16-30%)
- steep (31-60%)
- very steep (>60%)
Landforms:
- plateau/plains
- ridges
- mountain slopes
- hill slopes
- footslopes
- valley floors
Altitudinal zone:
- 0-100 m a.s.l.
- 101-500 m a.s.l.
- 501-1,000 m a.s.l.
- 1,001-1,500 m a.s.l.
- 1,501-2,000 m a.s.l.
- 2,001-2,500 m a.s.l.
- 2,501-3,000 m a.s.l.
- 3,001-4,000 m a.s.l.
- > 4,000 m a.s.l.
Indicate if the Technology is specifically applied in:
- not relevant
5.3 Soils
Soil depth on average:
- very shallow (0-20 cm)
- shallow (21-50 cm)
- moderately deep (51-80 cm)
- deep (81-120 cm)
- very deep (> 120 cm)
Soil texture (> 20 cm below surface):
- medium (loamy, silty)
Topsoil organic matter:
- high (>3%)
- medium (1-3%)
5.4 Water availability and quality
Ground water table:
5-50 m
Availability of surface water:
medium
Water quality (untreated):
good drinking water
Is water salinity a problem?
No
Is flooding of the area occurring?
No
Comments and further specifications on water quality and quantity:
Water is pumped from underground for domestic use and for the animals.
5.5 Biodiversity
Species diversity:
- medium
Habitat diversity:
- medium
5.6 Characteristics of land users applying the Technology
Sedentary or nomadic:
- Sedentary
Market orientation of production system:
- commercial/ market
Off-farm income:
- less than 10% of all income
Relative level of wealth:
- rich
Individuals or groups:
- individual/ household
Level of mechanization:
- animal traction
- mechanized/ motorized
Gender:
- women
- men
Age of land users:
- youth
- middle-aged
Indicate other relevant characteristics of the land users:
He is a trainer in diary production and management in Gulu district facilitated by Northern Uganda Social Action Fund (NUSAF).
5.7 Average area of land used by land users applying the Technology
- < 0.5 ha
- 0.5-1 ha
- 1-2 ha
- 2-5 ha
- 5-15 ha
- 15-50 ha
- 50-100 ha
- 100-500 ha
- 500-1,000 ha
- 1,000-10,000 ha
- > 10,000 ha
Is this considered small-, medium- or large-scale (referring to local context)?
- medium-scale
Comments:
Average households in Gulu district have equal or more land than the land held by this farmer.
5.8 Land ownership, land use rights, and water use rights
Land ownership:
- individual, not titled
Land use rights:
- individual
Water use rights:
- individual
Comments:
Enclosed area with strict management.
Land ownership is individual but not titled because the land user has not started on the process of acquiring the title.
5.9 Access to services and infrastructure
health:
- poor
- moderate
- good
education:
- poor
- moderate
- good
technical assistance:
- poor
- moderate
- good
employment (e.g. off-farm):
- poor
- moderate
- good
markets:
- poor
- moderate
- good
energy:
- poor
- moderate
- good
roads and transport:
- poor
- moderate
- good
drinking water and sanitation:
- poor
- moderate
- good
financial services:
- poor
- moderate
- good
6. Impacts and concluding statements
6.1 On-site impacts the Technology has shown
Socio-economic impacts
Production
crop production
Quantity before SLM:
Subsistence
Quantity after SLM:
Enough to feed over 60 hybrid cows.
Comments/ specify:
Maize and cow peas as feed supplements.
crop quality
Quantity before SLM:
0
Quantity after SLM:
Bananas and fruit orchard introduced
Comments/ specify:
Application of manure.
fodder production
Quantity before SLM:
0
Quantity after SLM:
Enough for 60 cow all-year around
fodder quality
Quantity before SLM:
None
Quantity after SLM:
Feeds over 60 cows
Comments/ specify:
Planted maize and cow peas.
animal production
Quantity before SLM:
0
Quantity after SLM:
>60
risk of production failure
Quantity before SLM:
Dependent on rainfall availability
Quantity after SLM:
Managed crop and water production
product diversity
Quantity before SLM:
Cereals only
Quantity after SLM:
Mixed crop and livestock production
production area
Quantity before SLM:
20 acres
Quantity after SLM:
20 acres
land management
Quantity before SLM:
Communal
Quantity after SLM:
Individual
Comments/ specify:
Application of animal manure from the cows
Water availability and quality
drinking water availability
Quantity before SLM:
0
Quantity after SLM:
Pumped from underground water.
drinking water quality
Quantity before SLM:
None available
Quantity after SLM:
Safe drinking water for humans and livestock.
water availability for livestock
Quantity before SLM:
None
Quantity after SLM:
Available
water quality for livestock
Quantity before SLM:
None
Quantity after SLM:
Safe, clean drinking water.
Income and costs
expenses on agricultural inputs
Quantity before SLM:
Tractors/ dairy industry tools and machinery
Quantity after SLM:
Hand hoe
farm income
Quantity before SLM:
Subsistent
Quantity after SLM:
Commercial
diversity of income sources
Quantity before SLM:
Subsistence
Quantity after SLM:
Dairy products
workload
Quantity before SLM:
20 -50 employees
Quantity after SLM:
Single households
Comments/ specify:
Enough employees employed to work on farm.
Other socio-economic impacts
Quantity before SLM:
No training facility for the community
Quantity after SLM:
Dairy farming training and extension for community
Socio-cultural impacts
food security/ self-sufficiency
Quantity before SLM:
Subsistence
Quantity after SLM:
Surplus production
health situation
Quantity before SLM:
Low
Quantity after SLM:
High
land use/ water rights
Quantity before SLM:
None
Quantity after SLM:
Individual pumped water
cultural opportunities
Quantity before SLM:
No training center in area
Quantity after SLM:
High-end veterinary training and extension facility
SLM/ land degradation knowledge
Quantity before SLM:
No record
Quantity after SLM:
Proper records including digital research weather station
Ecological impacts
Water cycle/ runoff
water quantity
Quantity before SLM:
High runoff
Quantity after SLM:
High retension
water quality
Quantity before SLM:
None
Quantity after SLM:
Available drinking water
surface runoff
Quantity before SLM:
No management measures
Quantity after SLM:
Management measures in place
Soil
soil moisture
Quantity before SLM:
Low
Quantity after SLM:
Very high
Comments/ specify:
Increased ground cover ensures high soil moisture on cropland.
soil cover
Quantity before SLM:
None
Quantity after SLM:
Planted grasses, cereals, legumes and fruit trees
nutrient cycling/ recharge
Quantity before SLM:
None
Quantity after SLM:
Farmyard manuring
soil organic matter/ below ground C
Quantity before SLM:
Not managed
Quantity after SLM:
Properly managed through "turning"
Biodiversity: vegetation, animals
biomass/ above ground C
Quantity before SLM:
A few crops during rainy season
Quantity after SLM:
Intensive fodder cropping to meet needs for dairy farming
animal diversity
Quantity before SLM:
No animals
Quantity after SLM:
Cows on dairy farm
Climate and disaster risk reduction
emission of carbon and greenhouse gases
Quantity before SLM:
Dairy Farm Production
Quantity after SLM:
Subsistence crop production
Comments/ specify:
Dairy cows emit methane and mechanisation involves burning fossil fuels both of which leave a bigger carbon footprint than the is counterbalanced by the crops that are grown for forder. Good management of the plant biodiversity at the stream banks helps offset the carbon footprint somehow but may not be sufficient
6.2 Off-site impacts the Technology has shown
impact of greenhouse gases
Quantity before SLM:
Dairy farming
Quantity after SLM:
No livestock
Specify assessment of off-site impacts (measurements):
Generally, the economic and social benefits far outweigh the environmental costs. The technology is a good SLM practice.
6.3 Exposure and sensitivity of the Technology to gradual climate change and climate-related extremes/ disasters (as perceived by land users)
Gradual climate change
Gradual climate change
| Season | increase or decrease | How does the Technology cope with it? | |
|---|---|---|---|
| annual temperature | increase | very well | |
| seasonal temperature | dry season | increase | very well |
| annual rainfall | decrease | well | |
| seasonal rainfall | wet/ rainy season | decrease | well |
Climate-related extremes (disasters)
Meteorological disasters
| How does the Technology cope with it? | |
|---|---|
| local rainstorm | very well |
| local thunderstorm | very well |
| local hailstorm | well |
Climatological disasters
| How does the Technology cope with it? | |
|---|---|
| heatwave | moderately |
| drought | well |
Biological disasters
| How does the Technology cope with it? | |
|---|---|
| epidemic diseases | very well |
Other climate-related consequences
Other climate-related consequences
| How does the Technology cope with it? | |
|---|---|
| reduced growing period | well |
6.4 Cost-benefit analysis
How do the benefits compare with the establishment costs (from land users’ perspective)?
Short-term returns:
negative
Long-term returns:
very positive
How do the benefits compare with the maintenance/ recurrent costs (from land users' perspective)?
Short-term returns:
slightly negative
Long-term returns:
very positive
Comments:
The technology is highly productive in the medium to longer term.
6.5 Adoption of the Technology
- single cases/ experimental
If available, quantify (no. of households and/ or area covered):
1
Of all those who have adopted the Technology, how many did so spontaneously, i.e. without receiving any material incentives/ payments?
- 0-10%
Comments:
Technology is quite expensive and requires external support to establish.
6.6 Adaptation
Has the Technology been modified recently to adapt to changing conditions?
Yes
If yes, indicate to which changing conditions it was adapted:
- climatic change/ extremes
Specify adaptation of the Technology (design, material/ species, etc.):
Hybrids which combine high milk yield and tolerance for local weather conditions are being bred in preference to original 75 percent parent stock.
6.7 Strengths/ advantages/ opportunities of the Technology
| Strengths/ advantages/ opportunities in the land user’s view |
|---|
| Environment is controlled to create microclimate suitable to technology. |
| Technology creates an isolated complete ecosystem. |
| Strengths/ advantages/ opportunities in the compiler’s or other key resource person’s view |
|---|
| Once established, the technology is extremely profitable. |
| Opportunities established for training extension delivery personnel through demonstration of good practices. |
6.8 Weaknesses/ disadvantages/ risks of the Technology and ways of overcoming them
| Weaknesses/ disadvantages/ risks in the land user’s view | How can they be overcome? |
|---|---|
| Inputs make technology quite expensive. | Calculate economic profitability carefully to maintain efficient production. |
| Weaknesses/ disadvantages/ risks in the compiler’s or other key resource person’s view | How can they be overcome? |
|---|---|
| Combining intensive productivity with training carries the risk of introducing animal diseases from the high flux of visitors. | Disinfection basins have been placed at various points on the farm. |
7. References and links
7.1 Methods/ sources of information
- field visits, field surveys
3 (Land User, Project Manager, Extension Service Provider).
- interviews with land users
2
- interviews with SLM specialists/ experts
2
- compilation from reports and other existing documentation
1 (info@simpleshelter.co.nz).
When were the data compiled (in the field)?
27/04/2017
7.2 References to available publications
Title, author, year, ISBN:
None
7.3 Links to relevant online information
Title/ description:
None
Links and modules
Expand all Collapse allLinks
No links
Modules
No modules


