Ex-post and ex-ante soil sealing maps [Poland]
- Creation:
- Update:
- Compiler: Tomasz Miturski
- Editor: –
- Reviewers: Fabian Ottiger, Alexandra Gavilano
Mapy procesu zasklepiania gleb (Polish)
technologies_1716 - Poland
View sections
Expand all Collapse all1. General information
1.2 Contact details of resource persons and institutions involved in the assessment and documentation of the Technology
Name of project which facilitated the documentation/ evaluation of the Technology (if relevant)
Preventing and Remediating degradation of soils in Europe through Land Care (EU-RECARE )Name of the institution(s) which facilitated the documentation/ evaluation of the Technology (if relevant)
Institute of Soil Science and Plant Cultivation (Institute of Soil Science and Plant Cultivation) - Poland1.3 Conditions regarding the use of data documented through WOCAT
The compiler and key resource person(s) accept the conditions regarding the use of data documented through WOCAT:
Yes
1.4 Declaration on sustainability of the described Technology
Is the Technology described here problematic with regard to land degradation, so that it cannot be declared a sustainable land management technology?
No
1.5 Reference to Questionnaire(s) on SLM Approaches (documented using WOCAT)

The prevention of soil sealing [Poland]
The prevention of soil sealing is an approach in which stakeholders are making spatial planning decisions based on the new map of soil sealing, in case of protecting the most valuable soils.
- Compiler: Tomasz Miturski
2. Description of the SLM Technology
2.1 Short description of the Technology
Definition of the Technology:
Ex-post and ex-ante soil sealing maps
2.2 Detailed description of the Technology
Description:
The technology utilizes soil agricultural maps and provides information on quality of sealed soils.
It involves cellular automata software to build the model of land use change and produce the forecasts for various soil protection scenarios.
Spatial development of the functional areas. These are mostly areas of soil protection for food production purposes. The delineation is based on land productivity information (present on soil-agricultural maps), distribution of high nature value areas, need for establishment of “green rings” around the bigger cities.
The maps will be sent to the municipal authorities, with a scientific comment on the problem. The technology enables determining the scale of the soil sealing threat in the province, also what is the soil quality class of the area of interest. In the municipalities with the greatest soil sealing problem and with perspective to expand in the future, there is a need for new legal regulations to force soil protection in local spatial plans. The regional spatial planning office should become a coordinator for the local spatial planning offices, to raise the knowledge about how to use soil digital maps in spatial planning, especially in the case of protecting the soil against soil sealing process. For the municipalities, large scale maps are produced, which contain results of soil sealing forecasting model.
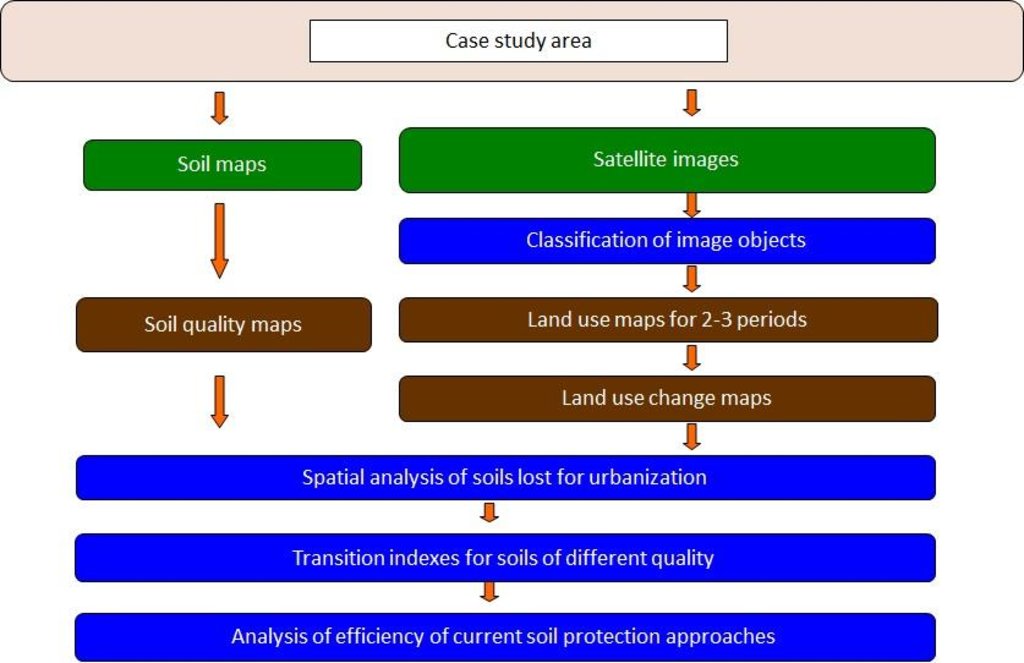
Land use maps of at least 10-meter resolution are produced for two historical periods through classification of the satellite images and using available local land use information. The information on land use change is superimposed on maps characterizing soil quality in order to detect to what extend the urbanization took place on valuable soils. The new sealed area, reflecting the built up sprawl of at least last 15 years, consists with expansion of the following land use classes: continuous residential area, commercial/industrial area and transport facilities. The soils under these new land use types fully lost their environmental functions.
In the soil sealing forecasts the Cellular Automata-based Metronamica model is used. The software was developed and provided by the Research Institute from Knowledge Systems (RIKS) from Maastricht, The Netherlands. The software utilizes cellular automata model to spatially distribute areas of particular land use classes with assumption that the neighborhood of a cell (surrounding cells) influences the transition of this cell into other land use class in the next time step. The method utilizes land use maps and soil quality maps.
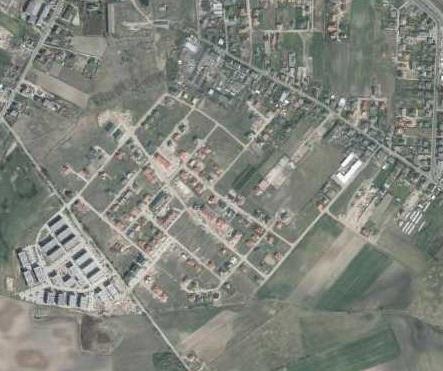
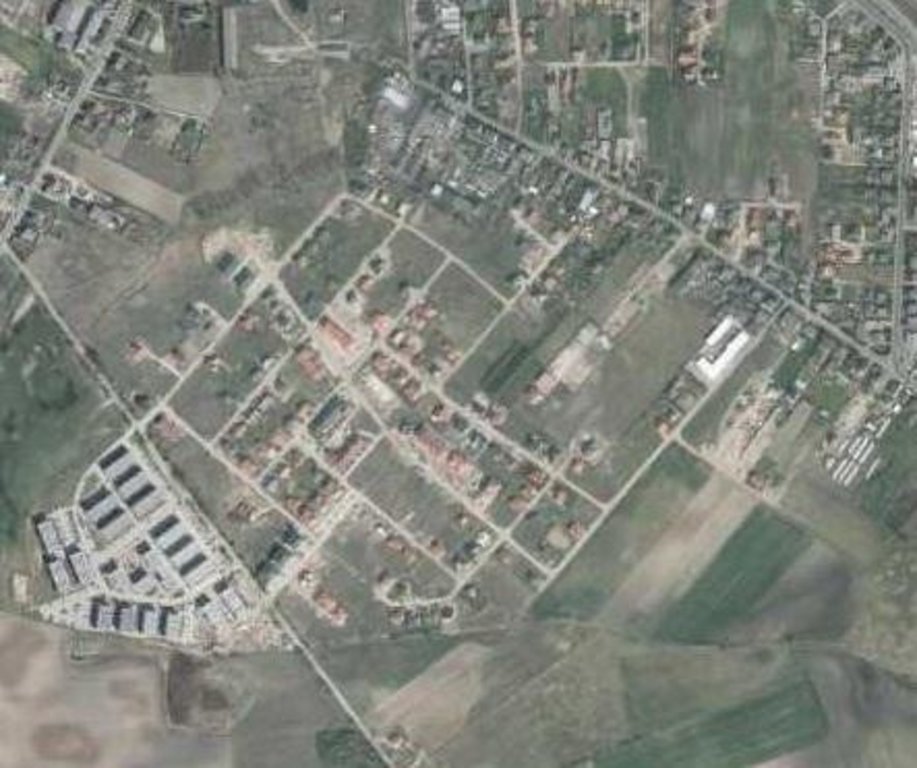
2.3 Photos of the Technology
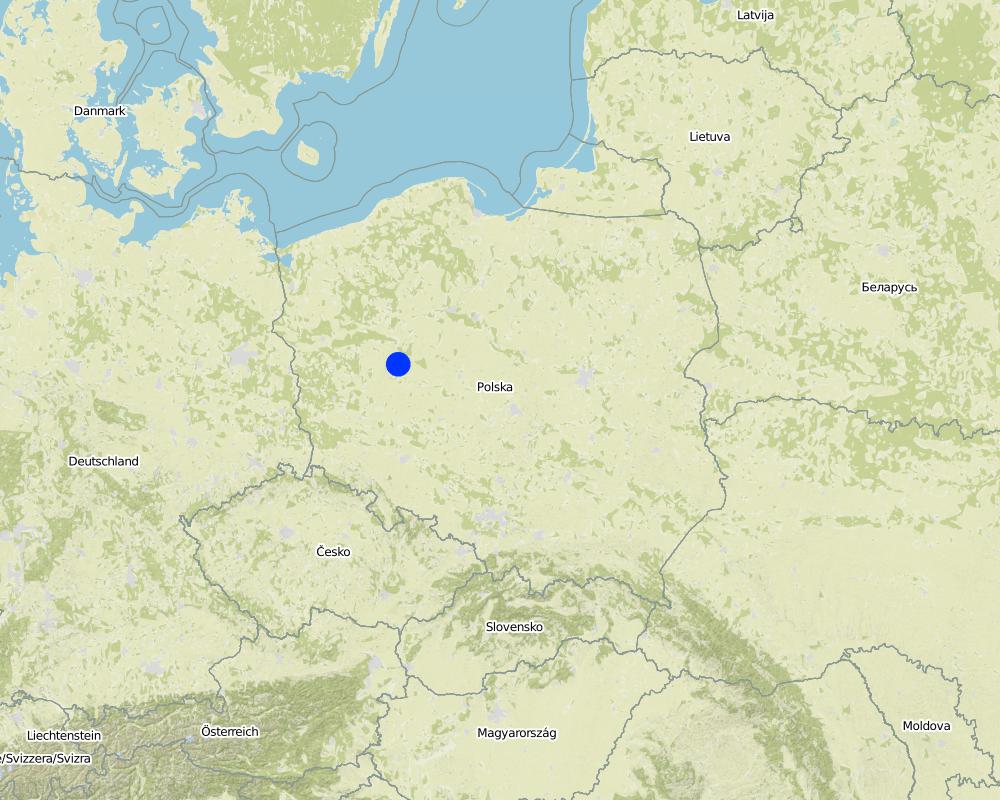
2.5 Country/ region/ locations where the Technology has been applied and which are covered by this assessment
Country:
Poland
Region/ State/ Province:
Poland/Great Poland province
Further specification of location:
Poznań
Specify the spread of the Technology:
- evenly spread over an area
If the Technology is evenly spread over an area, specify area covered (in km2):
199.0
If precise area is not known, indicate approximate area covered:
- 100-1,000 km2
Comments:
Total area covered by the SLM Technology is 199 km2.
Map
×2.6 Date of implementation
If precise year is not known, indicate approximate date:
- less than 10 years ago (recently)
2.7 Introduction of the Technology
Specify how the Technology was introduced:
- during experiments/ research
- through projects/ external interventions
3. Classification of the SLM Technology
3.1 Main purpose(s) of the Technology
- create beneficial economic impact
- create beneficial social impact
- Create and spread knowledge
3.2 Current land use type(s) where the Technology is applied

Cropland
- Annual cropping
Number of growing seasons per year:
- 1
Specify:
Longest growing period in days: 215, Longest growing period from month to month: April - October
Grazing land
Comments:
Major land use problems (compiler’s opinion): Preferential sealing of most productive soils.
3.5 SLM group to which the Technology belongs
- ecosystem-based disaster risk reduction
- Creating and sharing knowledge
3.6 SLM measures comprising the Technology
management measures
- M2: Change of management/ intensity level
3.7 Main types of land degradation addressed by the Technology
physical soil deterioration
- Pu: loss of bio-productive function due to other activities
Comments:
Main causes of degradation: urbanisation and infrastructure development, population pressure, governance / institutional
Secondary causes of degradation: inputs and infrastructure: (roads, markets, distribution of water points, other, …)
3.8 Prevention, reduction, or restoration of land degradation
Specify the goal of the Technology with regard to land degradation:
- prevent land degradation
- reduce land degradation
4. Technical specifications, implementation activities, inputs, and costs
4.1 Technical drawing of the Technology
Technical specifications (related to technical drawing):
This is a schema for soil sealing maps developement.
Technical knowledge required for land users: moderate (Developers)
Technical knowledge required for Administration: high
Technical knowledge required for Researchers: high
Main technical functions: improvement of surface structure (crusting, sealing), increase of infiltration, spatial arrangement and diversification of land use
Secondary technical functions: improvement of water quality, buffering / filtering water
Change of land use type: Limited conversion of agricultural land into urban purposes.
Change of land use practices / intensity level: Steering new constructions to soils with less functions. Limited sealing of high quality soils.
5. Natural and human environment
5.1 Climate
Annual rainfall
- < 250 mm
- 251-500 mm
- 501-750 mm
- 751-1,000 mm
- 1,001-1,500 mm
- 1,501-2,000 mm
- 2,001-3,000 mm
- 3,001-4,000 mm
- > 4,000 mm
Agro-climatic zone
- sub-humid
Thermal climate class: temperate
5.2 Topography
Slopes on average:
- flat (0-2%)
- gentle (3-5%)
- moderate (6-10%)
- rolling (11-15%)
- hilly (16-30%)
- steep (31-60%)
- very steep (>60%)
Landforms:
- plateau/plains
- ridges
- mountain slopes
- hill slopes
- footslopes
- valley floors
Altitudinal zone:
- 0-100 m a.s.l.
- 101-500 m a.s.l.
- 501-1,000 m a.s.l.
- 1,001-1,500 m a.s.l.
- 1,501-2,000 m a.s.l.
- 2,001-2,500 m a.s.l.
- 2,501-3,000 m a.s.l.
- 3,001-4,000 m a.s.l.
- > 4,000 m a.s.l.
Indicate if the Technology is specifically applied in:
- not relevant
5.3 Soils
Soil depth on average:
- very shallow (0-20 cm)
- shallow (21-50 cm)
- moderately deep (51-80 cm)
- deep (81-120 cm)
- very deep (> 120 cm)
Soil texture (topsoil):
- medium (loamy, silty)
Topsoil organic matter:
- medium (1-3%)
If available, attach full soil description or specify the available information, e.g. soil type, soil PH/ acidity, Cation Exchange Capacity, nitrogen, salinity etc.
Soil fertility: High
Soil drainage/infiltration: Medium (ranked 1) and poor (ranked 2)
Soil water storage capacity: Medium
5.4 Water availability and quality
Ground water table:
< 5 m
Availability of surface water:
good
5.6 Characteristics of land users applying the Technology
Market orientation of production system:
- mixed (subsistence/ commercial)
Individuals or groups:
- employee (company, government)
Indicate other relevant characteristics of the land users:
Population density: > 500 persons/km2
5.7 Average area of land used by land users applying the Technology
- < 0.5 ha
- 0.5-1 ha
- 1-2 ha
- 2-5 ha
- 5-15 ha
- 15-50 ha
- 50-100 ha
- 100-500 ha
- 500-1,000 ha
- 1,000-10,000 ha
- > 10,000 ha
Is this considered small-, medium- or large-scale (referring to local context)?
- large-scale
5.8 Land ownership, land use rights, and water use rights
Land ownership:
- individual, titled
Land use rights:
- individual
5.9 Access to services and infrastructure
health:
- poor
- moderate
- good
education:
- poor
- moderate
- good
technical assistance:
- poor
- moderate
- good
employment (e.g. off-farm):
- poor
- moderate
- good
markets:
- poor
- moderate
- good
energy:
- poor
- moderate
- good
roads and transport:
- poor
- moderate
- good
drinking water and sanitation:
- poor
- moderate
- good
financial services:
- poor
- moderate
- good
6. Impacts and concluding statements
6.1 On-site impacts the Technology has shown
Socio-economic impacts
Production
fodder production
Comments/ specify:
comparing to baseline scenario
production area
Comments/ specify:
comparing to baseline scenario
Water availability and quality
irrigation water availability
Comments/ specify:
comparing to baseline scenario
irrigation water quality
Comments/ specify:
comparing to baseline scenario
Socio-cultural impacts
food security/ self-sufficiency
Comments/ specify:
comparing to baseline scenario
recreational opportunities
Comments/ specify:
comparing to baseline scenario
SLM/ land degradation knowledge
Ecological impacts
Water cycle/ runoff
surface runoff
Soil
soil loss
soil crusting/ sealing
soil compaction
Biodiversity: vegetation, animals
habitat diversity
6.2 Off-site impacts the Technology has shown
water availability
downstream flooding
6.5 Adoption of the Technology
Comments:
There are examples of land use and soil maps for spatial planing in cities of Central Europe, e.g. Stuttgart. it is impossible to assess the percentage of users.
6.7 Strengths/ advantages/ opportunities of the Technology
| Strengths/ advantages/ opportunities in the compiler’s or other key resource person’s view |
|---|
| Analysis of various scenarios possible |
| Decisions in spatial planning based on empirical data in spatial format |
6.8 Weaknesses/ disadvantages/ risks of the Technology and ways of overcoming them
| Weaknesses/ disadvantages/ risks in the compiler’s or other key resource person’s view | How can they be overcome? |
|---|---|
| Lack of regulations forcing use of the technology | Pressenting examples of implementation in order to encourage to apply at local level strategies |
| Potential errors in forecasts | Improving the data quality and model effectiveness. |
7. References and links
7.1 Methods/ sources of information
- field visits, field surveys
- interviews with land users
When were the data compiled (in the field)?
28/02/2015
Links and modules
Expand all Collapse allLinks

The prevention of soil sealing [Poland]
The prevention of soil sealing is an approach in which stakeholders are making spatial planning decisions based on the new map of soil sealing, in case of protecting the most valuable soils.
- Compiler: Tomasz Miturski
Modules
No modules


