Sub-surface drainage on irrigated lands [South Africa]
- Creation:
- Update:
- Compiler: Hans Edward King
- Editor: –
- Reviewers: David Streiff, Alexandra Gavilano
Ondergrondse dreinering, brakdreinering, natdreinering (Afrikaans)
technologies_1126 - South Africa
View sections
Expand all Collapse all1. General information
1.2 Contact details of resource persons and institutions involved in the assessment and documentation of the Technology
SLM specialist:
Richter Francois
Department of Agriculture, Western Cape, Wellington
South Africa
SLM specialist:
Smit Jan
Department of Agriculture, Western Cape, Wellington
South Africa
SLM specialist:
Steyn Francis
Department of Agriculture, Western Cape, George
South Africa
SLM specialist:
Oliver Gert
Department of Agriculture, Western Cape, Moorreesburg
South Africa
Name of the institution(s) which facilitated the documentation/ evaluation of the Technology (if relevant)
Dept. of Agriculture, Western Cape (Dept. of Agriculture, Western Cape) - South Africa1.3 Conditions regarding the use of data documented through WOCAT
The compiler and key resource person(s) accept the conditions regarding the use of data documented through WOCAT:
Yes
2. Description of the SLM Technology
2.1 Short description of the Technology
Definition of the Technology:
Drainage of saturated and salinised soils by means of sub-soil drainage pipes
2.2 Detailed description of the Technology
Description:
There is a lot of soil, wind and water erosion in this area. River erosion, not related to this SWC, is a problem over the whole area (on average 20 t/ha/y). Sheet and gully erosion occurs on commercial land. The whole area along the rivers varies up to 50 km.
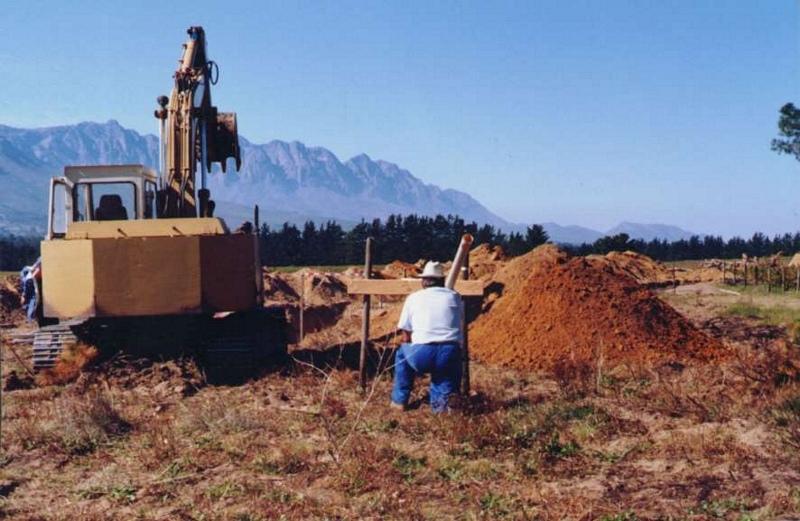
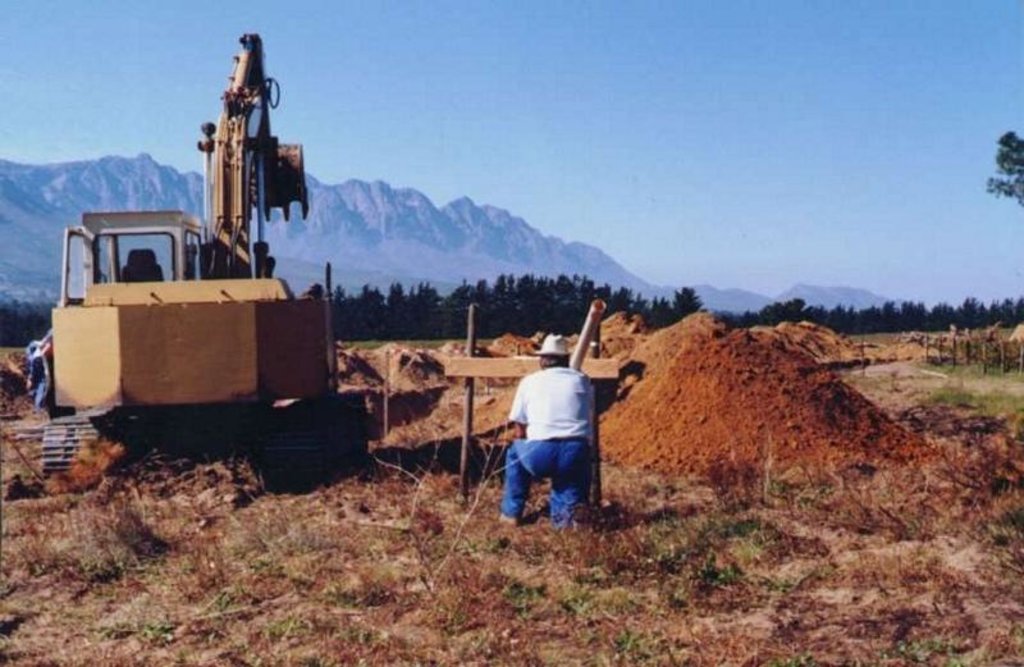
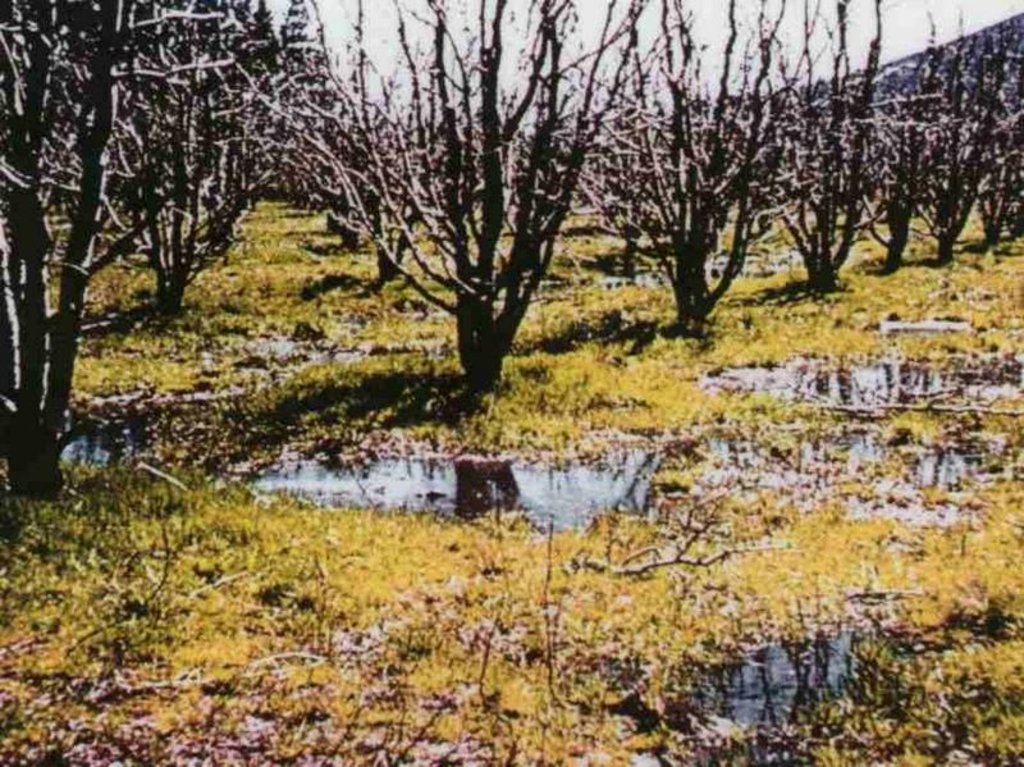
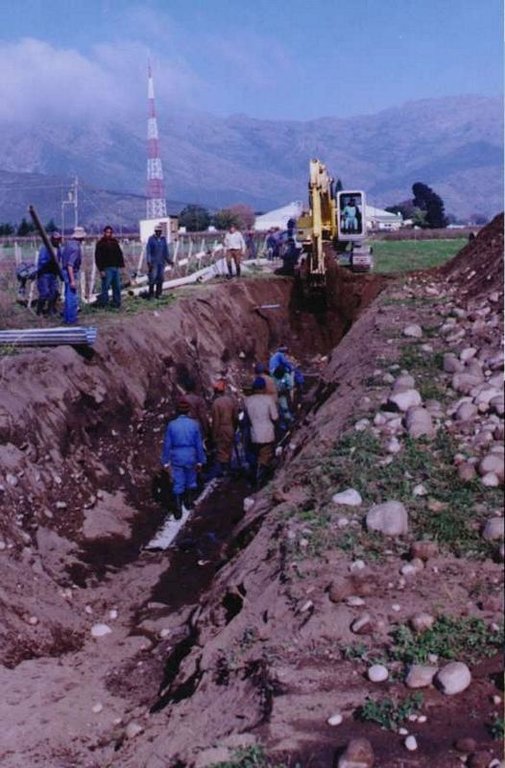
In some places drainage is inadequate and water-logging occurs. A system of sub-soil perforated pipes with surrounding filters was installed. Pipes laid at spacing determined according to the site conditions.
The overall purpose was to limit the level of the water table in the soil profile and remove salts, to provide an adequately aerated zone in the soil for a crops’ root system.
The system must be planned by a suitably trained person and constructed by an expert.
Drainage pipes must be flushed at least annually and roots removed whenever present.
2.3 Photos of the Technology
2.5 Country/ region/ locations where the Technology has been applied and which are covered by this assessment
Country:
South Africa
Region/ State/ Province:
Western Cape Province
Further specification of location:
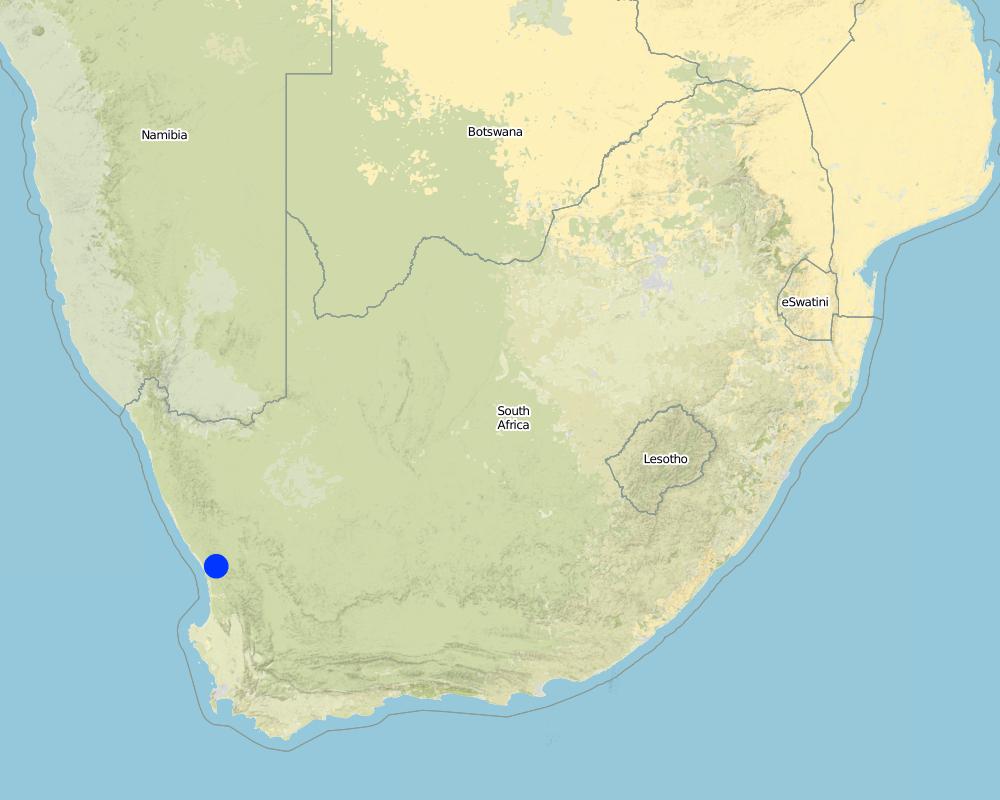
Southern Cape, Boland, Swartland
Specify the spread of the Technology:
- evenly spread over an area
If the Technology is evenly spread over an area, specify area covered (in km2):
240.0
If precise area is not known, indicate approximate area covered:
- 100-1,000 km2
Comments:
Total area covered by the SLM Technology is 240 km2.
Technology also applied in other provinces. Boland 60% under agriculture and from this 20% under this technology. Swartland mainly wheat, 10% under irrigation and from this 20% is already drained. Southern Cape: 20% irrigated of which 20% is drained, 95% commercial farmers. Other parts in SA: KwaZulu/Natal (Pongola), Free state (Rietriver, Orange River), Northern Cape (Vaalharts, Douglas, Upington), Eastern Cape (Fish River, Sundays River, Langkloof)
Map
×2.6 Date of implementation
If precise year is not known, indicate approximate date:
- less than 10 years ago (recently)
2.7 Introduction of the Technology
Specify how the Technology was introduced:
- through projects/ external interventions
Comments (type of project, etc.):
Holland, USA - literature
3. Classification of the SLM Technology
3.1 Main purpose(s) of the Technology
- reduce, prevent, restore land degradation
3.2 Current land use type(s) where the Technology is applied

Cropland
- Tree and shrub cropping
Tree and shrub cropping - Specify crops:
- citrus
- grapes
- pome fruits (apples, pears, quinces, etc.)
Number of growing seasons per year:
- 1
Specify:
Longest growing period in days: 120; Longest growing period from month to month: Sep - Mar
Comments:
major food crop: Deciduous fruit/citrus
other: Grapes
Major land use problems (compiler’s opinion): Bad management (over irrigation). The washing of soil from one land to the other. High winter rainfall.
Major land use problems (land users’ perception): Loss of crop production due to saturation/salinisation of soil. Not putting money back what would be expect, because not enough growth, reduced crop roots deeper in soil and no growth in the area, slanted growth - salinised soils.
3.5 SLM group to which the Technology belongs
- irrigation management (incl. water supply, drainage)
3.6 SLM measures comprising the Technology
structural measures
- S7: Water harvesting/ supply/ irrigation equipment
3.7 Main types of land degradation addressed by the Technology
chemical soil deterioration
- Cs: salinization/ alkalinization
physical soil deterioration
- Pw: waterlogging
Comments:
Secondary types of degradation addressed: Cs: salinisation / alkalinisation
Main causes of degradation: other natural causes (avalanches, volcanic eruptions, mud flows, highly susceptible natural resources, extreme topography, etc.) specify (Rising water tables - As result of over irrigation, leaking dams and canals)
Secondary causes of degradation: education, access to knowledge and support services (Lack of knowledge - Build dams & canals that leak, over irrigation)
3.8 Prevention, reduction, or restoration of land degradation
Specify the goal of the Technology with regard to land degradation:
- prevent land degradation
- restore/ rehabilitate severely degraded land
4. Technical specifications, implementation activities, inputs, and costs
4.1 Technical drawing of the Technology
Technical specifications (related to technical drawing):
Technical knowledge required for field staff / advisors: high
Technical knowledge required for land users: moderate
Main technical functions: Removal of salts from soils, Decrease water table, Increase of soil aeration
Structural measure: subsurface drains
Vertical interval between structures (m): n/a
Spacing between structures (m): 40-80
Depth of ditches/pits/dams (m): 1.5-2.5
Length of ditches/pits/dams (m): 300
Construction material (other): Plastic perforated pipe with crushed stone filter
Slope (which determines the spacing indicated above): 2%
Lateral gradient along the structure: 2%
4.2 General information regarding the calculation of inputs and costs
Specify currency used for cost calculations:
- USD
Indicate average wage cost of hired labour per day:
15.00
4.3 Establishment activities
| Activity | Timing (season) | |
|---|---|---|
| 1. | Dig trench | 150m/day, dry season Dec-Apr |
| 2. | Lay pipe | 150m/day, dry season Dec-Apr |
| 3. | Place filter material | 150m/day, dry season Dec-Apr |
| 4. | Build manholes | 150m/day, dry season Dec-Apr |
| 5. | Backfill trench | 150m/day, dry season Dec-Apr |
4.4 Costs and inputs needed for establishment
| Specify input | Unit | Quantity | Costs per Unit | Total costs per input | % of costs borne by land users | |
|---|---|---|---|---|---|---|
| Labour | Install drainage system | persons/day/ha | 10.0 | 15.0 | 150.0 | 75.0 |
| Equipment | Machine use | ha | 1.0 | 450.0 | 450.0 | 75.0 |
| Construction material | Stone | ha | 1.0 | 100.0 | 100.0 | 75.0 |
| Construction material | Pipes | ha | 1.0 | 240.0 | 240.0 | 75.0 |
| Construction material | Manholes | ha | 1.0 | 250.0 | 250.0 | 75.0 |
| Other | Contractor overheads | ha | 1.0 | 200.0 | 200.0 | 75.0 |
| Total costs for establishment of the Technology | 1390.0 | |||||
| Total costs for establishment of the Technology in USD | 1390.0 | |||||
Comments:
Duration of establishment phase: 12 month(s)
4.5 Maintenance/ recurrent activities
| Activity | Timing/ frequency | |
|---|---|---|
| 1. | Flush pipes with water | All year/2 times a year |
| 2. | Cut roots in pipes | When required/ |
| 3. | Clean manholes | All year/2 times a year (was reduced) |
4.6 Costs and inputs needed for maintenance/ recurrent activities (per year)
| Specify input | Unit | Quantity | Costs per Unit | Total costs per input | % of costs borne by land users | |
|---|---|---|---|---|---|---|
| Labour | Maintenance | ha | 1.0 | 25.0 | 25.0 | 100.0 |
| Total costs for maintenance of the Technology | 25.0 | |||||
| Total costs for maintenance of the Technology in USD | 25.0 | |||||
Comments:
Length of pipe (grid at 60 m spacing - i.e. pipe that average team lays in one day)
4.7 Most important factors affecting the costs
Describe the most determinate factors affecting the costs:
Suitability of soil for drainage (greater depth and permeability = lower costs.
5. Natural and human environment
5.1 Climate
Annual rainfall
- < 250 mm
- 251-500 mm
- 501-750 mm
- 751-1,000 mm
- 1,001-1,500 mm
- 1,501-2,000 mm
- 2,001-3,000 mm
- 3,001-4,000 mm
- > 4,000 mm
Specifications/ comments on rainfall:
501-750 mm is closer to the mountain
Agro-climatic zone
- semi-arid
5.2 Topography
Slopes on average:
- flat (0-2%)
- gentle (3-5%)
- moderate (6-10%)
- rolling (11-15%)
- hilly (16-30%)
- steep (31-60%)
- very steep (>60%)
Landforms:
- plateau/plains
- ridges
- mountain slopes
- hill slopes
- footslopes
- valley floors
Altitudinal zone:
- 0-100 m a.s.l.
- 101-500 m a.s.l.
- 501-1,000 m a.s.l.
- 1,001-1,500 m a.s.l.
- 1,501-2,000 m a.s.l.
- 2,001-2,500 m a.s.l.
- 2,501-3,000 m a.s.l.
- 3,001-4,000 m a.s.l.
- > 4,000 m a.s.l.
5.3 Soils
Soil depth on average:
- very shallow (0-20 cm)
- shallow (21-50 cm)
- moderately deep (51-80 cm)
- deep (81-120 cm)
- very deep (> 120 cm)
Soil texture (topsoil):
- coarse/ light (sandy)
- medium (loamy, silty)
Topsoil organic matter:
- low (<1%)
If available, attach full soil description or specify the available information, e.g. soil type, soil PH/ acidity, Cation Exchange Capacity, nitrogen, salinity etc.
Soil fertility is medium - low
Soil drainage / infiltration is medium
Soil water storage capacity is low
5.6 Characteristics of land users applying the Technology
Market orientation of production system:
- mixed (subsistence/ commercial)
- commercial/ market
Off-farm income:
- less than 10% of all income
Relative level of wealth:
- average
- rich
Level of mechanization:
- mechanized/ motorized
Indicate other relevant characteristics of the land users:
Population density: 50-100 persons/km2
Annual population growth: 1% - 2%
20% of the land users are rich and own 30% of the land.
60% of the land users are average wealthy and own 50% of the land.
20% of the land users are poor and own 20% of the land.
Off-farm income specification: Most of them are only farmers.
Level of mechanization: Tractors, trailer, plough, crop sprayers
5.7 Average area of land used by land users applying the Technology
- < 0.5 ha
- 0.5-1 ha
- 1-2 ha
- 2-5 ha
- 5-15 ha
- 15-50 ha
- 50-100 ha
- 100-500 ha
- 500-1,000 ha
- 1,000-10,000 ha
- > 10,000 ha
Comments:
Average area of land owned or leased by land users applying the Technology: Also 100-500 ha, but production capacity on all is really the same
5.8 Land ownership, land use rights, and water use rights
Land ownership:
- group
- individual, titled
Land use rights:
- communal (organized)
- individual
6. Impacts and concluding statements
6.1 On-site impacts the Technology has shown
Socio-economic impacts
Production
crop production
land management
Comments/ specify:
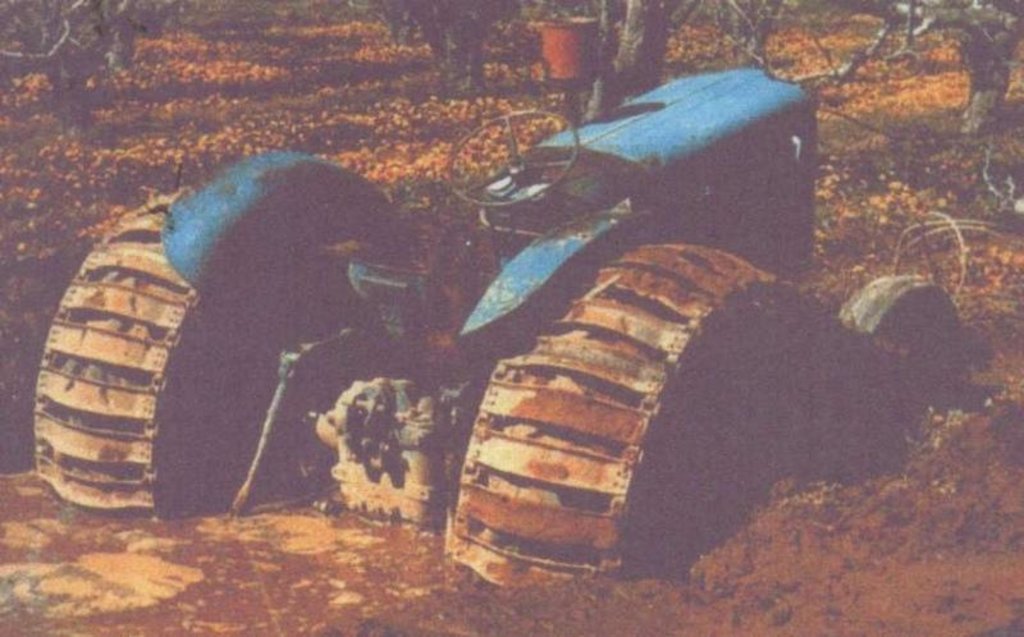
During rainy season (winter) tractor can drive on field without getting stuck in the mud, but construction process and maintenance of intercrops farming activities (negligble)
Income and costs
farm income
Other socio-economic impacts
on farm employment
Comments/ specify:
due to higher workload
input constraints
Comments/ specify:
Construction must be financed
Socio-cultural impacts
community institutions
SLM/ land degradation knowledge
Ecological impacts
Water cycle/ runoff
surface runoff
excess water drainage
Soil
soil cover
Comments/ specify:
Less bare soil
Other ecological impacts
soil fertility
restoration of original topsoil aeration
Comments/ specify:
Most of this soils have originally been saturated
6.2 Off-site impacts the Technology has shown
reliable and stable stream flows in dry season
downslope salinatation
6.4 Cost-benefit analysis
How do the benefits compare with the establishment costs (from land users’ perspective)?
Short-term returns:
slightly positive
Long-term returns:
very positive
How do the benefits compare with the maintenance/ recurrent costs (from land users' perspective)?
Short-term returns:
very positive
Long-term returns:
very positive
6.5 Adoption of the Technology
- 11-50%
If available, quantify (no. of households and/ or area covered):
50 percent of all households in this area
Of all those who have adopted the Technology, how many did so spontaneously, i.e. without receiving any material incentives/ payments?
- 11-50%
Comments:
50% of land user families have adopted the Technology with external material support
Comments on acceptance with external material support: estimates
50% of land user families have adopted the Technology without any external material support
Comments on spontaneous adoption: estimates
There is a moderate trend towards spontaneous adoption of the Technology
Comments on adoption trend: More and more farmers are coming to do ditch drainage because there's more money available, if waiting period is more than 3 months the service from government is free of charge.
6.7 Strengths/ advantages/ opportunities of the Technology
| Strengths/ advantages/ opportunities in the land user’s view |
|---|
| Greatly improved crop yield |
| Improved access for mechanisation |
| Strengths/ advantages/ opportunities in the compiler’s or other key resource person’s view |
|---|
| Greatly improved crop yield |
| Improved access for mechanisation |
6.8 Weaknesses/ disadvantages/ risks of the Technology and ways of overcoming them
| Weaknesses/ disadvantages/ risks in the land user’s view | How can they be overcome? |
|---|---|
| Initial capital outlay | |
| Slight decreased in run-off water quality | |
| Insufficient information on soil properties |
| Weaknesses/ disadvantages/ risks in the compiler’s or other key resource person’s view | How can they be overcome? |
|---|---|
| Initial capital outlay | |
| Slight decreased in run-off water quality | |
| Insufficient information on soil properties |
7. References and links
7.1 Methods/ sources of information
7.2 References to available publications
Title, author, year, ISBN:
Drainage Works for Western Cape (Afrikaans). July 1988.
Available from where? Costs?
HE King
Title, author, year, ISBN:
National Drainage Manual (Afrikaans)
Available from where? Costs?
NDA - photostat costs
Links and modules
Expand all Collapse allLinks
No links
Modules
No modules


