Transforming a coconut monocrop into a multi-storey food forest [India]
- Creation:
- Update:
- Compiler: Praveena Sridhar
- Editors: Rushabh Desadla, Aditya Tated, Dhyana Balasubramanian, Vishwesh Singh, Lu Yu
- Reviewers: William Critchley, Joana Eichenberger
Ottraipayir Thennai Sagubadi Muraiyai Pala Adukku Unavu Kaadaga Matruthal.
technologies_7366 - India
View sections
Expand all Collapse all1. General information
1.2 Contact details of resource persons and institutions involved in the assessment and documentation of the Technology
SLM specialist:
SLM specialist:
Name of project which facilitated the documentation/ evaluation of the Technology (if relevant)
Save Soil MovementName of the institution(s) which facilitated the documentation/ evaluation of the Technology (if relevant)
Conscious Planet - Save Soil (Save Soil)1.3 Conditions regarding the use of data documented through WOCAT
The compiler and key resource person(s) accept the conditions regarding the use of data documented through WOCAT:
Yes
1.4 Declaration on sustainability of the described Technology
Is the Technology described here problematic with regard to land degradation, so that it cannot be declared a sustainable land management technology?
No
1.5 Reference to Questionnaire(s) on SLM Approaches (documented using WOCAT)
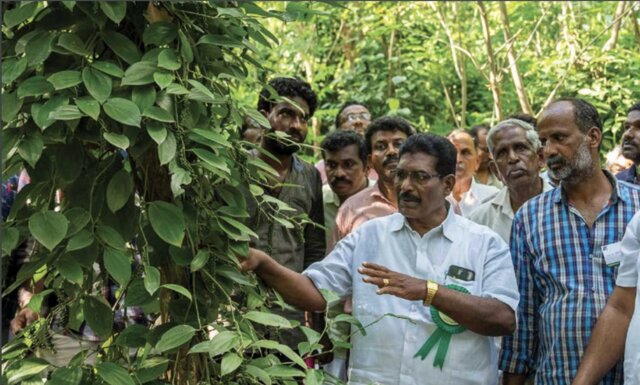
Conscious Planet - Save Soil’s Farmer Training and … [India]
The approach focuses on supporting farmers to increase productivity by increasing soil biology and organic matter content, primarily through plant residue and animal waste. Awareness and advocacy are followed by training programs and support for adopting regenerative agricultural practices.
- Compiler: Praveena Sridhar
2. Description of the SLM Technology
2.1 Short description of the Technology
Definition of the Technology:
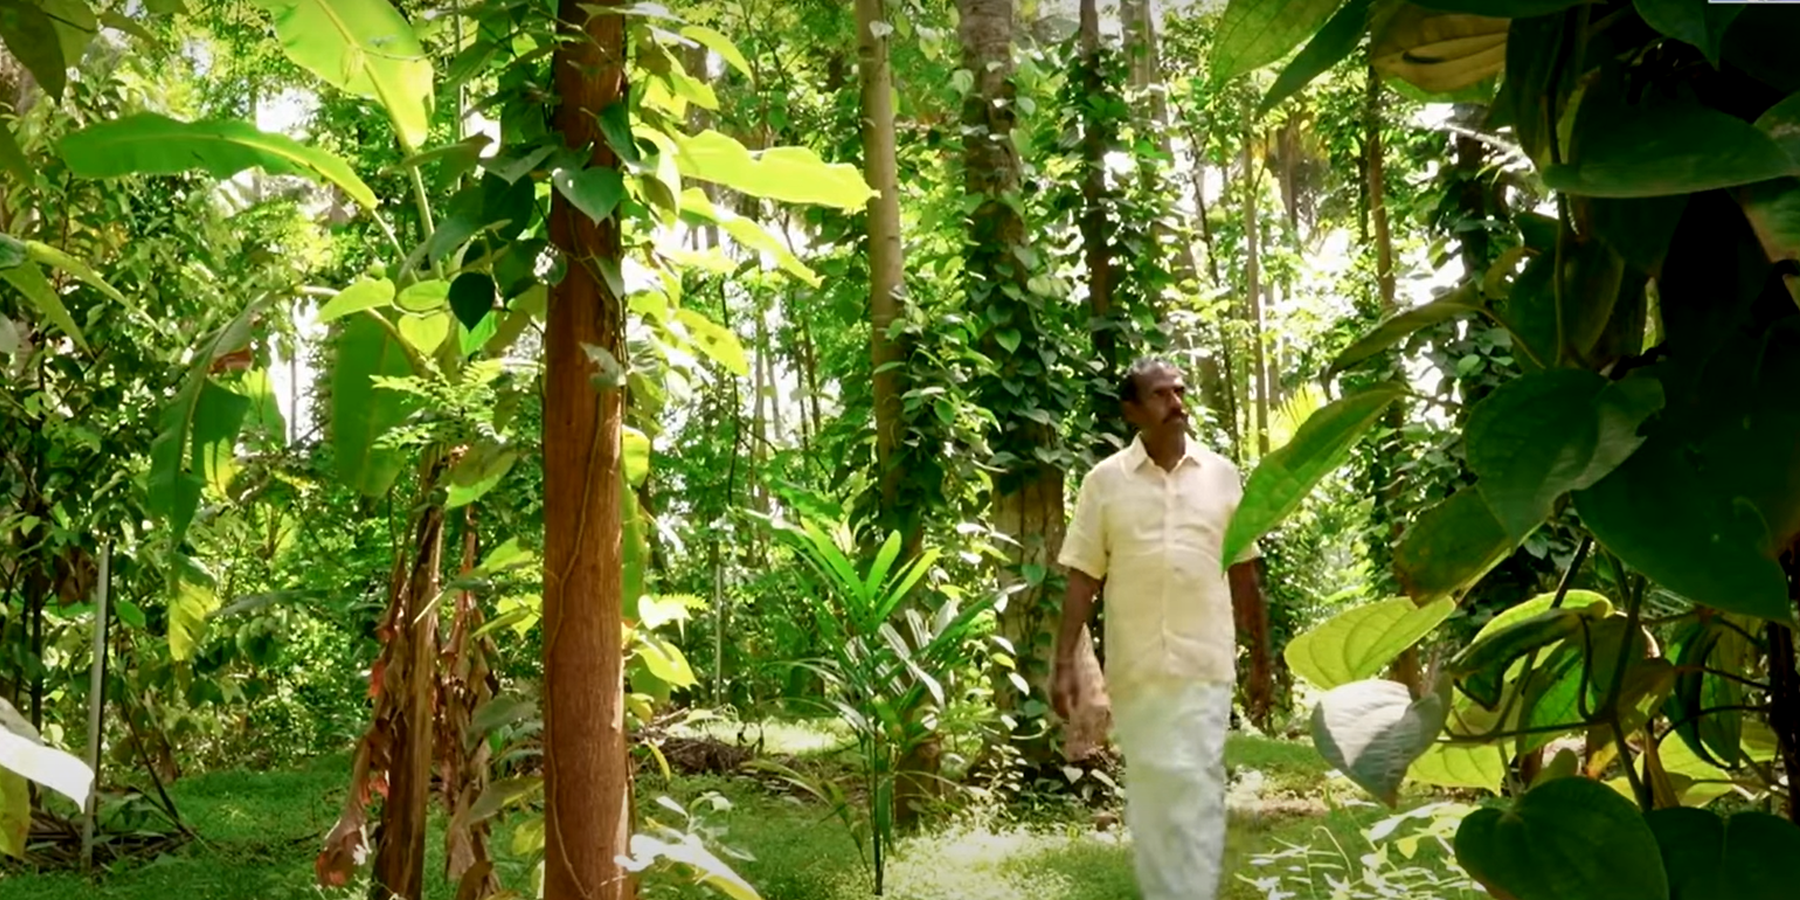
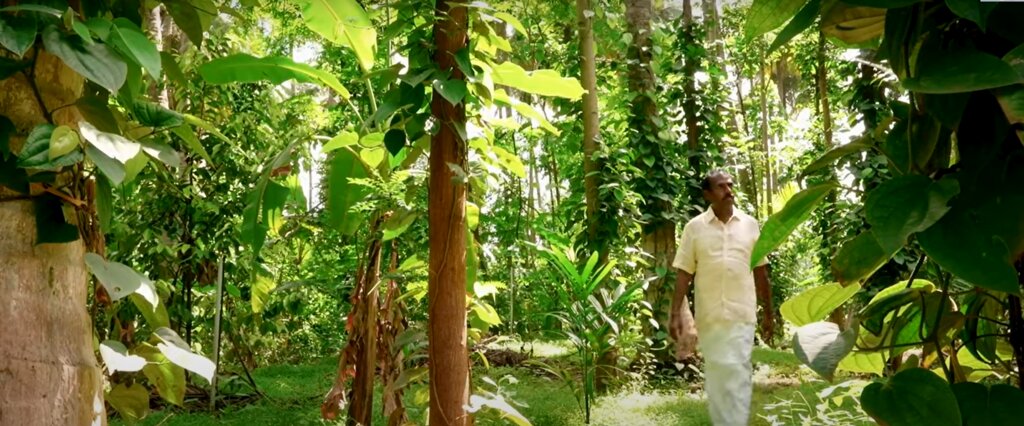
Transforming a monocrop coconut farm into a resilient food forest can sustainably enhance soil health, biodiversity and productivity while reducing labour and external input requirements. This demonstrates the potential to increase yields and provide long-term economic and ecological stability for farmers.
2.2 Detailed description of the Technology
Description:
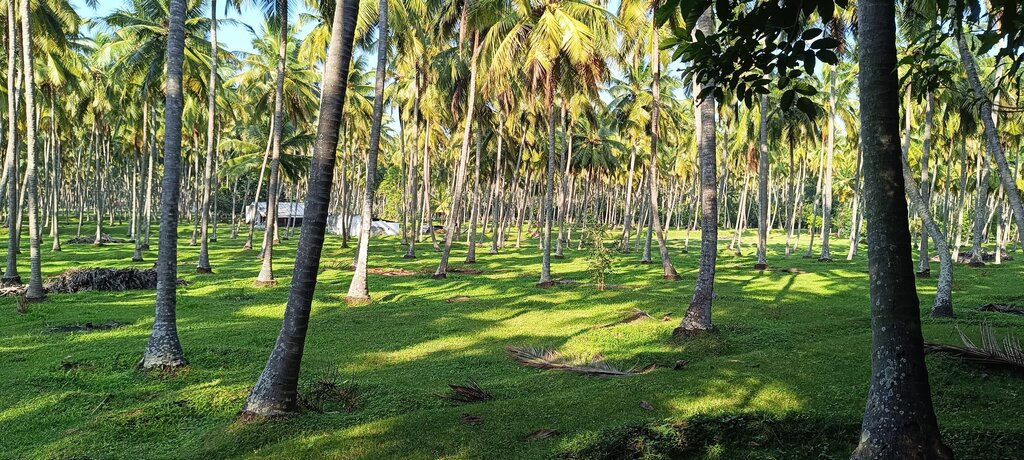
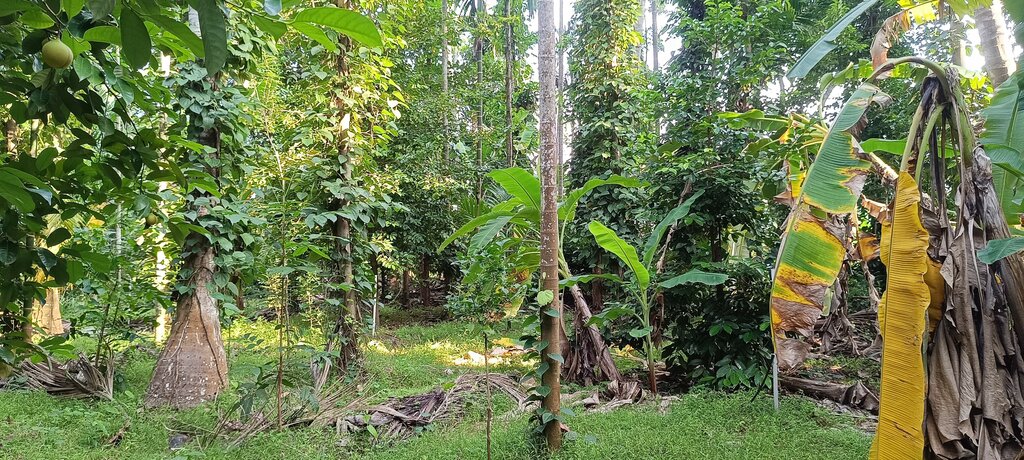
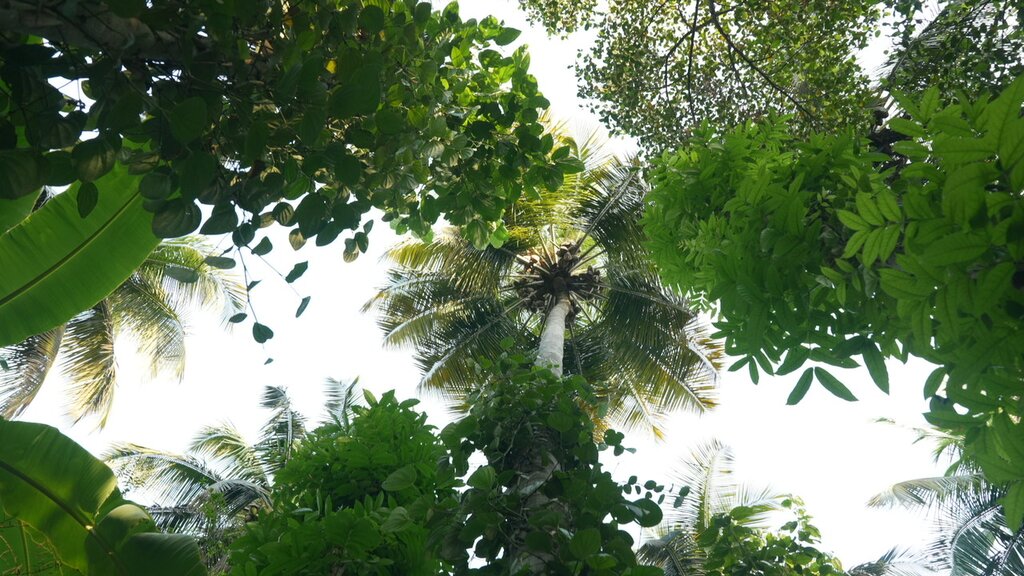
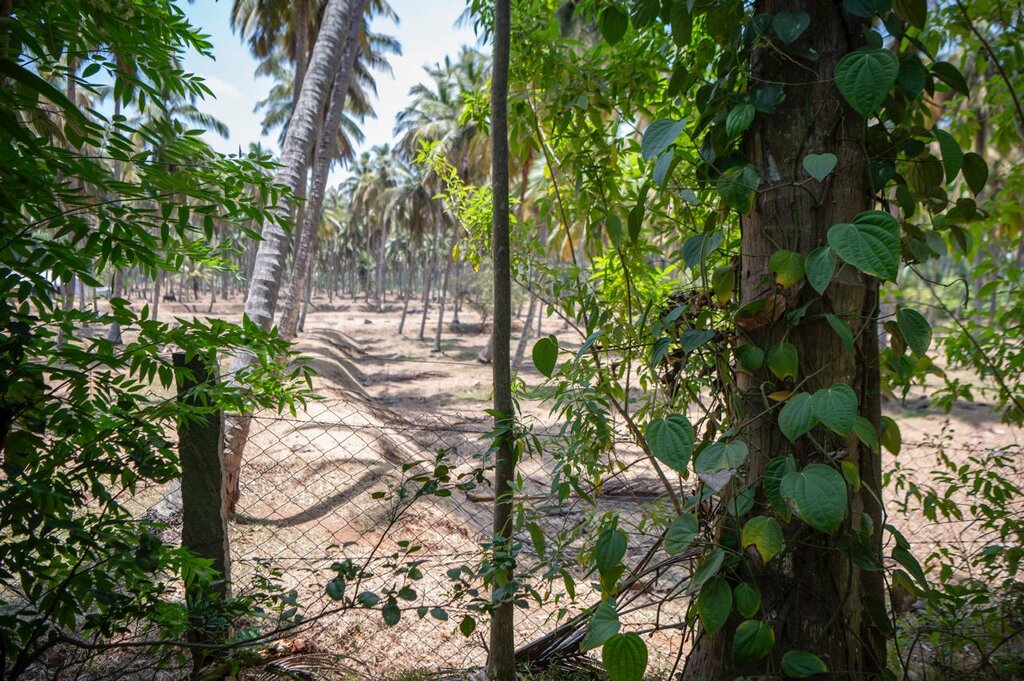
Transforming a monocrop coconut farm into a resilient food forest can sustainably enhance soil health, biodiversity, and productivity while reducing labour and external input requirements. This demonstrates the potential to increase yields and provide long-term economic and ecological stability for farmers. Experience was gained from implementation in 2008 on a monocrop coconut farm in Pollachi, Tamil Nadu. The stages were as follows:
1) Rainwater management: Trenches were dug throughout the farm to retain rainwater and prevent runoff, thus enhancing soil moisture. This was critical given the limited rainfall in the region. A drip irrigation system was installed for efficient watering.
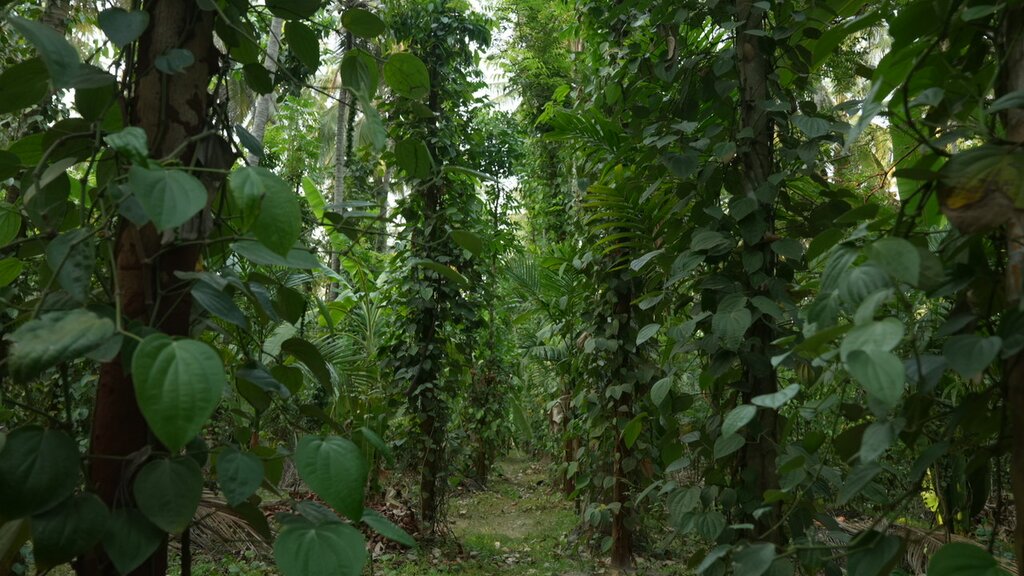
2) Plant diversity: Various crops were introduced. Nutmeg, intercropped among coconut trees, provides 3 - 4 times the income of coconuts after 15 to 20 years. Timber trees extract micronutrients from deeper soil layers via deep tap roots: micronutrients are concentrated in the leaves which are used as mulch to enrich the soil nutrient profile. Banana and papaya provided early income, shade for plants, and added biomass. This diversity also ensures a steady income, reducing dependency on external markets.
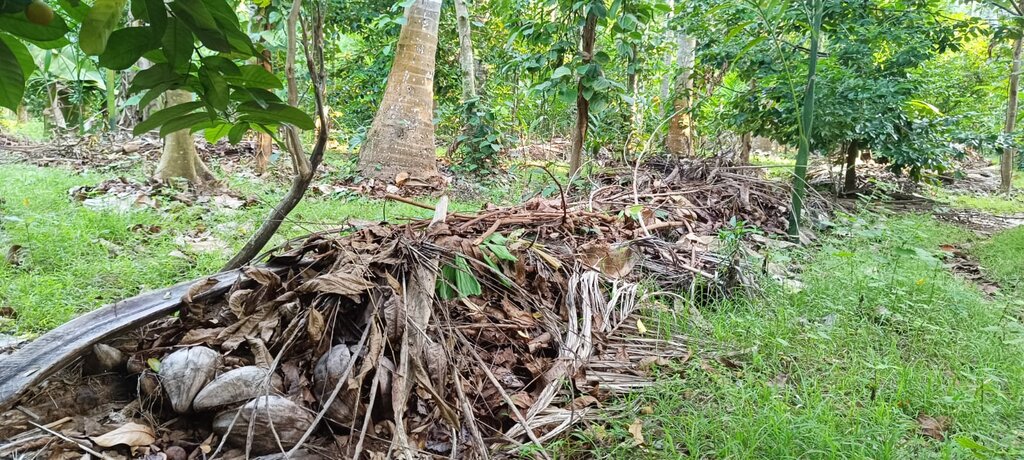
3) Biomass and soil fertility improvement: Fast-growing crops were planted to generate additional biomass. Leaves were pruned and added to the water-retaining trenches as mulch. Nitrogen-fixing plants were cultivated extensively to improve soil fertility, eliminating the need for chemical fertilizers.
4) Mulch and bio-input application: Mulch in the trenches was decomposed by the bio-inputs from Cows (Earlier 2, now 1) applied via drip lines, which increased soil organic matter through enhanced microbial decomposition. The irrigation and sprinklers were used judiciously to achieve soil moisture rather than over-watering, as trees primarily needed stable moisture conditions.
5) Minimal maintenance approach: After establishing this system, the farm required minimal maintenance. There was no need for tilling, weeding, or other intensive practices, just monitoring of, and maintaining, moisture levels. This low-maintenance approach reduces farmers’ workloads and improves their quality of life.
6) Enhanced biodiversity and pest management: To further enhance biodiversity, flowering plants to attract pollinators and predatory insects can be planted along the farm's boundaries - though this was not done at this particular site. Nonetheless, the increased biodiversity already fostered here brought in earthworms, birds, and beneficial insects for natural pest management.
After 12 years of minimal maintenance, soil organic matter content increased from 0.5% to 3.36%, and both production quantity and quality increased. The farm retained high soil moisture despite periods of low rainfall. Land users liked the use of minimal inputs, crop diversification as a financial safety net, and the visible impact on soil health and yield, as well as the increase in land value. There was initial fear about time and money invested and doubts about the feasibility of a technology that challenged the status quo of the region. Digging trenches and planting saplings were physically demanding. The initial pest pressure was also a concern before a stable ecosystem was established. The transformation of this coconut monoculture into a diverse food forest has demonstrated a sustainable model of enhanced resilience, productivity, and biodiversity. This model can be replicated across similar regions to help minimize labor and improve farmers’ livelihoods while restoring land and ecosystems.
2.3 Photos of the Technology
2.4 Videos of the Technology
Comments, short description:
With a few simple interventions, soil that was infertile was brought back to life.
YouTube video link: https://youtu.be/Pt4AEXzgTfc?feature=shared
Date:
10/06/2022
Location:
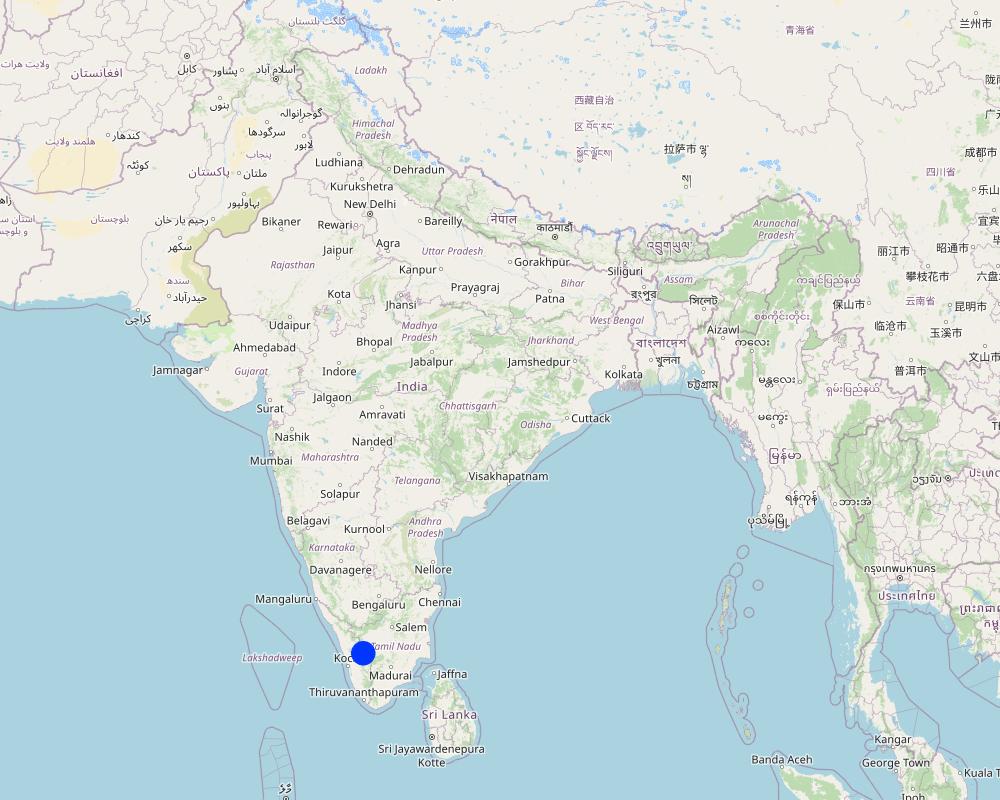
Pollachi, Tamil Nadu
Name of videographer:
Save Soil Media team
2.5 Country/ region/ locations where the Technology has been applied and which are covered by this assessment
Country:
India
Region/ State/ Province:
Tamil Nadu
Further specification of location:
Pollachi
Specify the spread of the Technology:
- applied at specific points/ concentrated on a small area
Is/are the technology site(s) located in a permanently protected area?
No
Map
×2.6 Date of implementation
If precise year is not known, indicate approximate date:
- 10-50 years ago
2.7 Introduction of the Technology
Specify how the Technology was introduced:
- through projects/ external interventions
Comments (type of project, etc.):
The key contributions to the project's technical knowledge include Ethirajalu R (Technical Expert), Anand Ethirajal (Operations Lead), and Dr. Poonyamurti (Ethnoveterinary Medicines Expert). Their expertise, along with the valuable insights shared by Indian stalwarts like Nammalwar, Sripad Davolkar, and Subhash Palekar
3. Classification of the SLM Technology
3.1 Main purpose(s) of the Technology
- improve production
- reduce, prevent, restore land degradation
- preserve/ improve biodiversity
- mitigate climate change and its impacts
- create beneficial economic impact
3.2 Current land use type(s) where the Technology is applied
Land use mixed within the same land unit:
Yes
Specify mixed land use (crops/ grazing/ trees):
- Agroforestry

Cropland
- Perennial (non-woody) cropping
- Tree and shrub cropping
- Climbers : Pepper
Perennial (non-woody) cropping - Specify crops:
- banana/plantain/abaca
- medicinal, aromatic, pesticidal plants - perennial
- Curry Leaves, Lime, Turmeric, Papaya
Tree and shrub cropping - Specify crops:
- coconut (fruit, coir, leaves, etc.)
- Nutmeg, Mahogany, Mountain Neem, Kino, Red Sandalwood, Blackwood, White Teak, Iron Wood
Number of growing seasons per year:
- 1
Is intercropping practiced?
Yes
Is crop rotation practiced?
No
3.3 Has land use changed due to the implementation of the Technology?
Has land use changed due to the implementation of the Technology?
- Yes (Please fill out the questions below with regard to the land use before implementation of the Technology)
Land use mixed within the same land unit:
No

Cropland
- Tree and shrub cropping
Tree and shrub cropping - Specify crops:
- coconut (fruit, coir, leaves, etc.)
Is intercropping practiced?
No
Is crop rotation practiced?
No
3.4 Water supply
Water supply for the land on which the Technology is applied:
- mixed rainfed-irrigated
3.5 SLM group to which the Technology belongs
- agroforestry
- improved ground/ vegetation cover
- integrated soil fertility management
3.6 SLM measures comprising the Technology
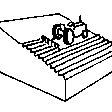
agronomic measures
- A1: Vegetation/ soil cover
- A2: Organic matter/ soil fertility
- A6: Residue management
A6: Specify residue management:
A 6.4: retained
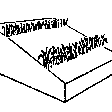
vegetative measures
- V1: Tree and shrub cover
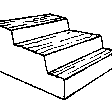
structural measures
- S2: Bunds, banks
- S4: Level ditches, pits
- S6: Walls, barriers, palisades, fences
- S7: Water harvesting/ supply/ irrigation equipment
- S8: Sanitation/ waste water structures
- S9: Shelters for plants and animals
3.7 Main types of land degradation addressed by the Technology
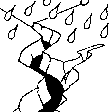
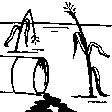
soil erosion by water
- Wt: loss of topsoil/ surface erosion

soil erosion by wind
- Et: loss of topsoil
chemical soil deterioration
- Cn: fertility decline and reduced organic matter content (not caused by erosion)
- Ca: acidification
- Cp: soil pollution
- Cs: salinization/ alkalinization
physical soil deterioration
- Pc: compaction

biological degradation
- Bc: reduction of vegetation cover
- Bh: loss of habitats
- Bq: quantity/ biomass decline
- Bs: quality and species composition/ diversity decline
- Bl: loss of soil life
- Bp: increase of pests/ diseases, loss of predators

water degradation
- Ha: aridification
- Hs: change in quantity of surface water
- Hg: change in groundwater/aquifer level
- Hq: decline of groundwater quality
3.8 Prevention, reduction, or restoration of land degradation
Specify the goal of the Technology with regard to land degradation:
- restore/ rehabilitate severely degraded land
4. Technical specifications, implementation activities, inputs, and costs
4.1 Technical drawing of the Technology
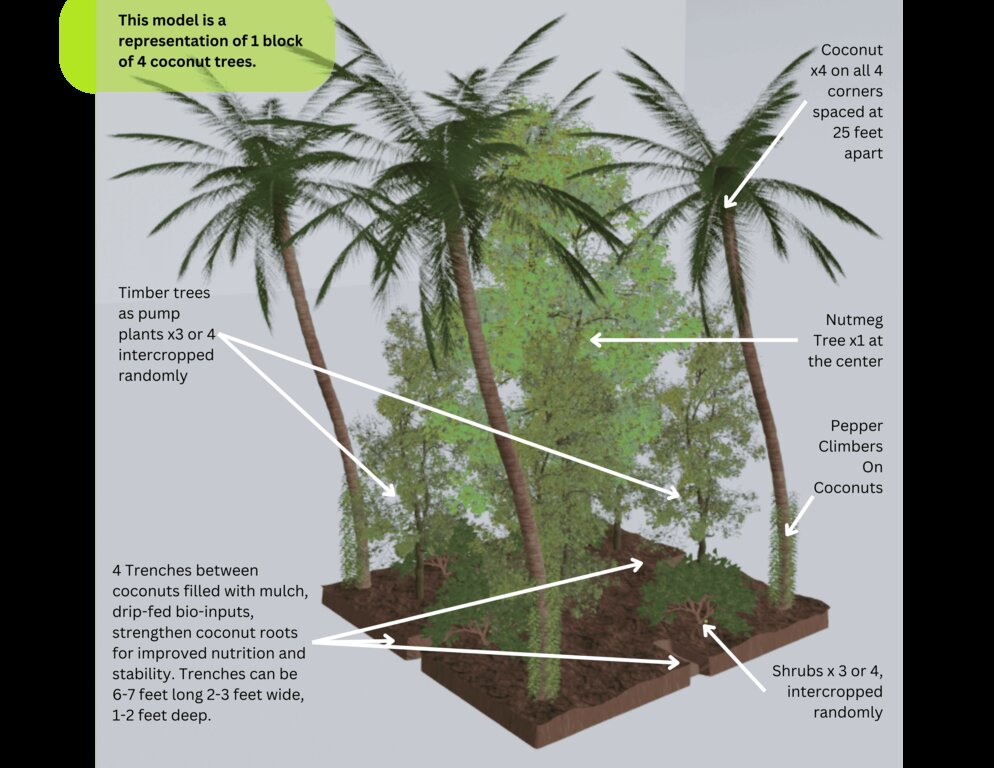
Technical specifications (related to technical drawing):
Area: 25 x 25 square feet.
Number of Coconut Trees: 4
Number of Nutmeg Trees: 1
Number of Pepper Climbers: 4
Number of Shrubs: 3-4 (Lime, Curry leaves, Medicinal herbs and Turmeric)
Number of Timber Trees : 3-4 (Mahogany, Mountain Neem, Kino, Red Sandalwood, Blackwood, White Teak and Ironwood)
Number of trenches : 4 ( 6x3x2 ft each, half in this block, half extended to the next block.
Irrigation System: Drip and a Center Fog Sprinkler for creating moisture in the atmosphere.
Input application: Cow dung and Cow urine mix flows to the trench covered with biomass. Decomposes it over time and creates humus for all the plants.
Initially biomass crops are planted, slowly transitioning to trees as the soil improves.
No maintenance after 3-4 years.
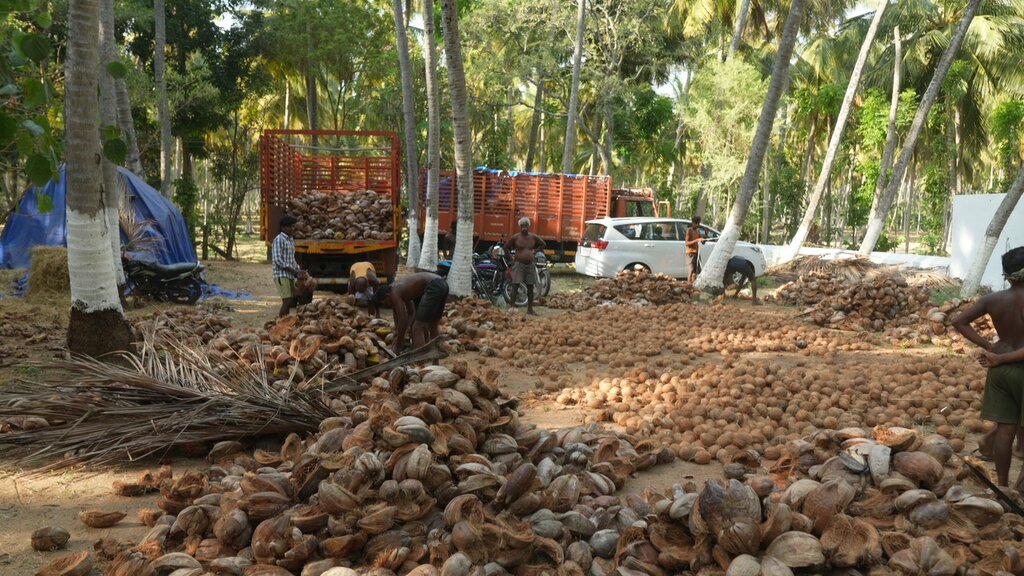
Coconut collected after it drops naturally.
Nutmeg and Pepper harvest happens in 3-4 years, gradually increasing yields.
Shrubs are harvested occasionally for self consumption and direct on farm sales.
Author:
Aditya Tated
Date:
29/10/2024
4.2 General information regarding the calculation of inputs and costs
Specify how costs and inputs were calculated:
- per Technology area
Indicate size and area unit:
5.66 hectares
If using a local area unit, indicate conversion factor to one hectare (e.g. 1 ha = 2.47 acres): 1 ha =:
1hectare = 2.47 acres
other/ national currency (specify):
INR
If relevant, indicate exchange rate from USD to local currency (e.g. 1 USD = 79.9 Brazilian Real): 1 USD =:
84.07
Indicate average wage cost of hired labour per day:
600 INR
4.3 Establishment activities
| Activity | Timing (season) | |
|---|---|---|
| 1. | Plot assessment and planning | Before onset of rains |
| 2. | Digging trenches for rainwater harvesting | Before the rainy season |
| 3. | Setting up drip irrigation system | Before planting; dry season |
| 4. | Planting initial tree species (timber, fruit, nitrogen-fixing) | Early rainy season |
| 5. | Planting startup crops (e.g., banana, papaya) | Early rainy season |
| 6. | Mulching trenches with plant biomass | After trench creation, ongoing |
| 7. | Adding bio-inputs to mulch beds | Throughout growing seasons |
| 8. | Pruning trees and returning biomass | Regular intervals during dry seasons |
| 9. | Planting additional companion species | After initial species establishment |
| 10. | Setting up pest repellent measures | As needed, ongoing |
4.4 Costs and inputs needed for establishment
| Specify input | Unit | Quantity | Costs per Unit | Total costs per input | % of costs borne by land users | |
|---|---|---|---|---|---|---|
| Labour | Trench Digging | machine-hours | 100.0 | 1000.0 | 100000.0 | 100.0 |
| Labour | Tree Planting | person-days | 75.0 | 600.0 | 45000.0 | 100.0 |
| Equipment | Farm Tools | lump sum | 1.0 | 20000.0 | 20000.0 | 100.0 |
| Equipment | Irrigation Setup | lump sum | 1.0 | 100000.0 | 100000.0 | 100.0 |
| Equipment | Pruning Machine | units | 1.0 | 25000.0 | 25000.0 | 100.0 |
| Plant material | Timber Saplings | units | 5500.0 | 3.0 | 16500.0 | 100.0 |
| Plant material | Nutmeg Saplings | units | 1000.0 | 20.0 | 20000.0 | 100.0 |
| Plant material | Pepper Saplings | units | 1000.0 | 40.0 | 40000.0 | 100.0 |
| Plant material | Fruit Trees | units | 500.0 | 100.0 | 50000.0 | 100.0 |
| Fertilizers and biocides | Organic Manure | load | 10.0 | 1500.0 | 15000.0 | 100.0 |
| Fertilizers and biocides | Organic Pest Repellants | lump sum | 1.0 | 20000.0 | 20000.0 | 100.0 |
| Construction material | Fencing Irrigation | lump sum | 1.0 | 200000.0 | 200000.0 | 100.0 |
| Construction material | Bio-Input Preparation Unit | lump sum | 1.0 | 200000.0 | 200000.0 | 100.0 |
| Construction material | Pipes and Valves | lump sum | 1.0 | 530000.0 | 530000.0 | 100.0 |
| Construction material | Tool Shed | lump sum | 1.0 | 50000.0 | 50000.0 | 100.0 |
| Construction material | Worker Shed | lump sum | 1.0 | 50000.0 | 50000.0 | 100.0 |
| Other | Farm Animals | units | 5.0 | 20000.0 | 100000.0 | 100.0 |
| Other | Fodder | annual | 1.0 | 25000.0 | 25000.0 | 100.0 |
| Total costs for establishment of the Technology | 1606500.0 | |||||
| Total costs for establishment of the Technology in USD | 19109.08 | |||||
Comments:
Land user bore all costs
4.5 Maintenance/ recurrent activities
| Activity | Timing/ frequency | |
|---|---|---|
| 1. | Pruning | Every 6 months |
| 2. | Irrigation system maintenance | Annually, before dry season |
| 3. | Mulching trenches | Twice a year, before onset of rains |
| 4. | Adding bio-inputs to mulch beds | Happens automatically with irrigation. |
| 5. | Harvesting fruits and biomass | As and when needed Coconut is collected after it falls by itself. |
| 6. | Replanting missing or damaged trees | Annually, before rainy season |
| 7. | Fencing and protection checks | Quarterly |
4.6 Costs and inputs needed for maintenance/ recurrent activities (per year)
| Specify input | Unit | Quantity | Costs per Unit | Total costs per input | % of costs borne by land users | |
|---|---|---|---|---|---|---|
| Labour | Pruning, mulching, replanting | person-days | 100.0 | 600.0 | 60000.0 | 100.0 |
| Labour | Harvesting | person-days | 300.0 | 600.0 | 180000.0 | 100.0 |
| Equipment | Tools for pruning fencing checks | lump sum | 1.0 | 10000.0 | 10000.0 | 100.0 |
| Equipment | Irrigation system maintenance | lump sum | 1.0 | 10000.0 | 10000.0 | 100.0 |
| Equipment | Fencing maintenance | lump sum | 1.0 | 20000.0 | 20000.0 | 100.0 |
| Plant material | Replacement seedlings | pieces | 50.0 | 30.0 | 1500.0 | 100.0 |
| Fertilizers and biocides | Preparing organic bio-inputs via irrigation system | lump sum | 1.0 | 5000.0 | 5000.0 | 100.0 |
| Construction material | Fencing materials for repair | lump sum | 1.0 | 8000.0 | 8000.0 | 100.0 |
| Other | Cow Care and Fodder | kg | 5.0 | 5000.0 | 25000.0 | 100.0 |
| Total costs for maintenance of the Technology | 319500.0 | |||||
| Total costs for maintenance of the Technology in USD | 3800.4 | |||||
Comments:
Land users bore all costs
4.7 Most important factors affecting the costs
Describe the most determinate factors affecting the costs:
No factors significantly affected costs.
5. Natural and human environment
5.1 Climate
Annual rainfall
- < 250 mm
- 251-500 mm
- 501-750 mm
- 751-1,000 mm
- 1,001-1,500 mm
- 1,501-2,000 mm
- 2,001-3,000 mm
- 3,001-4,000 mm
- > 4,000 mm
Specify average annual rainfall (if known), in mm:
865.00
Specifications/ comments on rainfall:
Rainfall Distribution and Seasonality: Monsoon Seasons: Rainfall peaks during the southwest monsoon (June to September) and the northeast monsoon (October to November). August, October, and November are the rainiest months, each with an average precipitation between 167 to 214 mm.
Dry Periods: The driest months are January to March, with very low rainfall, averaging between 5 to 35 mm per month.
Indicate the name of the reference meteorological station considered:
Coimbatore Metrological station, India Meteorological Department’s (IMD) network.
Agro-climatic zone
- humid
Generally warm, with an average annual temperature around 26–28°C (79–82°F). The hottest months tend to be March to May, where temperatures can reach up to 36–40°C (97–105°F), while the coolest months are December and January, with average daily temperatures ranging from 25–26°C (77–79°F)
5.2 Topography
Slopes on average:
- flat (0-2%)
- gentle (3-5%)
- moderate (6-10%)
- rolling (11-15%)
- hilly (16-30%)
- steep (31-60%)
- very steep (>60%)
Landforms:
- plateau/plains
- ridges
- mountain slopes
- hill slopes
- footslopes
- valley floors
Altitudinal zone:
- 0-100 m a.s.l.
- 101-500 m a.s.l.
- 501-1,000 m a.s.l.
- 1,001-1,500 m a.s.l.
- 1,501-2,000 m a.s.l.
- 2,001-2,500 m a.s.l.
- 2,501-3,000 m a.s.l.
- 3,001-4,000 m a.s.l.
- > 4,000 m a.s.l.
Indicate if the Technology is specifically applied in:
- not relevant
5.3 Soils
Soil depth on average:
- very shallow (0-20 cm)
- shallow (21-50 cm)
- moderately deep (51-80 cm)
- deep (81-120 cm)
- very deep (> 120 cm)
Soil texture (topsoil):
- fine/ heavy (clay)
Soil texture (> 20 cm below surface):
- fine/ heavy (clay)
Topsoil organic matter:
- low (<1%)
If available, attach full soil description or specify the available information, e.g. soil type, soil PH/ acidity, Cation Exchange Capacity, nitrogen, salinity etc.
Soil type - Red sandy soil
5.4 Water availability and quality
Ground water table:
5-50 m
Availability of surface water:
poor/ none
Water quality (untreated):
good drinking water
Water quality refers to:
ground water
Is water salinity a problem?
No
Is flooding of the area occurring?
No
Comments and further specifications on water quality and quantity:
Pollachi, the place where the farm is located, water quality fluctuates throughout the year, particularly due to agricultural runoff and effluents from nearby industrial activities.
5.5 Biodiversity
Species diversity:
- low
Habitat diversity:
- low
5.6 Characteristics of land users applying the Technology
Sedentary or nomadic:
- Sedentary
Market orientation of production system:
- mixed (subsistence/ commercial)
Off-farm income:
- > 50% of all income
Relative level of wealth:
- average
Individuals or groups:
- individual/ household
Level of mechanization:
- mechanized/ motorized
Gender:
- women
- men
Age of land users:
- middle-aged
5.7 Average area of land used by land users applying the Technology
- < 0.5 ha
- 0.5-1 ha
- 1-2 ha
- 2-5 ha
- 5-15 ha
- 15-50 ha
- 50-100 ha
- 100-500 ha
- 500-1,000 ha
- 1,000-10,000 ha
- > 10,000 ha
Is this considered small-, medium- or large-scale (referring to local context)?
- medium-scale
5.8 Land ownership, land use rights, and water use rights
Land ownership:
- individual, titled
Land use rights:
- individual
Water use rights:
- individual
Are land use rights based on a traditional legal system?
Yes
Specify:
Private Ownership
5.9 Access to services and infrastructure
health:
- poor
- moderate
- good
education:
- poor
- moderate
- good
technical assistance:
- poor
- moderate
- good
employment (e.g. off-farm):
- poor
- moderate
- good
markets:
- poor
- moderate
- good
energy:
- poor
- moderate
- good
roads and transport:
- poor
- moderate
- good
drinking water and sanitation:
- poor
- moderate
- good
financial services:
- poor
- moderate
- good
6. Impacts and concluding statements
6.1 On-site impacts the Technology has shown
Socio-economic impacts
Production
crop production
Quantity before SLM:
110
Quantity after SLM:
160
Comments/ specify:
Coconuts were small in size and fewer in number when the farm was bought. After 6-7 years, the counts increased from 110 per tree per year to 160 and size increased 150% on average.
crop quality
Quantity before SLM:
Not so tasty
Quantity after SLM:
Taste is the best compared to surrounding many farms.
risk of production failure
Quantity before SLM:
50-60%
Quantity after SLM:
0%
Comments/ specify:
The risk of production failure has come down to 0% as there is no pest and disease attack. The coconuts yield continuously throughout the year.
product diversity
Quantity before SLM:
1
Quantity after SLM:
3
Comments/ specify:
From just one crop to 2 main crops, pepper as a sub-main crop and a variety of fruits for self consumption.
production area
Quantity before SLM:
40%
Quantity after SLM:
60%
Comments/ specify:
Coconuts occupied approximately 40% area in terms of canopy. Now in addition to that there is nutmeg which occupies another 20%. Rest of the area is for timber and other supporting crops not included here.
land management
Quantity before SLM:
24/7
Quantity after SLM:
1 Day a Week
Comments/ specify:
Farmer before this owner spent hours in weeding, application of inputs and pesticide, burning of crop residue, harvesting coconuts. Now the whole farm needs 2 labour to collect fallen coconuts and turn on the irrigation switches and valves. The farmer comes to visit the farm once a week for monitoring.
Water availability and quality
drinking water quality
irrigation water availability
Comments/ specify:
Earlier the bore wells would run only for a couple of hours and then the water would dry out. Now it fulfills the irrigation requirement without interruption.
demand for irrigation water
Comments/ specify:
Demand for water has drastically come down as the SOC content in the soil has risen.
Income and costs
expenses on agricultural inputs
Comments/ specify:
There is no expense in any agricultural input apart from maintenance of 2-3 cows. The entire system is automatic. The slurry from the cowshed goes into the tank which supplies input through a venturi to the drip irrigaton system.
farm income
Comments/ specify:
Farm income has gone up significantly owing to the high yields, multiple crops, better prices, low cultivation and management costs.
diversity of income sources
Comments/ specify:
Incomes are coming from sale of coconuts, nutmeg and pepper. Coconut oil is also extracted now by the farmer and sold at a high premium price.
workload
Comments/ specify:
The drudgery of mainting a monocrop and all the works associalted with conventional agriculture is eliminated by 95%. The only workload is to pick up the fallen coconuts and harvest nutmeg and pepper.
Socio-cultural impacts
health situation
Comments/ specify:
The health of the owner and the consumers is greatly benefitted owing to the absense of harmful chemicals and pesticides in the produce.
SLM/ land degradation knowledge
Comments/ specify:
This model is a great source of wisdom about tree-based regenerative agriculture which can counter land degradation. It has all the necessary components of how to convert dirt into soil.
Ecological impacts
Water cycle/ runoff
water quality
harvesting/ collection of water
surface runoff
excess water drainage
groundwater table/ aquifer
evaporation
Soil
soil moisture
Comments/ specify:
Soil moisture is maintained as high levels except for summers when its a little low due to the intense heat this region faces.
soil cover
soil compaction
Comments/ specify:
Soil compaction has reduced because of the heavy penetraton of tree roots, improved SOC and biological activity in the soil.
nutrient cycling/ recharge
Comments/ specify:
It is evident from the yields that there is a very resilient process of nutrient cycling happening in the farm compared to what was happening earlier.
soil organic matter/ below ground C
Quantity before SLM:
0.05
Quantity after SLM:
3.36
Comments/ specify:
The SOC level have increased continously and is still increasing because of the leaf litter that is added continuously throughout the year.
Biodiversity: vegetation, animals
Vegetation cover
Quantity before SLM:
40%
Quantity after SLM:
90%
Comments/ specify:
Vegetation cover in the form of trees, shrubs, perennial crops and pepper has shown dramatic increase.
biomass/ above ground C
Comments/ specify:
Addition of 3 times the number of trees has increased the above ground biomass multiple times.
plant diversity
Comments/ specify:
The farm is now a home for more than 100 species of plants compared to just one when it was bought.
invasive alien species
Comments/ specify:
There is an absolute balance in the farm ecosystem with no species going out of control. There are no significant weeds as the soil ecosystem and shade doesn't support the common invasive species found in the region.
animal diversity
Comments/ specify:
Minor farm animals are seen. Since its not a large area, enough diversity has not been established.
beneficial species
Comments/ specify:
There are no harmful species for which the farmer needs to worry about. All species are beneficaial in some way or the other.
habitat diversity
Comments/ specify:
Multi layer multi crop system allows various different habitat for a variety of species. Here from high coconut to rich soil undergrond has a habitat diversity of semi-forest which was not present earlier.
pest/ disease control
Comments/ specify:
The farmer says he doesn't know what are pests now which was not the case earlier. Earlier his coconuts would be continously be harmed by something or the other.
Climate and disaster risk reduction
drought impacts
Comments/ specify:
The impact of drought is not significant in this farm because of the green cover, soil moisture, high water tables, year-round water availability and overall resiliance of the system. All other conventional farms face enormous hardship during droughts.
impacts of cyclones, rain storms
Comments/ specify:
Impact of rain storms is also less as there is enough wind barriers because of the dense vegetation. The coconots have penetrated their roots towards the trenches and underground in search of nutrients making them strongly grounded and able to withstand storms easily.
emission of carbon and greenhouse gases
Comments/ specify:
This system is carbon negative as there is no use of chemicals or fossil fuels needed to run any operation except the transportation of coconuts to the markets.
wind velocity
Comments/ specify:
Wind velocity is hindered now due to the dense vegetation.
micro-climate
Comments/ specify:
The micro-climate is the most tangible change that anyone visiting the farm is able to relish. The coolness inside the farm is completely mood-changing for someone who is entering from outside. It leaves people wanting to live here or create such a place for themselves. Its an oasis in a desert.
Specify assessment of on-site impacts (measurements):
Soil Fertility: Initially, the soil was likely low in organic matter due to monoculture practices. Through the addition of nitrogen-fixing plants and mulching with biomass, the soil's nutrient levels improved naturally, eliminating the need for chemical fertilizers.
Soil Organic Carbon: Soil organic carbon increased notably from 0.5% to 3.36% due to continuous mulching, the addition of bio-inputs, and water-retaining trenches. These practices enriched the soil with organic matter, improving its structure and capacity to hold moisture.
Erosion Control and Water Retention: Trenches and rainwater harvesting reduced runoff, preventing soil erosion and enhancing water retention, which helped maintain stable soil moisture levels, even in dry periods.
Microbial Health: The use of bio-inputs via drip irrigation boosted microbial activity in the soil, accelerating the decomposition of organic matter into humus, which further improved soil fertility and structure.
6.2 Off-site impacts the Technology has shown
water availability
Comments/ specify:
It is assumed that as the groundwater table in the site has increased, it would definitely have some effect of the neighboring sites.
Specify assessment of off-site impacts (measurements):
We have not conducted measurement of off-site ecological impacts for this farm as of now.
6.3 Exposure and sensitivity of the Technology to gradual climate change and climate-related extremes/ disasters (as perceived by land users)
Gradual climate change
Gradual climate change
| Season | increase or decrease | How does the Technology cope with it? | |
|---|---|---|---|
| annual temperature | increase | very well | |
| seasonal temperature | dry season | increase | well |
| annual rainfall | very well | ||
| seasonal rainfall | wet/ rainy season | increase | very well |
Climate-related extremes (disasters)
Meteorological disasters
| How does the Technology cope with it? | |
|---|---|
| local rainstorm | very well |
Climatological disasters
| How does the Technology cope with it? | |
|---|---|
| heatwave | well |
| drought | well |
Biological disasters
| How does the Technology cope with it? | |
|---|---|
| insect/ worm infestation | very well |
6.4 Cost-benefit analysis
How do the benefits compare with the establishment costs (from land users’ perspective)?
Short-term returns:
slightly negative
Long-term returns:
very positive
How do the benefits compare with the maintenance/ recurrent costs (from land users' perspective)?
Short-term returns:
neutral/ balanced
Long-term returns:
very positive
6.5 Adoption of the Technology
- 1-10%
Of all those who have adopted the Technology, how many did so spontaneously, i.e. without receiving any material incentives/ payments?
- 0-10%
6.6 Adaptation
Has the Technology been modified recently to adapt to changing conditions?
No
6.7 Strengths/ advantages/ opportunities of the Technology
| Strengths/ advantages/ opportunities in the land user’s view |
|---|
| 1) Efficient Rainwater Harvesting: Trenches prevent water runoff and retain moisture, helping farmers adapt to water-scarce conditions. Drip irrigation ensures efficient water use, reducing waste and improving moisture availability at plant roots. |
| 2) Nitrogen-fixing plants and bio-inputs build natural soil fertility, reducing or eliminating the need for chemical fertilizers. |
| 3) Income Stability: Diverse crops (timber, fruit, and cash crops like bananas and papayas) ensure year-round income and minimize dependency on a single crop. |
| 4) Pest and Disease Management: The natural ecosystem with pollinators and predatory insects reduces pest issues without needing chemical pesticides. |
| 5) Minimal Labor: Once established, the system requires less labor with minimal tilling or weeding, allowing farmers to save on labor costs. |
| 6) Increased Yield and Quality: Coconut yield has improved significantly, with larger and better-tasting coconuts, enhancing the crop’s market value. |
| 7) Ecological Balance: The increase in biodiversity supports natural pest control, improved pollination, and enriched soil. |
| Strengths/ advantages/ opportunities in the compiler’s or other key resource person’s view |
|---|
|
1)Positive Environmental Impact: Enhanced Soil and Water Conservation: Rainwater harvesting and mulching contribute to soil health and sustainable water use, supporting resilient agricultural practices. Carbon Sequestration: The introduction of timber and fruit trees aids in carbon capture, helping to mitigate climate change. |
|
2)Increased Biodiversity and Natural Pest Management: Reduction in Chemical Usage: Biodiverse ecosystems reduce reliance on pesticides and chemical fertilizers, fostering healthier food systems. Positive Environmental Metrics: Biodiversity and natural pest control align with ecological sustainability, improving farm ecosystems. |
|
3)Model for Replication and Scaling: Technology Viability: A successful pilot farm serves as a model that other farmers can adopt, promoting tree-based agriculture and natural farming methods. Long-Term Sustainable Farming: This low-maintenance, high-diversity model provides a sustainable alternative to conventional farming, attracting interest from stakeholders focused on sustainable agriculture. |
|
4)Attracting Donor Support: Appeal to Donors: The project’s long-term sustainability and eco-friendly practices attract donors focused on climate resilience and food security. Potential for Diverse Funding: The combined focus on environmental sustainability, economic empowerment, and climate resilience appeals to various funding sources. |
6.8 Weaknesses/ disadvantages/ risks of the Technology and ways of overcoming them
| Weaknesses/ disadvantages/ risks in the land user’s view | How can they be overcome? |
|---|---|
| 1) Learning Curve: Farmers may need additional knowledge on tree-based agriculture and organic soil management, which could necessitate training and support. | 1) Training programs across the project region are conducted on various aspects of regenerative agriculture at minimal costs |
| 2) Consistency in Bio-input Application: The effectiveness of bio-inputs depends on regular application; skipping or improper application could hinder soil improvement. | 2) Farmer hand holding is available via farmer helpline for basic queries and farm visits are conducted if nature of query requires. |
| 3) Higher Pest Pressure in Early Stages: As biodiversity builds up gradually, farmers might initially encounter some pest pressure until a stable ecosystem is established. | 3) Pest and disease management trainings are quite frequent and also the training video is available on Save Soil youtube channel in regional languages for easy access for farmers |
| Weaknesses/ disadvantages/ risks in the compiler’s or other key resource person’s view | How can they be overcome? |
|---|---|
| 1) Need for Technical Expertise and Training: Farmers may need intensive training in regenerative agriculture methods, necessitating resources for workshops, materials, and ongoing support staff, which may impact the organization’s budget and staffing. | 1) Major portion of funding goes into trainings and to create online and offline materials easily accessible to farmers. In mega training program where more than 1000s of farmers attend, free technical handbook is also provided to support them on a daily basis |
| 2) Difficulty in Immediate Impact Measurement: Due to the delayed returns, reporting immediate success and impact might be challenging, especially in a results-oriented funding environment. | 2) Need to implement milestone-based metrics, proxy indicators, and comparative reporting to showcase early progress. Farmer testimonials and case studies further illustrate positive outcomes, while data visualizations offer accessible insights into ecological improvements and economic stability. |
| 3) Risk of Low Farmer Adoption: Farmers may be hesitant about the model’s initial costs and labor, slowing adoption. | 3) Selective aspects of the technology can be taken up initially to see early success in order to manage finances |
| 4) Resource-Intensive Monitoring and Data Collection: Tracking soil health, biodiversity, and yields requires dedicated monitoring, which can be resource-intensive, especially across multiple farms. | 4) Success of few model farms will convince farmer community to take up this technology without having the need to monitor each and every farm |
7. References and links
7.1 Methods/ sources of information
- field visits, field surveys
3-5 expert volunteers visited the farm for this survey.
- interviews with land users
1 person talked to the land user.
- interviews with SLM specialists/ experts
2 specialists were interviewed.
- compilation from reports and other existing documentation
4 people were involved in documentation and reporting.
When were the data compiled (in the field)?
25/10/2024
7.2 References to available publications
Title, author, year, ISBN:
Cauvery Calling: Impact Assessment Report 2024: A global economic model for farmers with a significant ecological impact
Available from where? Costs?
https://drive.google.com/drive/u/1/search?q=UNCCD%20policy
Title, author, year, ISBN:
SS-TKV Annual Report 2023-24
Available from where? Costs?
https://docs.google.com/document/d/1vvMD0kd-qWs4JtebbsBpOGBB-z_6CVr3ZcrK-1wV78Y/edit?tab=t.0
7.3 Links to relevant online information
Title/ description:
Save Soil Movement - Model Farm, Proof of Concept
URL:
https://consciousplanet.org/en/save-soil/blog/save-soil-movement-model-farm-proof-of-concept
Title/ description:
A living example of Save Soil
URL:
https://www.youtube.com/watch?v=QVis4gkcPIU&t=353s
7.4 General comments
The farm is still undergoing transformation into a more efficient and profitable model with the technology implemented.
Links and modules
Expand all Collapse allLinks

Conscious Planet - Save Soil’s Farmer Training and … [India]
The approach focuses on supporting farmers to increase productivity by increasing soil biology and organic matter content, primarily through plant residue and animal waste. Awareness and advocacy are followed by training programs and support for adopting regenerative agricultural practices.
- Compiler: Praveena Sridhar
Modules
No modules


