Controlled Grazing [Georgia]
- Creation:
- Update:
- Compiler: Nicholas Euan Sharpe
- Editor: –
- Reviewers: William Critchley, Rima Mekdaschi Studer
კონტროლირებადი ძოვება
technologies_7567 - Georgia
View sections
Expand all Collapse all1. General information
1.2 Contact details of resource persons and institutions involved in the assessment and documentation of the Technology
Name of project which facilitated the documentation/ evaluation of the Technology (if relevant)
Achieving Land Degradation Neutrality Targets of Georgia through Restoration and Sustainable Management of Degraded Pasturelands (GCP/GEO/006/GFF)Name of the institution(s) which facilitated the documentation/ evaluation of the Technology (if relevant)
Regional Environmental Centre for the Caucasus (REC Caucasus) - Georgia1.3 Conditions regarding the use of data documented through WOCAT
The compiler and key resource person(s) accept the conditions regarding the use of data documented through WOCAT:
Yes
1.4 Declaration on sustainability of the described Technology
Is the Technology described here problematic with regard to land degradation, so that it cannot be declared a sustainable land management technology?
No
1.5 Reference to Questionnaire(s) on SLM Approaches (documented using WOCAT)
Participatory Grassland and Rangeland Assessment (PRAGA) [Georgia]
The Participatory Rangelands and Grasslands Assessment Methodology (PRAGA) is a rapid, cost-effective framework for the integrated assessment of rangeland ecosystems, incorporating diverse data sources and participatory approaches. PRAGA facilitates stakeholder engagement through consultations and workshops, underpinned by community-based mapping of grazing areas, land use dynamics, and trend analyses.
- Compiler: Nicholas Euan Sharpe
Municipal Pastureland Planning [Georgia]
The Municipal Pastureland Planning approach was developed collaboratively with key national and local stakeholders to establish a structured, evidence-based decision support framework for sustainable rangeland governance. This system consolidates and presents data from diverse stakeholder groups in a format fully compatible with the Land Degradation Neutrality Framework, ensuring that planning …
- Compiler: Nicholas Euan Sharpe
2. Description of the SLM Technology
2.1 Short description of the Technology
Definition of the Technology:
“Controlled Grazing” seeks to harness the behaviours and habits of ruminant livestock to enhance three key ecological functions, namely the removal of plant biomass (grazing), soil and vegetation disturbance (animal impact) and increased nutrient cycling (dung and urine), with the goal of increasing perennial grass establishment, pasture palatability and reducing bare ground and erosion.
2.2 Detailed description of the Technology
Description:
“Controlled Grazing” (CG) was developed and then implemented in three municipalities on a total of 564 ha of pastureland. With support from local land users, pasture areas within the three pilot sites were divided into paddocks of roughly 1 to 10 ha in size; an overall stocking rate of 1.9 ha per standard animal unit (SAU) and a maximum capacity of 400 SAU were used for infrastructure design. To optimise control of grazing rest/recovery times and intensities, complementary project interventions included fencing, water point development, agroforestry, installation of shade structures and use of hay and salt/mineral licks, as well as capacity building among herders. Electric fences were chosen over other fencing options or herding due to cost and ease of maintenance; the system was based on constructing permanent end-post and gate structures and then installing 2 to 3 strands of electrified wire at the beginning of the grazing season, and removing and storing equipment at the end of the grazing season. Water storage installations were designed to provide reliable sources of water in sufficient quantities to meet peak stocking capacity (400 SAU); design of the water trough and delivery systems sought mobility within the paddock space to reduce trampling and soil compaction around water points. Shade structures complemented the agroforestry additions, provided shading options to livestock while the trees were young. "Attractants" (hay, salt licks etc.) also proved highly efficient at concentrating animal impact on specific sites, especially areas of salt scald and bare ground.
Grazing planning used recovery times based on actual seasonal growth rates. The first grazing plans were developed with support from project experts, but management was transferred early in the process to local herders. The project conducted field-based monitoring of pasture health and soil conditions from 2019 to 2025, structured through the PRAGA field data survey sheets (see the PRAGA approach in the WOCAT database). These findings were analysed through a project-developed analysis worksheet with land users to determine how management practices were impacting the pasture and soil surface.
The project "Achieving Land Degradation Neutrality Targets of Georgia through Restoration and Sustainable Management of Degraded Pasturelands" (GCP/GEO/006/GFF) was responsible for the initial investment of USD 120,800, or approximately USD 215 per ha, to develop the livestock infrastructure. Local land users are expected to cover the estimated annual maintenance costs of USD 900. The pilot pastures have traditionally been used by livestock owners for dairy cows and smallstock; these pastures were transferred to municipalities for a lease period of 15 years through project support.
CG shares conceptual links with other regenerative grazing models (see references at the end of the document) and reframes ruminant herbivores as ecological tools facilitating grassland function and biodiversity. In this particular case, local reactions were overwhelmingly positive, resulting in new professionals entering the livestock sector and tangible improvements in forage quality, pasture productivity and livestock performance. A better understanding of pasture management and planning has reduced conflict and adoption has allowed communities as a whole to reflect on land management, herd genetics, economic viability and the role of livestock in the landscape. CG has also played a pivotal role in securing formal recognition and rights for land users, and leverages a resource and technology that are already widely available in Georgia’s rural communities. Controlled Grazing offers a grounded, regenerative technology that can revitalise grassland productivity and ecological function.
2.3 Photos of the Technology
Media Gallery
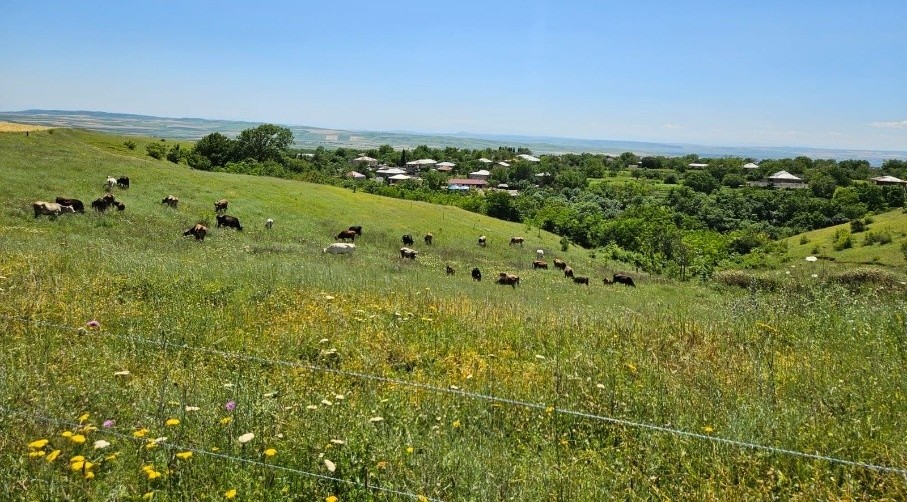
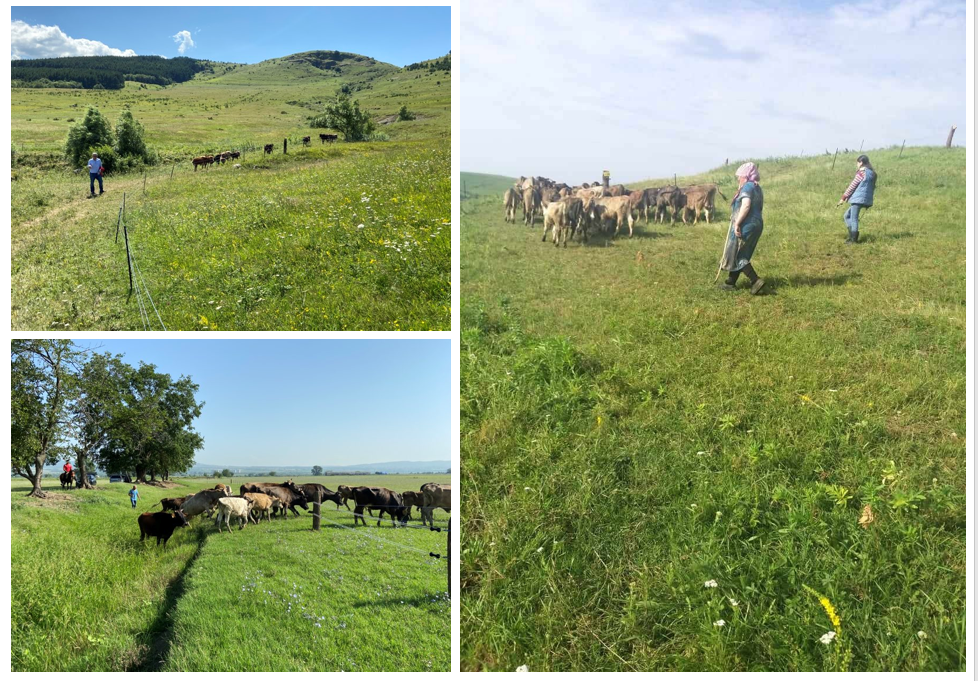
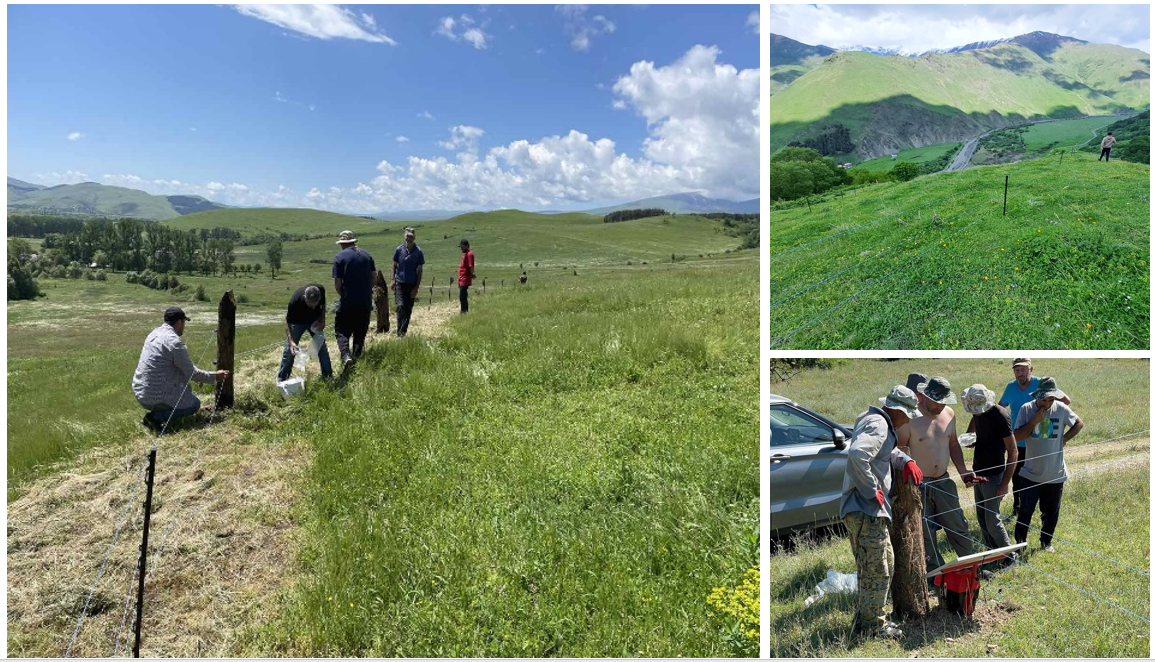
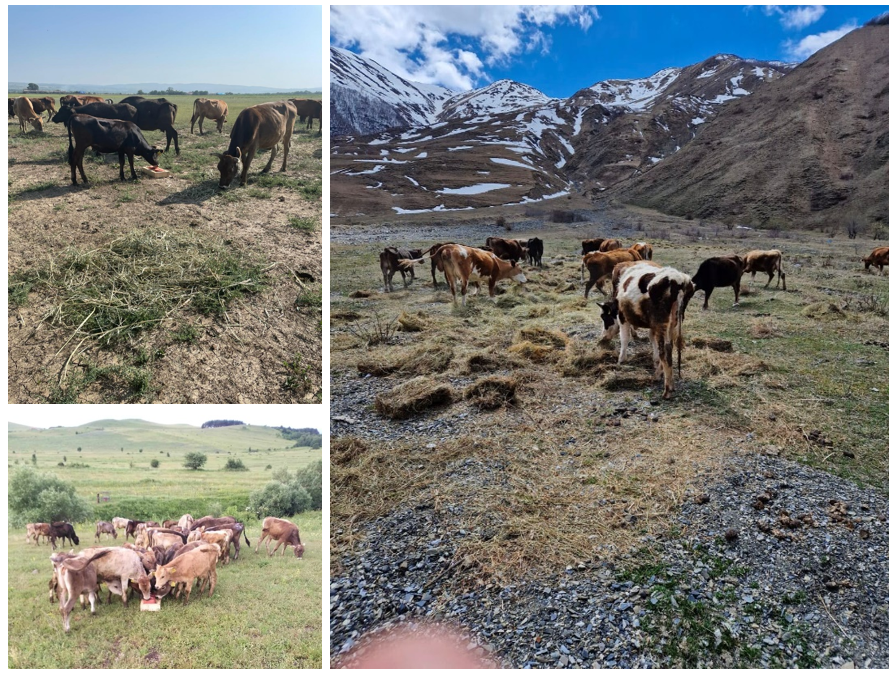
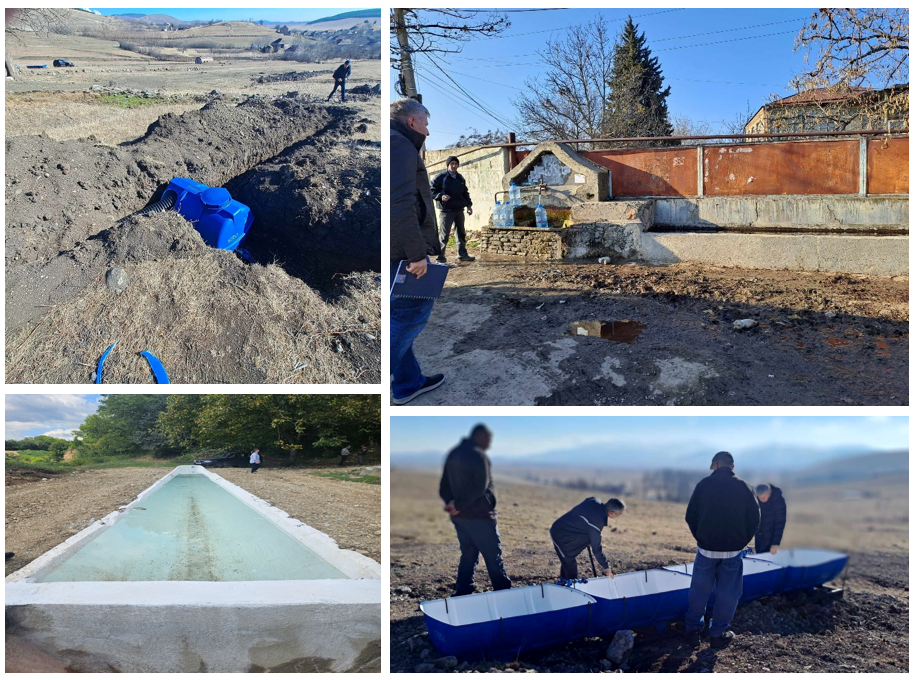
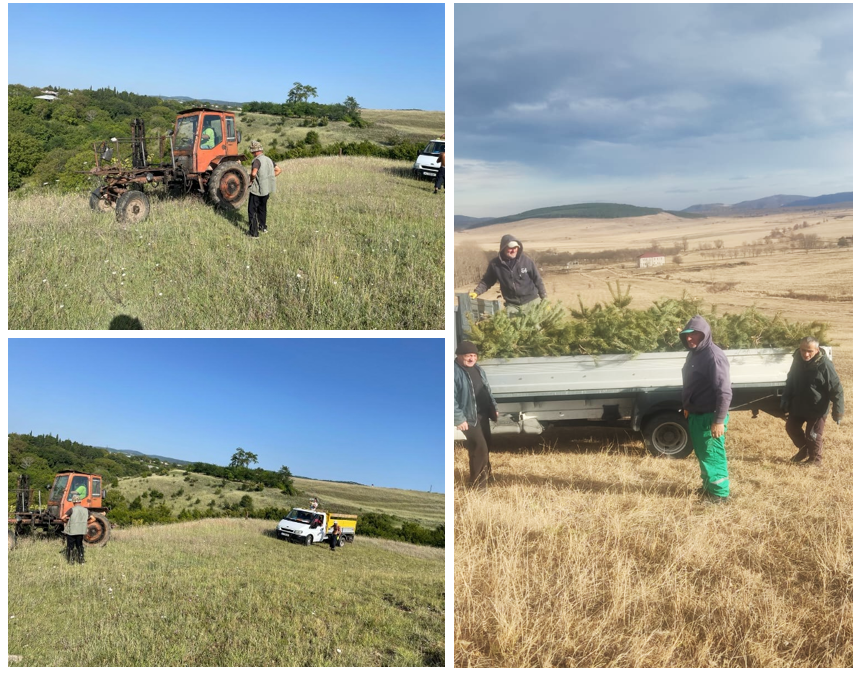
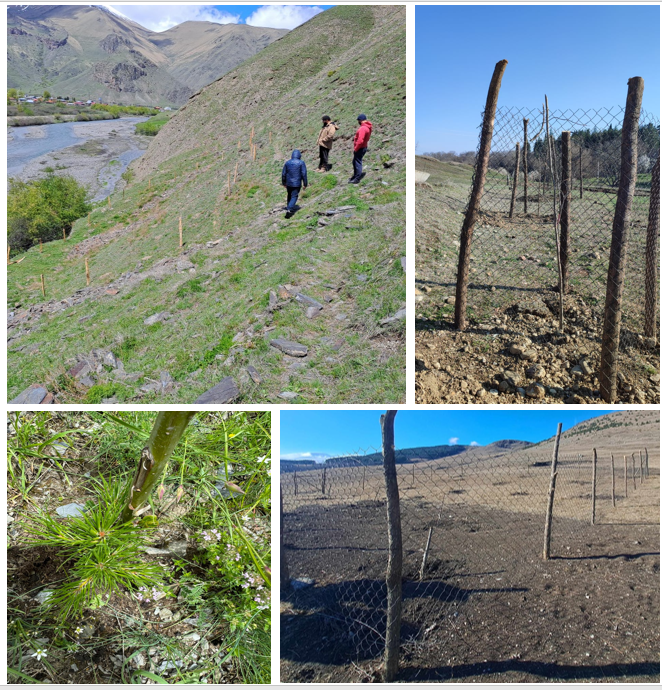
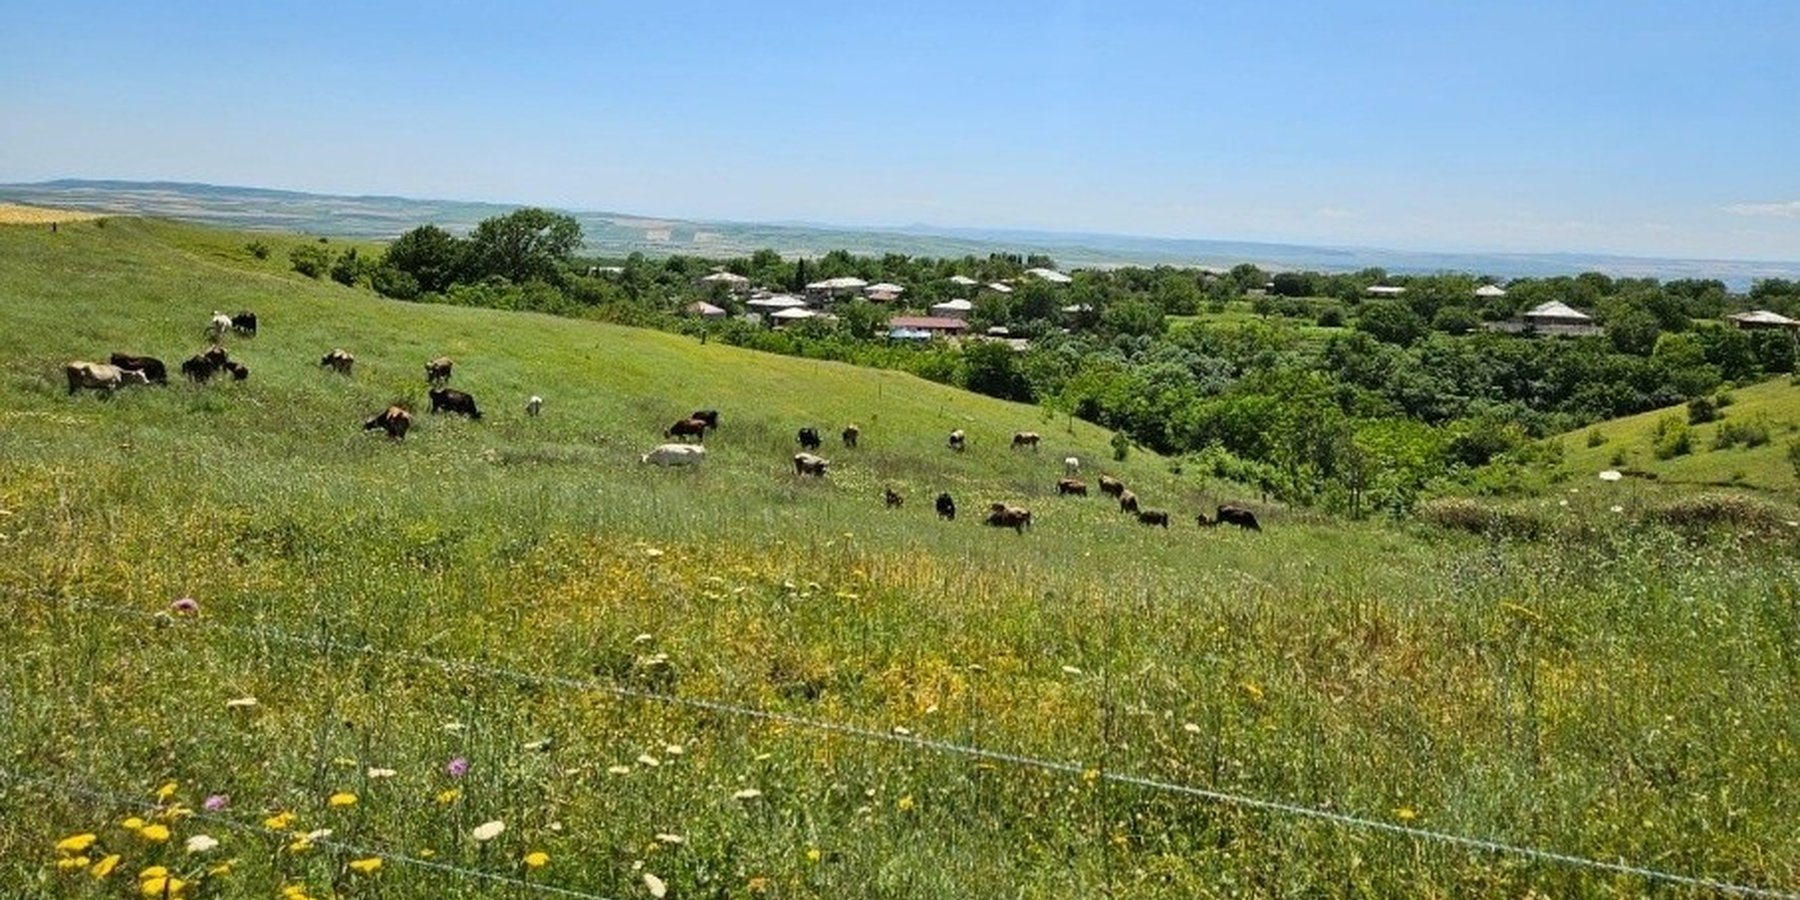
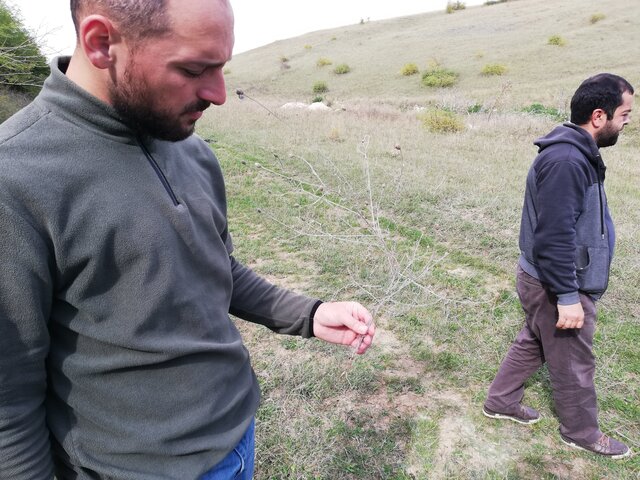
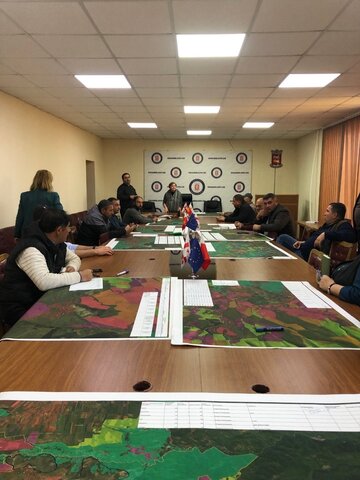
General remarks regarding photos:
The photos provided give an overview of the different environmental context where the technology was deployed, in addition to the infrastructure investments and supporting activities that allowed for grazing animals, times and intensities to be managed.
2.5 Country/ region/ locations where the Technology has been applied and which are covered by this assessment
Country:
Georgia
Region/ State/ Province:
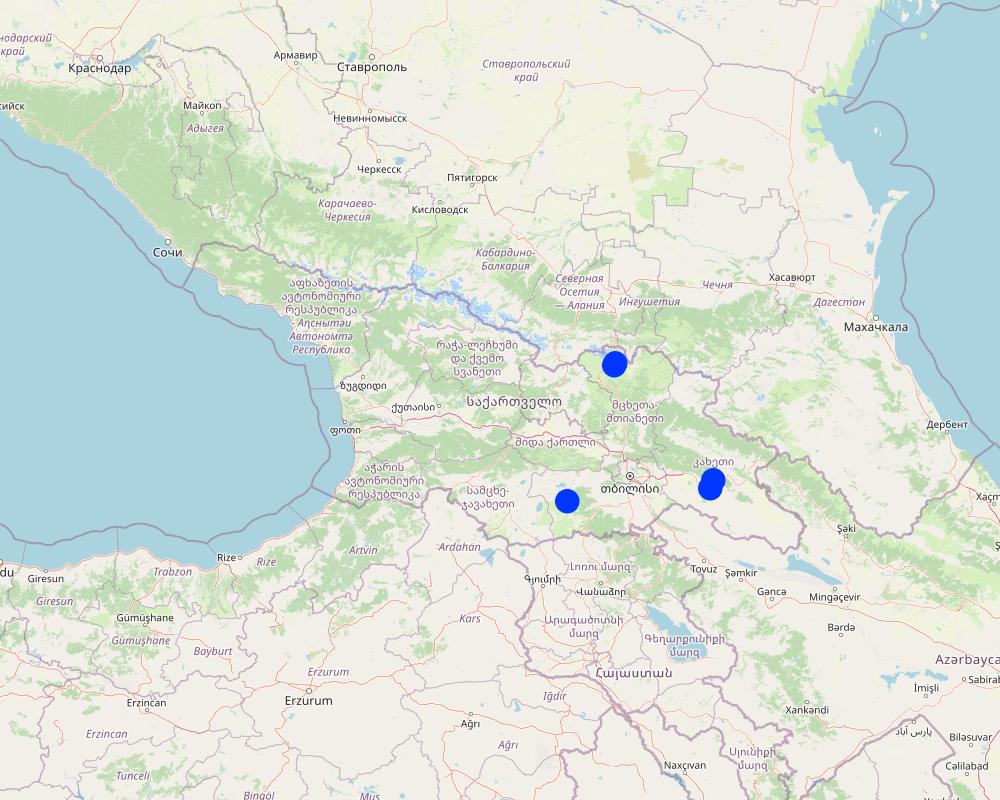
Dmanisi, Gurjaani and Kazbegi Municipalities
Further specification of location:
Villages of Ganakleba & Naniani, Sno
Specify the spread of the Technology:
- evenly spread over an area
If precise area is not known, indicate approximate area covered:
- 1-10 km2
Is/are the technology site(s) located in a permanently protected area?
No
Comments:
The project collaborated with three village-level stakeholder groups to develop and pilot Controlled Grazing. Investments in grazing infrastructure, training, equipment, and management support systems were integral to the successful implementation of the approach.
Map
×2.6 Date of implementation
Indicate year of implementation:
2024
If precise year is not known, indicate approximate date:
- less than 10 years ago (recently)
2.7 Introduction of the Technology
Specify how the Technology was introduced:
- through projects/ external interventions
Comments (type of project, etc.):
The introduction of the technology was financed and supervised by the GCF/GEO/006/GFF project through the implementing partner Regional Environmental Centre for the Caucasus (REC Caucasus).
3. Classification of the SLM Technology
3.1 Main purpose(s) of the Technology
- improve production
- reduce, prevent, restore land degradation
- preserve/ improve biodiversity
- create beneficial economic impact
- create beneficial social impact
3.2 Current land use type(s) where the Technology is applied
Land use mixed within the same land unit:
Yes
Specify mixed land use (crops/ grazing/ trees):
- Silvo-pastoralism

Grazing land
Intensive grazing/ fodder production:
- Improved pastures
Animal type:
- cattle - dairy
- cattle - non-dairy beef
- sheep
Is integrated crop-livestock management practiced?
No
Products and services:
- meat
- milk
- whool
Species:
cattle - dairy
Count:
400
Comments:
Forests are occasionally used by the livestock as shelter from the elements and as a place for calving/ lambing; tree planting will provide shade and erosion control.
3.3 Has land use changed due to the implementation of the Technology?
Has land use changed due to the implementation of the Technology?
- No (Continue with question 3.4)
3.4 Water supply
Water supply for the land on which the Technology is applied:
- rainfed
3.5 SLM group to which the Technology belongs
- agroforestry
- pastoralism and grazing land management
- improved ground/ vegetation cover
3.6 SLM measures comprising the Technology

vegetative measures
- V1: Tree and shrub cover
- V2: Grasses and perennial herbaceous plants
- V4: Replacement or removal of alien/ invasive species
- V5: Others

structural measures
- S6: Walls, barriers, palisades, fences
- S7: Water harvesting/ supply/ irrigation equipment
- S9: Shelters for plants and animals

management measures
- M2: Change of management/ intensity level
- M3: Layout according to natural and human environment
- M4: Major change in timing of activities

other measures
Specify:
Placement of attractants to focus grazing pressures and camping of livestock, including hay feeding which acted additionally to cover bare ground areas and salt scalds.
3.7 Main types of land degradation addressed by the Technology

soil erosion by water
- Wt: loss of topsoil/ surface erosion
- Wg: gully erosion/ gullying
- Wm: mass movements/ landslides

chemical soil deterioration
- Cs: salinization/ alkalinization

physical soil deterioration
- Pc: compaction
- Pk: slaking and crusting
- Pu: loss of bio-productive function due to other activities

biological degradation
- Bc: reduction of vegetation cover
- Bh: loss of habitats
- Bq: quantity/ biomass decline
- Bs: quality and species composition/ diversity decline
3.8 Prevention, reduction, or restoration of land degradation
Specify the goal of the Technology with regard to land degradation:
- prevent land degradation
- reduce land degradation
Comments:
According to the Land Degradation Neutrality (LDN) Conceptual Framework, the highest priority is to maintain and enhance existing productive land use systems, as these are essential for ensuring both ecological integrity and food security. The second priority is to reduce ongoing land degradation, while the third focuses on restoring severely degraded lands. In alignment with this framework, the project aimed to improve pasture quality to support rural livelihoods and prevent further degradation of Georgia’s communally managed grasslands. This was achieved through multi-layered planning approaches designed to operationalize the LDN Framework at both local and municipal levels. For more details, please see the Municipal Pasture Planning and the PRAGA Approach links at the end of this document.
4. Technical specifications, implementation activities, inputs, and costs
4.1 Technical drawing of the Technology
Technical specifications (related to technical drawing):
Grazing charts serve as visual tools to represent the planned movement of livestock through specific areas of land (paddocks) over time. These charts offer a detailed and integrated planning framework that consolidates a wide range of variables into a single, easy-to-understand visual format. These include the timing and intensity of grazing, the size and condition of paddock areas, required plant recovery periods under varying growth conditions, wildlife and biodiversity considerations, seasonal constraints such as forage availability, and risks such as fire, drought or frost. Other land use factors can also be incorporated into the charting process.
For this project, the Holistic Planned Grazing Control Chart developed by the Savory Institute (www.savory.global) was translated and applied with their permission. The chart became a central tool for engaging land users in discussions around herd composition and size, recovery periods, and other fundamental grazing management principles. It helped facilitate more informed decision-making and supported the introduction of regenerative grazing practices aligned with both ecological and livelihood priorities.
Author:
The Savory Institute (translated by the Regional Environmental Centre for the Caucasus (REC Caucasus)
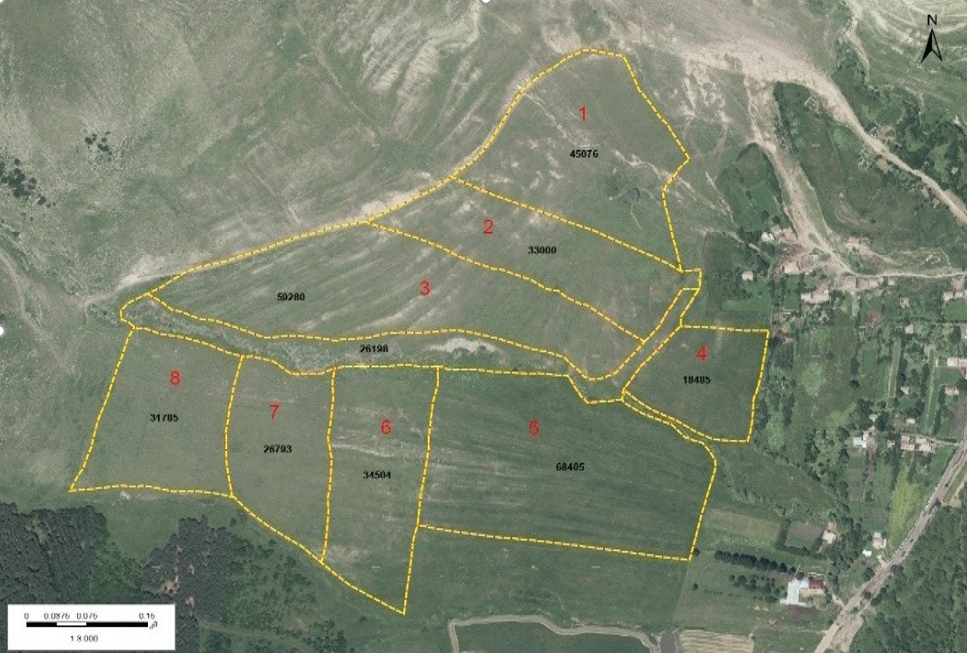
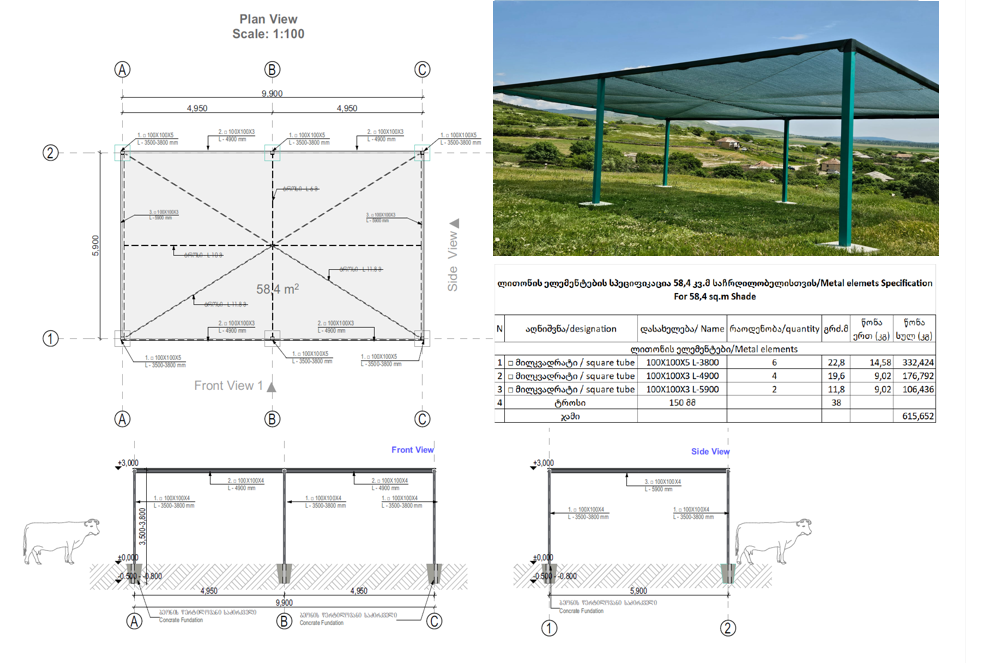
Technical specifications (related to technical drawing):
This image showcasing Ganakhleba, Dmanisi provides just one example of how the paddock divisions were established on project pilot sites to manage grazing. These divisions were created using electric fencing and fixed and mobile watering troughs. Agroforestry plantings were introduced within the pilot site for shade and erosion control. Weed and pest control included removal of pine seedlings and ant mounds. Grazing rotations were incorporated into other management calendars allowing for increased efficiency in forage conversion and utilisation of crop residues and other grazing opportunities.
Author:
Regional Environmental Centre for the Caucasus (REC Caucasus)
Date:
01/03/2023
4.2 General information regarding the calculation of inputs and costs
Specify how costs and inputs were calculated:
- per Technology area
Indicate size and area unit:
3 sites totalling 564 ha
Specify currency used for cost calculations:
- USD
Indicate average wage cost of hired labour per day:
25 USD per day
4.3 Establishment activities
| Activity | Timing (season) | |
|---|---|---|
| 1. | Gather support among land users (especially complex for communal lands) | N/A |
| 2. | Gain the necessary support from decision makers and relevant stakeholder groups | N/A |
| 3. | Obtain the required permissions and rights of use for grazing | N/A |
| 4. | Calculate peak water and forage needs for herds | N/A |
| 5. | Obtain funding and/or monetary contribution system to finance infrastructure investments | N/A |
| 6. | Develop source and water distribution system | When soil is workable (not too dry or too wet) |
| 7. | Install fencing systems and/or establish herding protocols | Weather permitting |
| 8. | Work with land users and stakeholders to define objectives using for grazing as a tool and describe the land as it should be in the future | N/A |
| 9. | Work with experts to develop initial grazing calendar (ensure adequate recovery periods following grazing) | Before growing season |
| 10. | Introduce herds | At onset of growing season, or when required if grazing land is scarce |
| 11. | Utlilise grazing feedback and monitoring protocols to adjust animal numbers and grazing times | Over course of growing season |
| 12. | At onset of non-growing season, calculate standing forage and animal numbers and adjust to ensure quality forage is available until the next growing season | At onset of non-growing season or times of very slow growth |
| 13. | Use information at onset of non-growing season to develop non-growing season grazing plan, including options for prolonged drought periods | At onset of non-growing season |
| 14. | Once grass or forage growth resumes, use last season's grazing plan to plan grazing for current growing season | At onset of growing season |
Comments:
Rarely do all land users or communities commit at early stages to implement a grazing system that requires planning and coordination among livestock owners. Therefore, specific areas were set aside for the pilot demonstrations. It must be kept in mind that small pilot plot areas rarely involve the degree of planning, coordination and infrastructure development that will be needed to apply these systems at scale. When livestock are used as regenerative tools, observation and monitoring is needed to ensure that plants are given adequate recovery times following grazing (this concept is less important during the non-growing season as grass is dormant); everything else described above is developed to support this basic process of grazing-recovery-monitoring-planning.
4.4 Costs and inputs needed for establishment
| Specify input | Unit | Quantity | Costs per Unit | Total costs per input | % of costs borne by land users | |
|---|---|---|---|---|---|---|
| Labour | Preparation of Detailed (Technical) Design, BoQ for Pastures Watering System Arrangements | days of labour | 63.0 | 150.0 | 9450.0 | |
| Labour | Fencing installation (grazing divisions) | days of labour | 150.0 | 30.0 | 4500.0 | 10.0 |
| Labour | Training land users electric fencing installation, maintenance | days of labour | 10.0 | 70.0 | 700.0 | |
| Labour | Agroforestry ground preparation, fencing and planting | days of labour | 80.0 | 25.0 | 2000.0 | |
| Labour | Installation of water storage and distribution systems | days of labour | 90.0 | 25.0 | 2250.0 | |
| Labour | Village water trough rehabilitation / construction | days of labour | 30.0 | 25.0 | 750.0 | |
| Labour | Shading structure installation | days of labour | 35.0 | 25.0 | 875.0 | |
| Labour | Tractor + truck work (weed removal / water system / soil admendments) | days of labour | 22.0 | 50.0 | 1100.0 | |
| Equipment | Fencing equipment (gates, corner posts, cement, straining wire, electric fence energisers, galvanised wire, poles, insulators, voltage testers, high voltage wire, batteries, etc) | $325 per ha average for 3 sites | 110.0 | 326.0 | 35860.0 | |
| Equipment | Water tanks, pipes, drinking troughs, floats, values, etc | $292 per ha avg | 564.0 | 62.0 | 34968.0 | |
| Equipment | Protective fencing for agroforestry (posts, chain-link fencing) | rolls of 25 metres + 100 wooden posts | 12.0 | 250.0 | 3000.0 | |
| Equipment | Design and construction of tractor mounted ant mound leveller (recycled materials) | unit | 1.0 | 250.0 | 250.0 | |
| Equipment | Salt / Mineral block holder | units | 10.0 | 30.0 | 300.0 | |
| Plant material | Seedlings / Saplings (multispecies) | saplings | 334.0 | 24.0 | 8016.0 | |
| Plant material | Hay (small bale, avg. 20 kilos) | hay bales | 30.0 | 5.0 | 150.0 | |
| Fertilizers and biocides | Effective Microorganisms (EM) | L bag/box | 120.0 | 10.0 | 1200.0 | |
| Fertilizers and biocides | Vegetation recovery support measures, (Alfalfa seed) | kg | 150.0 | 9.0 | 1350.0 | |
| Construction material | Construction materials for fixed, village watering points | per water trough | 9.0 | 1000.0 | 9000.0 | |
| Construction material | Construction of shading structures | per structure | 2.0 | 1956.0 | 3912.0 | |
| Other | Contract of heavy machinery for ant mound removal | hours | 160.0 | 30.0 | 4800.0 | |
| Other | Contract of tractor and trailer for week removal | hours | 89.0 | 30.0 | 2670.0 | |
| Other | Livestock Salt / Mineral blocks | units | 50.0 | 8.0 | 400.0 | |
| Other | Holistic Planned Grazing Charts in Georgian (www.savory.global) | A2 printed chart | 10.0 | 30.0 | 300.0 | |
| Total costs for establishment of the Technology | 127801.0 | |||||
| Total costs for establishment of the Technology in USD | 127801.0 | |||||
If land user bore less than 100% of costs, indicate who covered the remaining costs:
The Project 'Achieving Land Degradation Neutrality Targets of Georgia through Restoration and Sustainable Management of Degraded Pasturelands (GCP/GEO/006/GFF)'
Comments:
While some labour support was provided by land users, the funding both for labour and materials was principally provided by the GCP/GEO/006/GFF Project
4.5 Maintenance/ recurrent activities
| Activity | Timing/ frequency | |
|---|---|---|
| 1. | Herding / driving / penning of livestock the paddocks | Every morning |
| 2. | Driving livestock to the village and shedding for afternoon milking | Every evening |
| 3. | Electric fence inspection and maintenance | Every 2 days charge and upkeep of fencing around perimeter needs to be checked |
| 4. | Water point inspection and maintenance | Every day, especially during cold periods under 0º C |
| 5. | Assessment of pasture condition and updating of grazing plans | Every week or when changes to plan are required |
| 6. | Inspection and maintenance of other infrastructure (agroforesty fencing, shading structures) | Every week |
| 7. | Ecological monitoring (i.e. PRAGA field sample sheets, photo library) | Every 3 to 6 months |
| 8. | Pasture user group discussions and completion of 'Annual Grazing Action Plan' and Grazing Planning charts | Annually before growing season. Additionally before start of non-growing season to measure standing forage |
| 9. | Weed and pest control | Every 3, preferably when undesirable species are at their most vulnerable stage in life cycle |
| 10. | Soil amendments (liming, Enhanced microbes, deep ripping, compost tea) | When required, always following cost-benefits analysis |
Comments:
Once properly installed and maintained, the infrastructure should require minimal additional investment. Sustaining and enhancing productivity gains depends primarily on regular monitoring—specifically, weekly pasture condition assessments and timely updates to the grazing planning charts. These actions ensure that plant recovery periods are respected, ground cover is maintained and that the composition of pasture species continues to evolve toward the agreed-upon goals set by land users and pasture managers.
4.6 Costs and inputs needed for maintenance/ recurrent activities (per year)
| Specify input | Unit | Quantity | Costs per Unit | Total costs per input | % of costs borne by land users | |
|---|---|---|---|---|---|---|
| Labour | Inspection of infrastructure (fencing, water, agroforestry, shading, etc) | days of labour (per month) | 3.0 | 25.0 | 75.0 | 100.0 |
| Labour | Repair of fencing and other infrastructure | days of labour (monthly) | 4.0 | 50.0 | 200.0 | 100.0 |
| Labour | Weed and Pest control | days of labour (per month) | 4.0 | 25.0 | 100.0 | 100.0 |
| Labour | Inspection of pasture condition | days of labour (per month) | 2.0 | 25.0 | 50.0 | 100.0 |
| Labour | Pasture / land user group meetings and planning | event | 4.0 | 75.0 | 300.0 | 100.0 |
| Labour | Soil amendments | days of labour (per month) | 1.0 | 30.0 | 30.0 | 100.0 |
| Labour | Ecological Monitoring | days of labour (per month) | 1.0 | 25.0 | 25.0 | 100.0 |
| Equipment | Infrastructure repairs (fencing, water, other) | parts (monthly avg.)) | 2.0 | 50.0 | 100.0 | 100.0 |
| Equipment | Replacement of tools (depreciation) | hand tools (monthly depreciation costs) | 2.0 | 5.0 | 10.0 | 100.0 |
| Fertilizers and biocides | Soil amendments | misc. (monthly) | 2.0 | 5.0 | 10.0 | 100.0 |
| Total costs for maintenance of the Technology | 900.0 | |||||
| Total costs for maintenance of the Technology in USD | 900.0 | |||||
Comments:
Maintenance and other operating costs estimated here do not take into consideration time moving animals from milking sheds/barns to the grazing areas.
4.7 Most important factors affecting the costs
Describe the most determinate factors affecting the costs:
While the technologies described here offer substantial benefits, their implementation costs may be prohibitive for communally managed lands without subsidized external support. However, a range of low-cost strategies can still create the desired grazing conditions, supporting plant recovery, herd effect, and beneficial animal impact. These include herding, the use of dogs, mobile water points, attractants, and more flexible mobile electric fencing systems, which can be established at a fraction of the cost outlined in this approach.
Nonetheless, some level of initial investment, whether in labour, materials, or in-kind contributions, is generally required to implement context-appropriate solutions for water access, herd control, and predator protection, particularly when livestock are kept in open-air or mobile enclosures.
In more densely populated areas, the installation of well-designed, durable perimeter fencing is strongly recommended to reduce conflict with other community members, especially where pasturelands border horticultural or cropping areas. With secure boundaries in place, internal management can rely on lower-cost tools such as mobile electric fencing or strategic herding. This setup not only enhances grazing control and herd management but also provides flexibility for future expansion, including the phased addition of water and shade infrastructure.
A key factor in implementation success is the willingness of contractors or community members to undertake fencing and tree planting on steep or difficult terrain. In several cases, contractors initially willing to bid later declined once the full extent of the site conditions was clarified.
5. Natural and human environment
5.1 Climate
Annual rainfall
- < 250 mm
- 251-500 mm
- 501-750 mm
- 751-1,000 mm
- 1,001-1,500 mm
- 1,501-2,000 mm
- 2,001-3,000 mm
- 3,001-4,000 mm
- > 4,000 mm
Specifications/ comments on rainfall:
Annual precipitation varies considerably across the three municipalities, from 536 mm in Dmanisi and 930 mm in Gurjaani to roughly 1,400 mm in Kazbegi. Due to its high-altitude climate, Kazbegi receives a substantial proportion of its precipitation as snowfall; Dmanisi also experiences a mix of rain and snow.
Agro-climatic zone
- semi-arid
The three municipalities exhibit a clear climatic gradient driven by elevation and geography. Kazbegi has a cold, wet alpine climate with substantial snowfall, Gurjaani experiences a warm, moderately humid lowland climate, and Dmanisi has a cooler, drier continental climate with some winter snowfall. Overall, conditions transition from high-mountain alpine in Kazbegi to semi-humid lowland in Gurjaani and semi-arid upland in Dmanisi.
5.2 Topography
Slopes on average:
- flat (0-2%)
- gentle (3-5%)
- moderate (6-10%)
- rolling (11-15%)
- hilly (16-30%)
- steep (31-60%)
- very steep (>60%)
Landforms:
- plateau/plains
- ridges
- mountain slopes
- hill slopes
- footslopes
- valley floors
Altitudinal zone:
- 0-100 m a.s.l.
- 101-500 m a.s.l.
- 501-1,000 m a.s.l.
- 1,001-1,500 m a.s.l.
- 1,501-2,000 m a.s.l.
- 2,001-2,500 m a.s.l.
- 2,501-3,000 m a.s.l.
- 3,001-4,000 m a.s.l.
- > 4,000 m a.s.l.
Indicate if the Technology is specifically applied in:
- not relevant
Comments and further specifications on topography:
Grazing planning took into consideration slope and monitored pasture conditions to reduce erosion and livestock trails on steeper paddocks.
5.3 Soils
Soil depth on average:
- very shallow (0-20 cm)
- shallow (21-50 cm)
- moderately deep (51-80 cm)
- deep (81-120 cm)
- very deep (> 120 cm)
Soil texture (topsoil):
- coarse/ light (sandy)
- medium (loamy, silty)
Soil texture (> 20 cm below surface):
- coarse/ light (sandy)
- medium (loamy, silty)
Topsoil organic matter:
- medium (1-3%)
If available, attach full soil description or specify the available information, e.g. soil type, soil PH/ acidity, Cation Exchange Capacity, nitrogen, salinity etc.
The soils of the three municipalities differ markedly in line with altitude and climate. Kazbegi is dominated by Humic Cambisols and Umbrisols, with Fluvisols in valley bottoms; these soils are generally shallow, acidic to near-neutral, rich in organic carbon, with moderate cation exchange capacity, low base saturation and nitrogen availability, and negligible salinity. Gurjaani is characterized by Chernozems, Calcisols, Cambisols, and Fluvisols, which are typically deep, neutral to slightly alkaline, with moderate to high cation exchange capacity, higher organic carbon and nitrogen contents, and low salinity, supporting intensive agriculture. Dmanisi comprises mainly Cambisols and Calcisols, often neutral to slightly alkaline, with moderate cation exchange capacity, lower organic carbon and nitrogen levels, and occasional salinity in poorly drained areas, reflecting drier climatic conditions.
5.4 Water availability and quality
Ground water table:
on surface
Availability of surface water:
medium
Water quality (untreated):
good drinking water
Water quality refers to:
surface water
Is water salinity a problem?
No
Is flooding of the area occurring?
No
Comments and further specifications on water quality and quantity:
Sufficient water quality and quantity were seen by all stakeholders as essential for success in use of the livestock in the SLM technology as described here. Clean, accessible water supports digestion, feed intake, reproduction, and reduces stress-related behaviours. Strategically managed water resources also improves efficiency. To achieve this, water points were designed with adequate offtake capacity to meet herd demand, minimizing competition and preventing dominant animals from guarding access out of fear that supply will run out.
5.5 Biodiversity
Species diversity:
- high
Habitat diversity:
- high
Comments and further specifications on biodiversity:
Grassland and pasture biodiversity across Kazbegi, Gurjaani, and Dmanisi reflects strong altitudinal and climatic gradients. Kazbegi supports alpine and subalpine grasslands, characterized by high species richness and endemism, dominated by cold-tolerant perennial grasses (e.g. Festuca, Poa, Nardus) and diverse forbs, with relatively low productivity but high conservation value. Gurjaani’s grasslands are largely secondary and semi-natural steppe and meadow systems, shaped by long-term agricultural use, with moderate species diversity dominated by mesophilous and xeromesophilous grasses and legumes, and lower structural complexity due to intensification. Dmanisi lies in a transitional upland zone, supporting dry montane and steppe-like pastures with lower overall species richness but high resilience to grazing and drought, dominated by xerophytic grasses and forbs. Overall, biodiversity patterns shift from species-rich, climate-sensitive alpine grasslands in Kazbegi to more managed and disturbance-tolerant pasture systems in Gurjaani and Dmanisi.
5.6 Characteristics of land users applying the Technology
Sedentary or nomadic:
- Sedentary
- Semi-nomadic
Market orientation of production system:
- mixed (subsistence/ commercial)
Off-farm income:
- 10-50% of all income
Relative level of wealth:
- poor
Individuals or groups:
- individual/ household
- groups/ community
Level of mechanization:
- manual work
- mechanized/ motorized
Gender:
- women
- men
Age of land users:
- middle-aged
- elderly
Indicate other relevant characteristics of the land users:
Following in-depth socio-economic household surveys, project beneficiaries were principally land users who owned more one or more head of cattle or sheep and used community pastures as one of their principal sources of forage for their animals. This group was actively engaged in the project’s design, initial activities, and all implementation processes carried out in 2023. While exceptions could be found, most beneficiaries use their cattle for dairy production. Milk was either consumed fresh or processed at home into dairy products such as cheese. Surplus milk was typically sold at the farm gate to neighbours or collected by traveling milk buyers, who then supplied the dairy industries.
5.7 Average area of land used by land users applying the Technology
- < 0.5 ha
- 0.5-1 ha
- 1-2 ha
- 2-5 ha
- 5-15 ha
- 15-50 ha
- 50-100 ha
- 100-500 ha
- 500-1,000 ha
- 1,000-10,000 ha
- > 10,000 ha
Is this considered small-, medium- or large-scale (referring to local context)?
- medium-scale
Comments:
There was, at the time of the project, a disconnect between land users, land tenure rights, and the clarity of the official Georgian cadastre system. However, the project played a key role in assisting both land users and Georgian authorities by developing solutions and protocols that promoted a more participatory and transparent legal frameworks.
5.8 Land ownership, land use rights, and water use rights
Land ownership:
- state
- communal/ village
Land use rights:
- open access (unorganized)
- leased
Water use rights:
- open access (unorganized)
- communal (organized)
Are land use rights based on a traditional legal system?
No
Specify:
The majority of Georgian pastureland ownership has been transferred to the Ministry of Economy and Sustainable Development, which is currently developing lease schemes aimed at generating income from these lands and promoting a more professional and sustainable livestock sector.
Comments:
Following the land reforms of the 1990s, ownership of agricultural land in Georgia today is mostly in small‐scale private hands. The average agricultural holding is about 1.37 hectares, though in many regions it is smaller and often fragmented. State or municipal bodies retain ownership of large portions of agricultural land, especially pastures, hayfields and meadows. The majority of pastureland remains state owned or managed, with leases used for commercial agriculture, but there is no legal category of “communal land ownership” in Georgia under which land is jointly owned by villagers or communities. Project beneficiaries are thus overwhelmingly small‐scale household farmers, operating under private ownership of their land‐parcels, or under lease agreements if using state land.
5.9 Access to services and infrastructure
health:
- poor
- moderate
- good
education:
- poor
- moderate
- good
technical assistance:
- poor
- moderate
- good
employment (e.g. off-farm):
- poor
- moderate
- good
markets:
- poor
- moderate
- good
energy:
- poor
- moderate
- good
roads and transport:
- poor
- moderate
- good
drinking water and sanitation:
- poor
- moderate
- good
financial services:
- poor
- moderate
- good
Comments:
Household surveys conducted during the project’s baseline studies revealed that livestock owners had taken only minor, uncoordinated actions to improve or preserve the productivity of their local pasturelands. The only practice reported was a seasonal system of rotational grazing. Farmers identified several challenges affecting pasture productivity, with the most frequently cited issue being a lack of available pastureland caused by limited nearby pasture areas, meadow reforestation, and weed encroachment. Water accessibility on pastures also emerged as a significant problem, with 60 cases (40%) reporting insufficient irrigation and drinking water for livestock. Overall, 60% of farmers emphasized that improving water availability on pastures is essential.
6. Impacts and concluding statements
6.1 On-site impacts the Technology has shown
Socio-economic impacts
Production
fodder production
Comments/ specify:
Land users reported an notable increase in pasture production, with more leaf surface area and biomass volume per plant, and agreed with an estimate of 10 to 20% more pasture biomass after the first year of application. This was supported by ecological monitoring that found average pasture sward height increased by an average of 10 cm.
fodder quality
Comments/ specify:
Fodder quality was seen to increase through annual ecological monitoring. Palatable plants were larger and more developed when compared to surrounding non-pilot site pasture areas and there was more diversity in pasture composition, with a documented increase in forbs, legumes and perennial grasses.
animal production
Comments/ specify:
Land users consistently reported increased milk yields following the adoption of Controlled Grazing technology. This improvement was attributed to enhanced pasture productivity and palatability, extended growing seasons, reduced distances walked by livestock, decreased parasite loads on pasture, better access to clean water, and availability of mineral and salt licks.
risk of production failure
Comments/ specify:
Risk is expected to have been reduced due to land users learning how to optimise pasture growth during the growing season and improved management of the standing biomass during the non-growing season. Cooperation and planning also reduces drought impact and conflict over shared pastoral resources.
land management
Comments/ specify:
Controlled Grazing's focus on use of ruminant animals to shape and maintain ecological processes allows for a more holistic perspective on land management and use of Nature-based Solutions to achieve Land Degradation Neutrality.
Water availability and quality
water availability for livestock
Comments/ specify:
While some water points were active, the majority of communally used, livestock watering points were in poor condition, had suffered years of neglect and at time incapable of delivering sufficient water for livestock needs.
water quality for livestock
Comments/ specify:
Water quality was typically poor before the project activities improved water points and provided mobile watering systems.
Income and costs
farm income
Comments/ specify:
Improvement rates in reproduction and livestock productivity were observed following the first year of applying Controlled Grazing, together with its supporting activities described in this report. This reportedly increased household income for participant land users by increasing calving rates and milk production.
workload
Comments/ specify:
One of the clear benefits of Controlled Grazing is that animals are grazed together as a group in specific areas during the day, which greatly reduces distances travelled, time spent following livestock and time spent searching for lost or injured animals.
Socio-cultural impacts
food security/ self-sufficiency
Comments/ specify:
Reliance on dairy cows for household consumption and cash income is still a vital part of rural Georgian livelihoods and improved animal productivity and health through improved fodder quantity and quality contributes to rural communities resilience.
land use/ water rights
Comments/ specify:
Professionalisation of Georgia's livestock sector is expected to improve land tenure rights claims by de facto community land users, especially if rural communities can demonstrate the positive role that livestock can potentially play in reducing land degradation and keeping Georgian rural communities vibrant. Controlled Grazing leverages current resources and mimics more natural herd movements to achieve this.
SLM/ land degradation knowledge
Comments/ specify:
Controlled grazing conveys basic ecological literacy to users regarding grasslands and grazed environments. These learnings are increased when management is combined with the annual pasture monitoring systems and analysis sheets provided through the PRAGA approach described in the Approaches database.
conflict mitigation
Comments/ specify:
Conflict over community pastures has been commonplace due to lack of clear land tenure rights and regulations regarding who can access Municipal and State owned lands. Through cooperation and planning, land users have seen first hand how Controlled Grazing provides more pasture quantity and quality, improving animal productivity and health, as well as reducing labour costs and providing a technology that is seen by authorities as a positive contributor to LDN.
situation of socially and economically disadvantaged groups
Comments/ specify:
As mentioned, land users are mostly elderly rural populations who depend on their small number of milking cows for household dairy products and income. This is seen to directly benefit them by increasing income and reducing time spent in the field herding animals.
Ecological impacts
Water cycle/ runoff
water quantity
Comments/ specify:
While still early to effectively determine long term trends, decreases in bare ground and livestock trailing on upper slopes should lead to improved water infiltration rates, resulting in a slower release of water by landscapes, moderating river flows and allowing for longer pasture growing seasons.
water quality
Comments/ specify:
Waterborne parasites are commonly ingested by livestock when animals have open access to their drinking source or where manure contamination is common. This was addressed through investments detailed in this document that provided for a range of innovative fixed and mobile trough systems.
surface runoff
Comments/ specify:
Reductions in bare soil and erosion was observed through the PRAGA field sheet data collection, and land users commented on earlier start and later end to the growing season, both of which would indicate an overall reduction in surface runoff.
evaporation
Comments/ specify:
Extended growing seasons is a positive indicator that increased pasture canopy and leaf litter have reduced soil surface temperatures, thus reducing evaporation.
Soil
soil moisture
Comments/ specify:
Increased pasture productivity and extended growing seasons was seen as indicative of improved management outcomes within relatively short time frames, with precipitation being more effective in leading to growth of target species.
soil cover
Comments/ specify:
Controlled Grazing was shown through monitoring to reduce bare ground within the first growing season, leading to other positive field-based outcomes.
soil loss
Comments/ specify:
Soil erosion rates in the participant project communities were observed through field monitoring to have been reduced at paddock level through Controlled Grazing.
soil crusting/ sealing
Comments/ specify:
The use of attractants, such as salt and hay to concentrate animal impact, as well as the application of Effective Microorganisms (EM) Effective Microorganisms (EM), were applied to break up soil crusts. Initial results were positive following application in terms of physical disturbance of the crusts though more time is required to evaluate recovery of the site.
salinity
Comments/ specify:
Tractors using boom sprays applied Effective Microorganisms (EM) and use of attractants in areas where salt scalds were severe was trialled. As with the soil crusting, initial results were positive but more time is required to see how well the approach provides a solution.
Biodiversity: vegetation, animals
Vegetation cover
Comments/ specify:
Field surveys showed increases overall vegetation cover, with longer green growing seasons.
biomass/ above ground C
Comments/ specify:
Increases in pasture biomass were estimated to be between 10 to 20% overall, with marked differences between and within paddocks mostly driven by differences in soil depth and available moisture.
plant diversity
Comments/ specify:
Field monitoring over the course of the project showed marked increases in forbs and legumes within the pasture swards.
invasive alien species
Comments/ specify:
Together with the more palatable species, weed species were observed to benefit from the new grazing patterns, and were manually and mechanically cut over the course of the project.
beneficial species
Comments/ specify:
The observed increase in forbs and legumes were considered highly palatable and therefore beneficial. There are also IUCN Red Listed species in the area, with examples being registered within the pilot sites both before and during application of the CG technology.
Climate and disaster risk reduction
drought impacts
Comments/ specify:
Extended growing seasons were observed even under erratic and below average rainfall years, providing evidence that CG is a powerful tool for drought, where destocking is orderly and planned in the onset of severe drought conditions.
emission of carbon and greenhouse gases
Comments/ specify:
While cattle have some of the highest rates of methane production per head of livestock species, it is also important to consider the role of health pastureland soil's capacity to mitigate this and other GHG emissions. A number of studies point to the high presence of methanotrophic bacteria typically associated with healthy grassland ecosystem soils, which when present in sufficient quantities, can offset ruminant methane emissions (Knief 2015; Le Mer & Roger 2001).
fire risk
Comments/ specify:
While not specifically an objective of this project, the use of ruminant animals to reduce flammable biomass in landscapes is well documented, and the infrastructure could be used to purposely overgraze areas near the communities to create fire breaks in a cost effective manner.
Specify assessment of on-site impacts (measurements):
Annual monitoring was conducted by using the PRAGA field data sheets, which collect information on soil surface conditions (crusting, % bare ground), presence and extent of erosion, and pasture height, palatability, evidence of seed production or establishment and observed pasture species. Locals contributed to the list of indicators by adding 'presence of woody weed species' to the monitoring sheets.
6.2 Off-site impacts the Technology has shown
Specify assessment of off-site impacts (measurements):
None to report at present.
6.3 Exposure and sensitivity of the Technology to gradual climate change and climate-related extremes/ disasters (as perceived by land users)
Gradual climate change
Gradual climate change
| Season | increase or decrease | How does the Technology cope with it? | |
|---|---|---|---|
| annual temperature | increase | very well | |
| seasonal temperature | summer | increase | moderately |
| annual rainfall | decrease | well | |
| seasonal rainfall | wet/ rainy season | decrease | well |
Climate-related extremes (disasters)
Climatological disasters
| How does the Technology cope with it? | |
|---|---|
| extreme winter conditions | not well |
| drought | very well |
| land fire | very well |
Comments:
While grassland and pasture growth is closely related to precipitation rates, the capacity of the Controlled Grazing to adapt to changing conditions and monitor for future stock of forrage and livestock numbers, drought and other climatic events, especially the gradual changes, can be mitigated and grasslands can once again contribute to global climatic stability and biodiversity.
6.4 Cost-benefit analysis
How do the benefits compare with the establishment costs (from land users’ perspective)?
Short-term returns:
slightly positive
Long-term returns:
positive
How do the benefits compare with the maintenance/ recurrent costs (from land users' perspective)?
Short-term returns:
positive
Long-term returns:
very positive
Comments:
Long-term results are still to be determined though for the most part the response has been positive to the Controlled Grazing Technology approach, as well as the supporting activities that were funded by the project. Land users have wanted to address their concerns about their community pastureland tenure status and land management issues that were leading to land degradation and loss of pastureland productivity that were vital to their livelihoods.
6.5 Adoption of the Technology
- single cases/ experimental
If available, quantify (no. of households and/ or area covered):
564 ha of land, 3 communally grazed pasture sites, 92 households
Of all those who have adopted the Technology, how many did so spontaneously, i.e. without receiving any material incentives/ payments?
- 0-10%
Comments:
The results of applying the Controlled Grazing technology and supporting pasture improvement activities are still being showcased and understood by the participant communities and those around them. We have documented the SLM systems and solutions described here being replicated by onlookers to the process, especially professional livestock producers with private land or leasing agreements. There has also been recorded the entry of new professionals to the sector thanks in part to the project, its capacity building activities and the infrastructure investments.
6.6 Adaptation
Has the Technology been modified recently to adapt to changing conditions?
No
6.7 Strengths/ advantages/ opportunities of the Technology
| Strengths/ advantages/ opportunities in the land user’s view |
|---|
| Increased pasture productivity – Land managers reported enhanced grass growth and a greater presence of palatable forage species due to controlled grazing, which improved ground cover and boosted the pasture's photosynthetic capacity. |
| Animal health and performance - Land managers reported an increase in milk production and livestock condition as a result of improved pasture productivity. This also reportedly led to reduced veterinary visits and treatments of livestock ailments. |
| Reduced Labour and Time Requirements – Controlled grazing significantly decreased the time and effort required for herding, locating livestock, regrouping animals, and separating them when they mixed with other herds on communal pasturelands. By moving their livestock to designated paddocks each day, owners could contain them with access to water, mineral licks, and appropriate shelter or shade depending on the season. This allowed livestock managers to confidently leave the animals for the day, freeing up time for other activities. Knowing the herd’s location in the afternoon also reduced the time needed to gather them in the evening, enabling more efficient use of the day. |
| Controlled grazing makes it easier to estimate the forage availability in each paddock, calculate the number of grazing days remaining, assess forage growth rates, and track the duration of growing and non-growing seasons. This enhanced planning ability is critical for aligning livestock management with peak market opportunities and for anticipating and responding proactively to drought or other extreme weather events that could impact the viability of the livestock enterprise. |
| Strengths/ advantages/ opportunities in the compiler’s or other key resource person’s view |
|---|
| The capacity to plan ahead is a highly valuable tool that is greatly improved upon through use of planning charts, basic data collection and observation of on-ground changes to management and grazing times and impact. Failure to do so often results in loss of livestock to starvation and disease, or costly inputs of hay and grain to maintain them through drought periods, and overall lost productivity due to poor pasture management, especially where overgrazing is rampant and has severely degraded grasslands and native pastures. |
| The majority of land users and beneficiaries of the project typically own one or two milking cows that provide fresh milk and dairy products for the household, with some excess being sold. Therefore, livestock production typically is not their prime source of income and use of the Controlled Grazing technology allows them to have more time to dedicate to other economic activities by reducing herding time and them having to keep an eye on their animals over the course of the day. |
| The technology, and the concepts underlying the technology, are highly adaptable to a wide range of grazing contexts. For those without access to fencing, piping or other materials cited in this article, the option to herd as a community, with a rotation system in place for herders or hire of a professional herder, exist. The key is to proactively herd and allow for adequate grass/plant recovery times following grazing applications. |
| Grazing and Animal Impact as Ecological Tools – Managed grazing and the natural impact of animals are essential tools for maintaining the health and resilience of grasslands, rangelands, steppes, and native pasturelands. When ruminants are removed for extended periods and rest is over-applied, key ecological processes, such as mineral cycling and water infiltration, begin to break down, often accelerating land degradation and desertification. The critical factors are the timing and intensity of grazing. These must be carefully planned and actively managed, either through herding or appropriate technology, to ensure a positive impact on the ecosystem. |
6.8 Weaknesses/ disadvantages/ risks of the Technology and ways of overcoming them
| Weaknesses/ disadvantages/ risks in the land user’s view | How can they be overcome? |
|---|---|
| Although the project provided numerous preparatory trainings and awareness-raising activities, the project beneficiary land users in pilot villages have expressed limited capacities to fully use and benefit from the pastureland restoration supports, especially in terms of introducing a controlled grazing system without project support. | Build on peer to peer learning opportunities and leverage the learnings gained through this project to find low cost, low resource intensive methods to replicate the core concepts applied in this project, and seek to support these process at scale. |
| Participant population's interests and employment structures are gradually shifting towards other sectors outside of subsidence livestock and crop production. This led to some of those that had been active participants in the workshops and training events to leave the area for other economic opportunities, creating gaps in knowledge and transfer of experience with the technology and supporting activities. | Develop positive economic and livelihood models and market opportunities that appeal to youth who are interested in livestock production as potential source of income. |
| The low level of self-organization skills among local farmers in pilot villages posed a significant obstacle to the formation and effective functioning of the established Pasture Users Unions. This required extended consultations and additional efforts by the project to support PUUs meetings, joint deliberations, and decision-making on pasture management issues. | It is of everyone's best interest to properly manage the communal grassland areas that typically surround Georgia's rural communities. Formal organisations such as Pasture User Group's offer many advantages though can also mean administrative requirements, bureaucracy and political interference with decision-making. Other less formal options might be more adequate to ensure that the Controlled Grazing technology and/or its basic concepts are being properly applied, especially in areas that are experiencing rapid degradation of local communal grazing lands. |
| Weaknesses/ disadvantages/ risks in the compiler’s or other key resource person’s view | How can they be overcome? |
|---|---|
| Consensus among rural communities and capacity to work together has long been a tradition, though it must be recognised that often different subgroups form along family, political or economic lines and some community members may be highly resistant to working with other community members or as a whole. | The Controlled Grazing technology, and its underlying concepts, can be seen as a mobile response to land degradation. If the technology were applied to specific areas in different frequencies and patterns, other areas could be seen as 'sacrifice areas' where overgrazing would be allowed for those unwilling or resistant to participating in the Controlled Grazing applications using their livestock. |
| Even with good results, the initial interest in the technology tends to fade and maintenance and planning activities often decrease as time progresses. Add to this the current rural demographics, with a significant part of the working population moving to cities or regional centres for economic opportunities, and those most capable of starting professional livestock enterprises and using their herds to maintain the communal and privately managed grasslands of Georgia. | Livestock production and rural village life need to be seen as viable options that bring economic stability and recognition from society as valued members of society. This requires policies that allow for these conditions to be met, and the showcasing of models that work. Controlled Grazing could play a part in this in that it applies concepts from natural grasslands and wild herbivores to regenerate land and provide for livelihoods in a sustainable, cost-effective way. |
| Experience has shown that people often fixate on the need, the cost and/or their lack of basic infrastructure, with fencing and water being the main focal points of discussions among land users. Some will say that unless everything is in place, it is not possible to start applying Controlled Grazing. | A good facilitator needs to understand how to guide this conversation, because often it is not necessary to have investments to start and rural people are very resourceful and most likely have the capacity to start applying Controlled Grazing and/or its concepts in small, incremental steps. |
| Land management at scale, especially communal lands, requires local buy-in as well as support from community leaders and government. This includes adequate policies that permit and facilitate livestock movement across the landscape as a means of maintaining ecosystem services and productive, economically vibrant communities. | The GCP/GEO/006/GFF project worked closely with the relevant Georgian Ministries to promote the use of the Controlled Grazing technology and has presented the results and recommendations to responsible parties for policy that affect land management and land tenure access and rights. |
7. References and links
7.1 Methods/ sources of information
- interviews with land users
1200
- interviews with SLM specialists/ experts
50
Comments:
The project ran from the design phase in 2019 to its conclusion in 2025. Over that time, a wide range of stakeholders were consulted through different official and informal work streams.
7.3 Links to relevant online information
Title/ description:
Holistic Management - a framework for managing complexity
URL:
https://savory.global/holistic-management/
Title/ description:
The Savory Institute Library
URL:
https://savory.global/library/
Title/ description:
Voisin’s Four Laws of Rational Grazing
URL:
https://crawford.extension.wisc.edu/voisins-four-laws-of-rational-grazing/
Title/ description:
Controlled and Rotational Grazing
URL:
https://isqaper-is.eu/grazing-management/grazing/436-controlled-and-rotational-grazing
Title/ description:
Sustainable rangeland management in Sub-Saharan Africa - Guidelines to good practice
URL:
https://wocat.net/en/wocat-media-library/sustainable-rangeland-management-in-sub-saharan-africa-guidelines-to-good-practice/
Title/ description:
WOCAT Technology Database - Rotational Grazing (Türkiye)
URL:
https://wocat.net/en/database/technologies/1398/
7.4 General comments
A special thanks to all those involved with the 'Achieving Land Degradation Neutrality Targets of Georgia through Restoration and Sustainable Management of Degraded Pasturelands (GCP/GEO/006/GFF)' project, especially the land users and community members of the Dmanisi, Gurjaani and Kazbegi municipalities who took the time to contribute their efforts and livestock to work with the project to implement this technology on their communal grasslands.
Links and modules
Expand all Collapse allLinks
Participatory Grassland and Rangeland Assessment (PRAGA) [Georgia]
The Participatory Rangelands and Grasslands Assessment Methodology (PRAGA) is a rapid, cost-effective framework for the integrated assessment of rangeland ecosystems, incorporating diverse data sources and participatory approaches. PRAGA facilitates stakeholder engagement through consultations and workshops, underpinned by community-based mapping of grazing areas, land use dynamics, and trend analyses.
- Compiler: Nicholas Euan Sharpe
Municipal Pastureland Planning [Georgia]
The Municipal Pastureland Planning approach was developed collaboratively with key national and local stakeholders to establish a structured, evidence-based decision support framework for sustainable rangeland governance. This system consolidates and presents data from diverse stakeholder groups in a format fully compatible with the Land Degradation Neutrality Framework, ensuring that planning …
- Compiler: Nicholas Euan Sharpe
Modules
No modules