Non-inversion tillage in UK arable cropping; Loddington [United Kingdom]
- Creation:
- Update:
- Compiler: Ceris A. Jones
- Editor: –
- Reviewer: Fabian Ottiger
minimum tillage (English), conservation tillage (English)
technologies_986 - United Kingdom
View sections
Expand all Collapse all1. General information
1.2 Contact details of resource persons and institutions involved in the assessment and documentation of the Technology
SLM specialist:
Name of project which facilitated the documentation/ evaluation of the Technology (if relevant)
Soil and water protection (EU-SOWAP)Name of the institution(s) which facilitated the documentation/ evaluation of the Technology (if relevant)
Game & Wildlife Conservation Trust - United Kingdom1.3 Conditions regarding the use of data documented through WOCAT
When were the data compiled (in the field)?
02/11/2004
The compiler and key resource person(s) accept the conditions regarding the use of data documented through WOCAT:
Yes
1.5 Reference to Questionnaire(s) on SLM Approaches
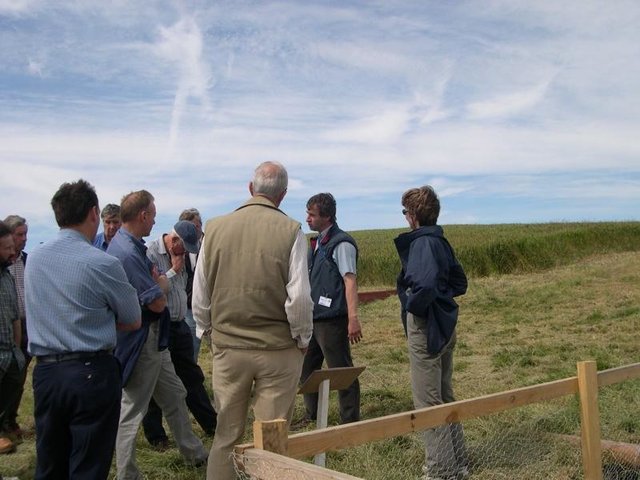
Participatory on-farm demonstration in UK arable cropping: Loddington [United Kingdom]
Provision of expert knowledge in appropriating equipment and setting up small scale on farm trials in collaboration with the land manager
- Compiler: Ceris A. Jones
2. Description of the SLM Technology
2.1 Short description of the Technology
Definition of the Technology:
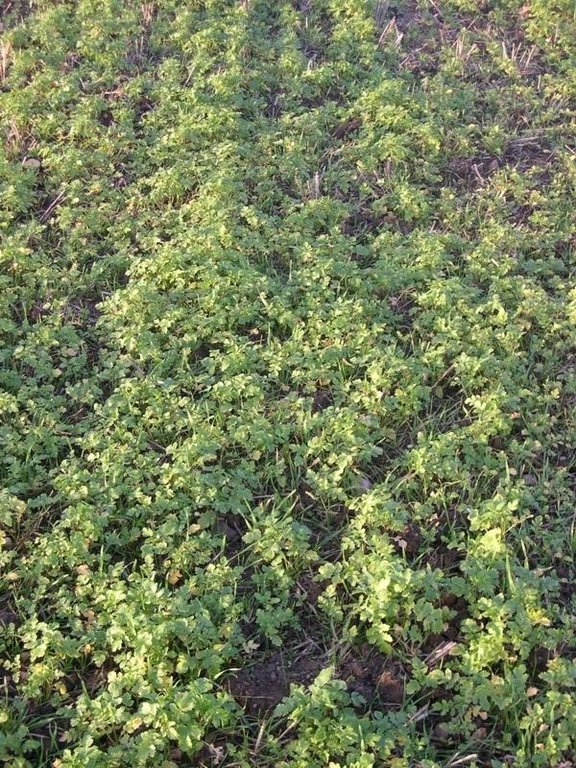
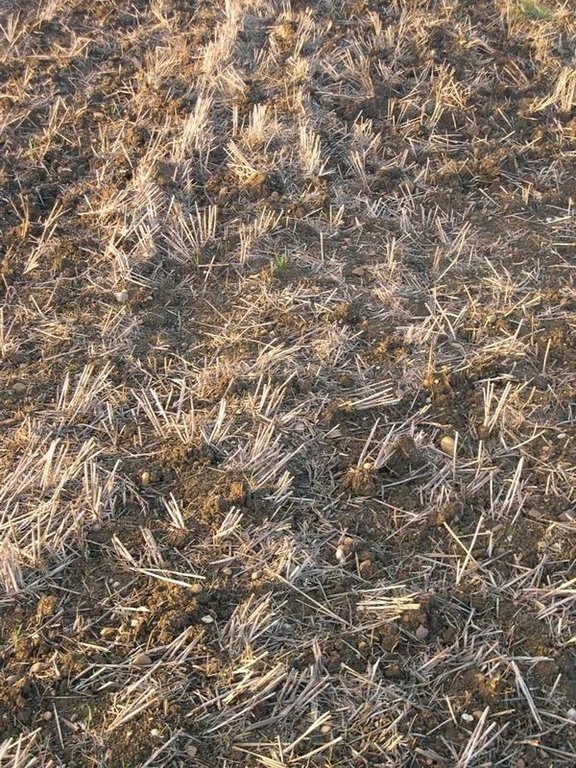
Surface cultivation of the top 10cm of soil but not complete inversion
2.2 Detailed description of the Technology
Description:
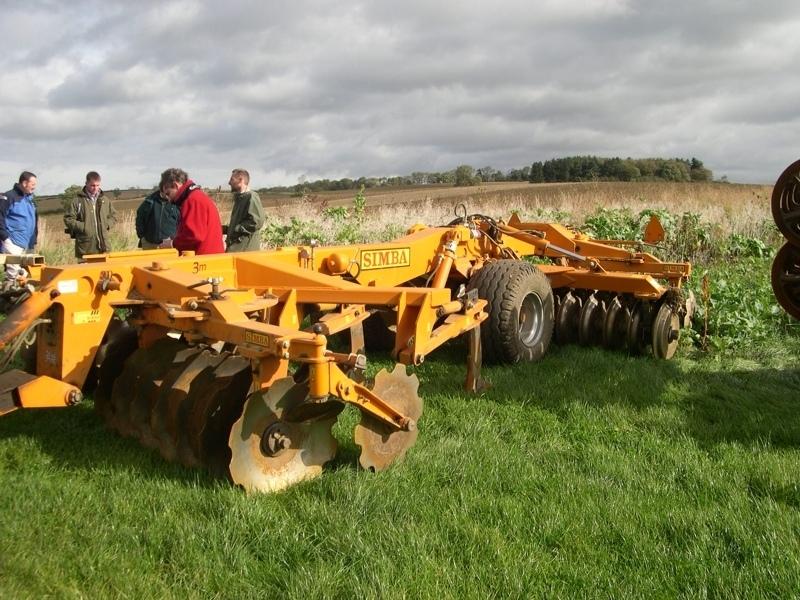
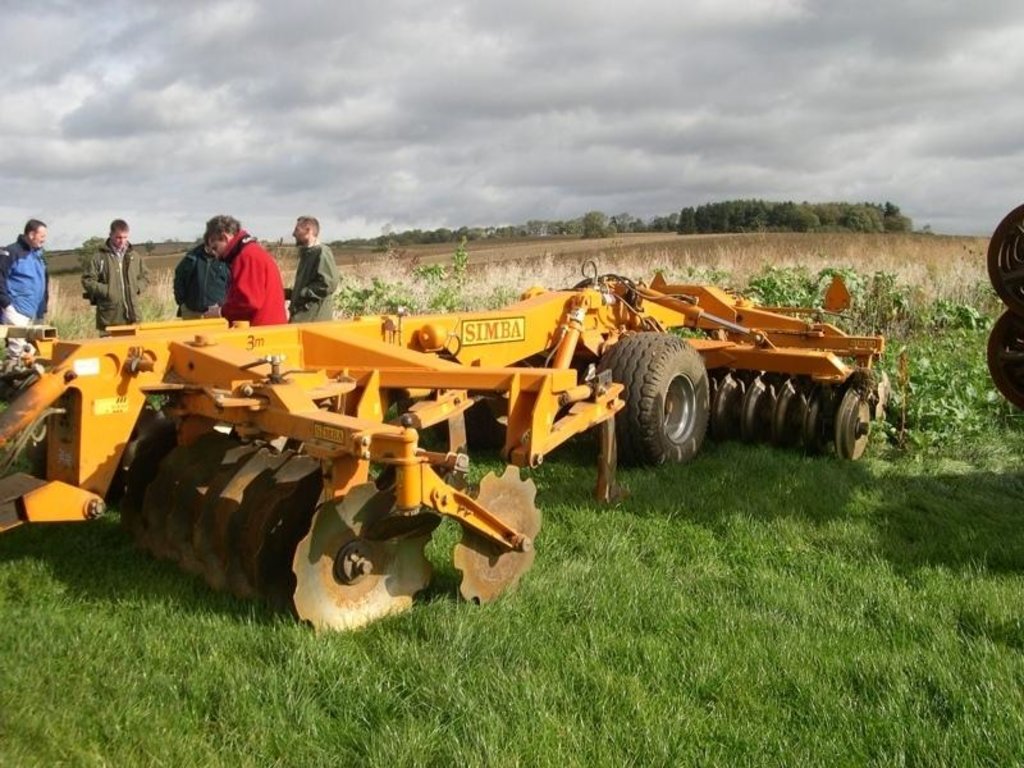
machinery with discs or tines replace the plough.
Purpose of the Technology: (i) improved crop establishment particularly by speeding up of operations (ii) improved soil structure.
Establishment / maintenance activities and inputs: appropriate machinery, soil condition and following crop all determine establishment.
Maintenance: on an annual basis.
Natural / human environment: farmer working to protect environment and maintain rural employment
2.3 Photos of the Technology
2.5 Country/ region/ locations where the Technology has been applied and which are covered by this assessment
Country:
United Kingdom
Region/ State/ Province:
Leicestershire
Further specification of location:
Loddington
Map
×2.7 Introduction of the Technology
Comments (type of project, etc.):
From the USA where in te 1930's the 'dust-bowls' necessitated the development of soil conservation in intensive agriculture
3. Classification of the SLM Technology
3.2 Current land use type(s) where the Technology is applied

Cropland
- Annual cropping
Main crops (cash and food crops):
Major cash crop: Wheat
Other crops: Oilseed rape, beans
Comments:
Major land use problems (compiler’s opinion): Water turbidity, compaction, erosion
Major land use problems (land users’ perception): Compaction
Type of cropping system and major crops comments: wheat - oilseed rape - wheat - beans. Typically these will be winter-sown (Sept) crops rather than spring sown (March)
3.3 Further information about land use
Water supply for the land on which the Technology is applied:
- rainfed
Number of growing seasons per year:
- 1
Specify:
Longest growing period in days: 330Longest growing period from month to month: Sep - Aug
3.4 SLM group to which the Technology belongs
- minimal soil disturbance
3.5 Spread of the Technology
Comments:
Total area covered by the SLM Technology is 1.46 m2.
This represents 60% of the total arable area on the farm
3.6 SLM measures comprising the Technology
3.7 Main types of land degradation addressed by the Technology
soil erosion by water
- Wt: loss of topsoil/ surface erosion
- Wo: offsite degradation effects
chemical soil deterioration
- Cn: fertility decline and reduced organic matter content (not caused by erosion)
physical soil deterioration
- Pc: compaction
Comments:
Main type of degradation addressed: Pc: compaction
Secondary types of degradation addressed: Wt: loss of topsoil / surface erosion, Wo: offsite degradation effects, Cn: fertility decline and reduced organic matter content
Main causes of degradation: other human induced causes (specify) (agricultural causes), education, access to knowledge and support services (lack of knowledge)
3.8 Prevention, reduction, or restoration of land degradation
Specify the goal of the Technology with regard to land degradation:
- prevent land degradation
- reduce land degradation
Comments:
Main goals: mitigation / reduction of land degradation
Secondary goals: prevention of land degradation
4. Technical specifications, implementation activities, inputs, and costs
4.2 Technical specifications/ explanations of technical drawing
Technical knowledge required for field staff / advisors: moderate
Technical knowledge required for land users: high
Main technical functions: control of dispersed runoff: impede / retard
Secondary technical functions: control of raindrop splash, control of concentrated runoff: impede / retard, improvement of ground cover, increase in organic matter, increase of infiltration, increase / maintain water stored in soil, improvement of soil structure, increase in soil fertility
Mulching
Material/ species: crop residue
Quantity/ density: 5 t/ha
Remarks: dispersed over soil surface
Mineral (inorganic) fertilizers
Material/ species: NPK
Quantity/ density: 0.14 t/ha
Remarks: broadcast
Rotations / fallows
Material/ species: cereals/ broad-leaved crops
Remarks: alternate years
Breaking compacted topsoil
Remarks: localised
Minimum tillage
Remarks: using discs and tines
Breaking compacted subsoil
Remarks: localised
Deep tillage / double digging
Remarks: localised
4.3 General information regarding the calculation of inputs and costs
other/ national currency (specify):
UK pounds (£)
Indicate exchange rate from USD to local currency (if relevant): 1 USD =:
0.56
Indicate average wage cost of hired labour per day:
155.00
4.6 Maintenance/ recurrent activities
| Activity | Type of measure | Timing/ frequency | |
|---|---|---|---|
| 1. | Year1: chop straw as low to the ground as possible | Agronomic | at harvest (usually August) / annual |
| 2. | Year1: incorporate straw to 10cm depth, though this is dependent on density of straw | Agronomic | September / per crop |
| 3. | Year1: additional cultivation | Agronomic | early October / per crop |
| 4. | Year1:drilling (4cm depth) | Agronomic | early October / once per crop |
| 5. | Year1: consolidation (more in Annex 3) | Agronomic | early October / once per crop |
4.7 Costs and inputs needed for maintenance/ recurrent activities (per year)
| Specify input | Unit | Quantity | Costs per Unit | Total costs per input | % of costs borne by land users | |
|---|---|---|---|---|---|---|
| Equipment | Machine use | ha | 1.0 | 204.0 | 204.0 | 100.0 |
| Equipment | Machine hours (year 2) | ha | 1.0 | 184.0 | 184.0 | 100.0 |
| Equipment | Machine hours (year 3) | ha | 1.0 | 236.0 | 236.0 | 100.0 |
| Total costs for maintenance of the Technology | 624.0 | |||||
Comments:
Machinery/ tools: Simba Solo, Cambridge rollers, Vaderstad drill
Per hectare of land where technology applied. The costs represent the total crop establishment costs (machinery + labour) for this technology. Other costs eg seeds, fertiliser, are not included as these are identical to those incurred by other technologies (UNK1b) at this farm. These costs are related to the prevailing conditions - crop type, state of the soil, climate etc. Crop establishment costs by ploughing were: 224 (year1), 204 (year2), 263 (year3)
Additional info: - Year2: chop straw as low to the ground as possible: after harvest / annual - Year2:incorporate straw to 10cm depth, though this is dependent on density of straw: September / per crop - Year2: additional cultivation: March / per crop - Year2: drilling (2.5-4cm depth): March / once per crop - Year3:chop straw as low to the ground as possible: after harvest / annual - Year3: incorporate straw and relieve compaction of soil: October / per crop - Year3: additional cultivation: October / per crop - Year3: drill (2.5-4cm depth): October / once per crop - Year3: consolidation: October / once per crop
4.8 Most important factors affecting the costs
Describe the most determinate factors affecting the costs:
Equipment costs, slope (higher horse power required for steeper slopes), presence of weeds (higher herbicide costs),
5. Natural and human environment
5.1 Climate
Annual rainfall
- < 250 mm
- 251-500 mm
- 501-750 mm
- 751-1,000 mm
- 1,001-1,500 mm
- 1,501-2,000 mm
- 2,001-3,000 mm
- 3,001-4,000 mm
- > 4,000 mm
Specify average annual rainfall (if known), in mm:
660.00
Agro-climatic zone
- sub-humid
5.2 Topography
Slopes on average:
- flat (0-2%)
- gentle (3-5%)
- moderate (6-10%)
- rolling (11-15%)
- hilly (16-30%)
- steep (31-60%)
- very steep (>60%)
Landforms:
- plateau/plains
- ridges
- mountain slopes
- hill slopes
- footslopes
- valley floors
Altitudinal zone:
- 0-100 m a.s.l.
- 101-500 m a.s.l.
- 501-1,000 m a.s.l.
- 1,001-1,500 m a.s.l.
- 1,501-2,000 m a.s.l.
- 2,001-2,500 m a.s.l.
- 2,501-3,000 m a.s.l.
- 3,001-4,000 m a.s.l.
- > 4,000 m a.s.l.
Comments and further specifications on topography:
Landforms: Hill slopes (some slopes < 8%)
5.3 Soils
Soil depth on average:
- very shallow (0-20 cm)
- shallow (21-50 cm)
- moderately deep (51-80 cm)
- deep (81-120 cm)
- very deep (> 120 cm)
Soil texture (topsoil):
- medium (loamy, silty)
- fine/ heavy (clay)
Topsoil organic matter:
- medium (1-3%)
If available, attach full soil description or specify the available information, e.g. soil type, soil PH/ acidity, Cation Exchange Capacity, nitrogen, salinity etc.
Soil fertility is medium
Soil drainage/infiltration is good
Soil water storage capacity is high
5.6 Characteristics of land users applying the Technology
Market orientation of production system:
- commercial/ market
Off-farm income:
- 10-50% of all income
Relative level of wealth:
- average
Level of mechanization:
- mechanized/ motorized
Indicate other relevant characteristics of the land users:
Population density: 10-50 persons/km2
Annual population growth: 1% - 2%
50% of the land users are rich and own 60% of the land.
50% of the land users are average wealthy and own 40% of the land.
Off-farm income specification: The time saved by practising non-inversion tillage (52 minutes/ha) allows the land manager to undertake contracted work on other farms
5.7 Average area of land owned or leased by land users applying the Technology
- < 0.5 ha
- 0.5-1 ha
- 1-2 ha
- 2-5 ha
- 5-15 ha
- 15-50 ha
- 50-100 ha
- 100-500 ha
- 500-1,000 ha
- 1,000-10,000 ha
- > 10,000 ha
Comments:
250 ha of cultivated arable land
5.8 Land ownership, land use rights, and water use rights
- Trust
- Trust
- Trust
6. Impacts and concluding statements
6.1 On-site impacts the Technology has shown
Socio-economic impacts
Production
crop production
Comments/ specify:
In good (weather) conditions, yields from ploughed fields often better
Income and costs
farm income
Other socio-economic impacts
timeliness of operations
Comments/ specify:
Speed of working allows larger acreage to be managed
Input constraints
Comments/ specify:
herbicide resistance is increasing in a number of weed species therefore a better range of herbicide options required
Window of operation
Comments/ specify:
Can be more narrow than when ploughing
Ecological impacts
Water cycle/ runoff
excess water drainage
Comments/ specify:
Better infiltration of water
Soil
soil moisture
Comments/ specify:
Better germination in dry years
soil cover
Comments/ specify:
Crop residue
soil loss
Quantity before SLM:
0.01
Quantity after SLM:
0
Comments/ specify:
Better soil structure
Other ecological impacts
Maintenance of rural employment
Comments/ specify:
enabled the farm to just about support the land manager and farm worker
Soil fertility
Comments/ specify:
Higher organic matter levels
Biodiversity enhancement
Comments/ specify:
Higher bird and invertebrate numbers
6.2 Off-site impacts the Technology has shown
reliable and stable stream flows in dry season
downstream flooding
downstream siltation
groundwater/ river pollution
Comments/ specify:
Fertilisers and pesticides not transported with eroded soil, better soil structure + biodiversity slow + improve metabolism of chemicals in the soil
6.4 Cost-benefit analysis
How do the benefits compare with the establishment costs (from land users’ perspective)?
Short-term returns:
slightly negative
Long-term returns:
slightly positive
How do the benefits compare with the maintenance/ recurrent costs (from land users' perspective)?
Short-term returns:
neutral/ balanced
Long-term returns:
neutral/ balanced
6.5 Adoption of the Technology
Of all those who have adopted the Technology, how many have did so spontaneously, i.e. without receiving any material incentives/ payments?
- 90-100%
Comments:
100% of land user families have adopted the Technology without any external material support
1 land user families have adopted the Technology without any external material support
Comments on spontaneous adoption: survey results
There is a little trend towards spontaneous adoption of the Technology
Comments on adoption trend: Currently 40% of UK farmers practice non-inversion tillage mainly for economic reasons
6.7 Strengths/ advantages/ opportunities of the Technology
| Strengths/ advantages/ opportunities in the land user’s view |
|---|
|
Timely crop establishment + good work rate How can they be sustained / enhanced? good planning |
|
Lower costs How can they be sustained / enhanced? Increased acreage to spread costs |
|
Increased contractor income How can they be sustained / enhanced? as above |
|
improved soil structure - higher organic matter and provision of a better seed bed to drill into How can they be sustained / enhanced? continue with practice |
| Strengths/ advantages/ opportunities in the compiler’s or other key resource person’s view |
|---|
|
cost effectiveness How can they be sustained / enhanced? increase ares under cultivation (economy of scale) |
| increased work rate |
|
improved soil quality How can they be sustained / enhanced? continuation of current soil management principles |
|
increased biodiversity How can they be sustained / enhanced? price premium for biodiversity-friendly products |
|
improved water quality How can they be sustained / enhanced? no option. The EU Water Framework Directive requires watercourses to be of good status by 2015 |
6.8 Weaknesses/ disadvantages/ risks of the Technology and ways of overcoming them
| Weaknesses/ disadvantages/ risks in the land user’s view | How can they be overcome? |
|---|---|
| narrow weather window | drill non-inversion tillage fields first |
| grass weeds | crop rotation; new herbicide modes of action |
| slug management | monitoring slug populations |
| large acreage required to justify cost of machinery | consider not cropping headlands |
| Weaknesses/ disadvantages/ risks in the compiler’s or other key resource person’s view | How can they be overcome? |
|---|---|
| Grass weed control | New herbicide modes of action, more integrated management options |
| Untidy appearance of field (due to crop residue) | Familiarity with the technology |
7. References and links
7.2 References to available publications
Title, author, year, ISBN:
Guide to managing crop establishment, SMI
Available from where? Costs?
www.smi.org.uk
Title, author, year, ISBN:
Improved soil management for agronomic and environmental gain, SMI
Available from where? Costs?
www.smi.org.uk
Title, author, year, ISBN:
ECAF website
Available from where? Costs?
www.sowap.org
Links and modules
Expand all Collapse allLinks

Participatory on-farm demonstration in UK arable cropping: Loddington [United Kingdom]
Provision of expert knowledge in appropriating equipment and setting up small scale on farm trials in collaboration with the land manager
- Compiler: Ceris A. Jones
Modules
No modules


