Maintenance of forest cover in headwaters [Belgium]
- Creation:
- Update:
- Compiler: Marie Anne Eurie Forio
- Editor: –
- Reviewers: William Critchley, Rima Mekdaschi Studer
Maintien de la couverture forestière dans les eaux d'amont
technologies_5925 - Belgium
View sections
Expand all Collapse all1. General information
1.2 Contact details of resource persons and institutions involved in the assessment and documentation of the Technology
Key resource person(s)
land user:
Pahaut Bastien
Contrat de Riviere Lesse
Belgium
Name of project which facilitated the documentation/ evaluation of the Technology (if relevant)
OPtimal strategies to retAIN and re-use water and nutrients in small agricultural catchments across different soil-climatic regions in Europe (OPTAIN)Name of the institution(s) which facilitated the documentation/ evaluation of the Technology (if relevant)
Ghent University (UGent) - Belgium1.3 Conditions regarding the use of data documented through WOCAT
The compiler and key resource person(s) accept the conditions regarding the use of data documented through WOCAT:
Yes
1.4 Declaration on sustainability of the described Technology
Is the Technology described here problematic with regard to land degradation, so that it cannot be declared a sustainable land management technology?
No
2. Description of the SLM Technology
2.1 Short description of the Technology
Definition of the Technology:
Forests in headwater areas benefit water quality and hydrologic cycling. Furthermore, maintaining and restoring the forest cover in headwater catchments offers other, multiple benefits such as increased soil water retention, intercepted pollution pathways, improved soil, maintained biodiversity and captured carbon dioxide.
2.2 Detailed description of the Technology
Description:
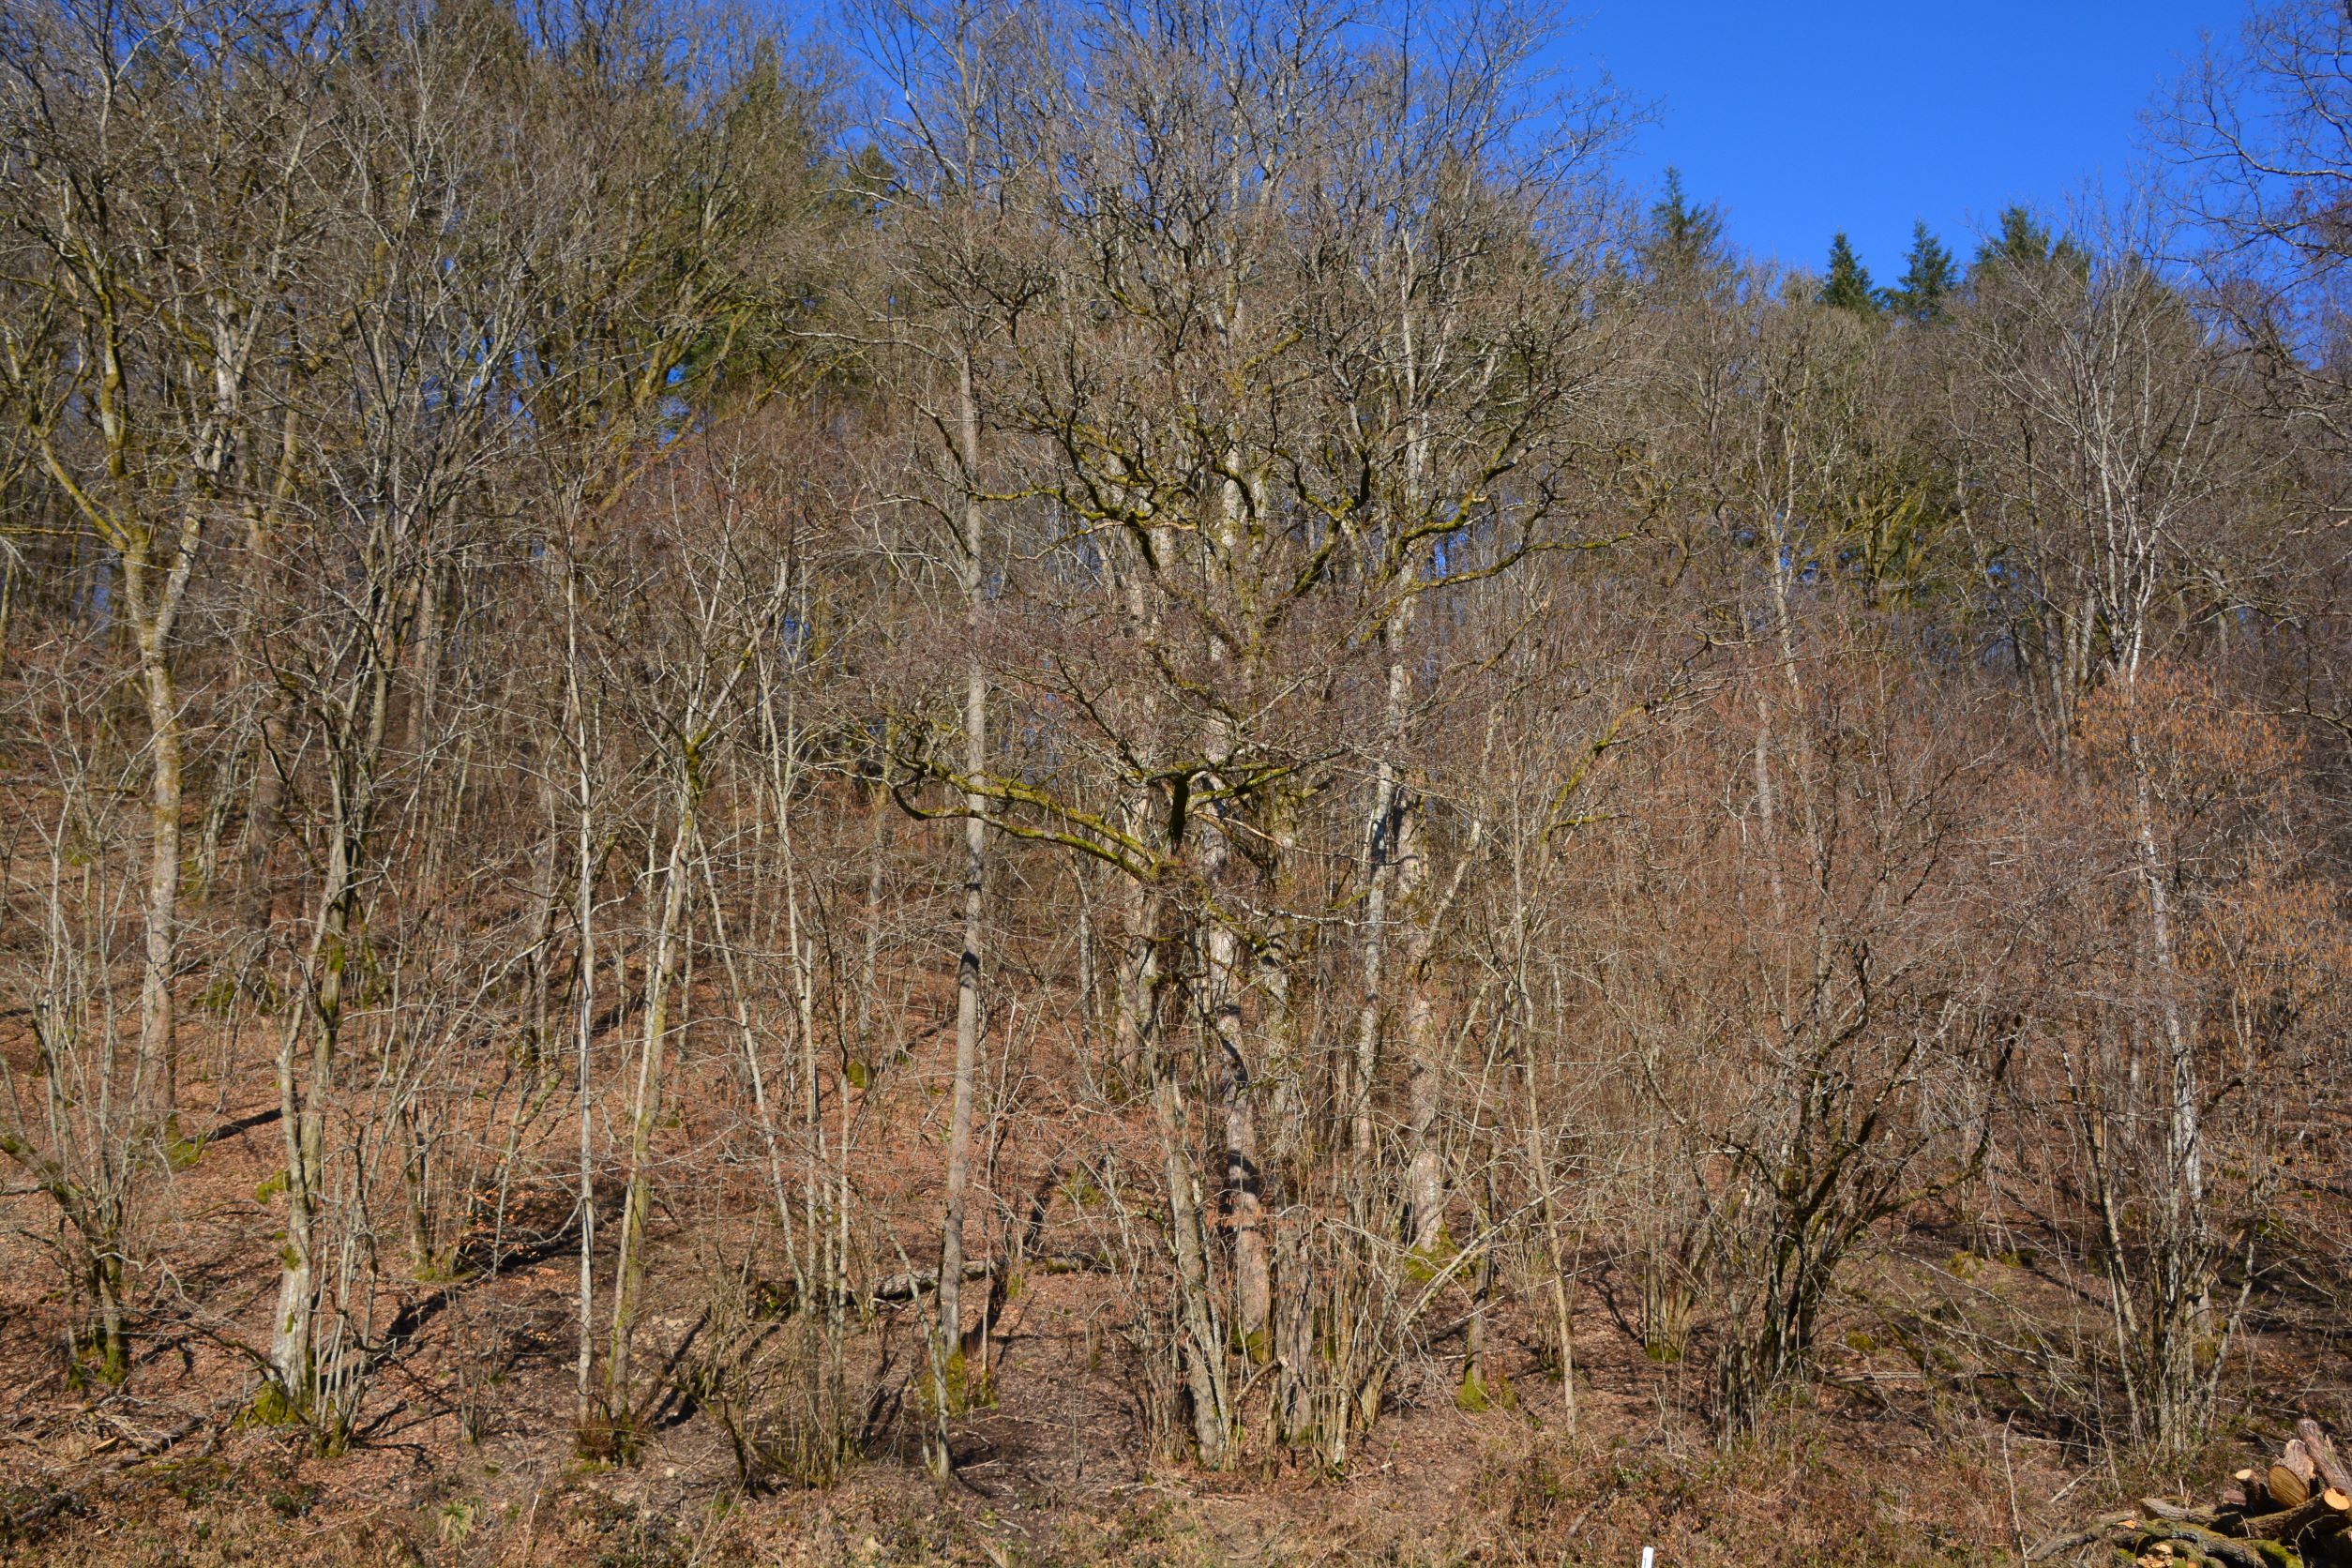
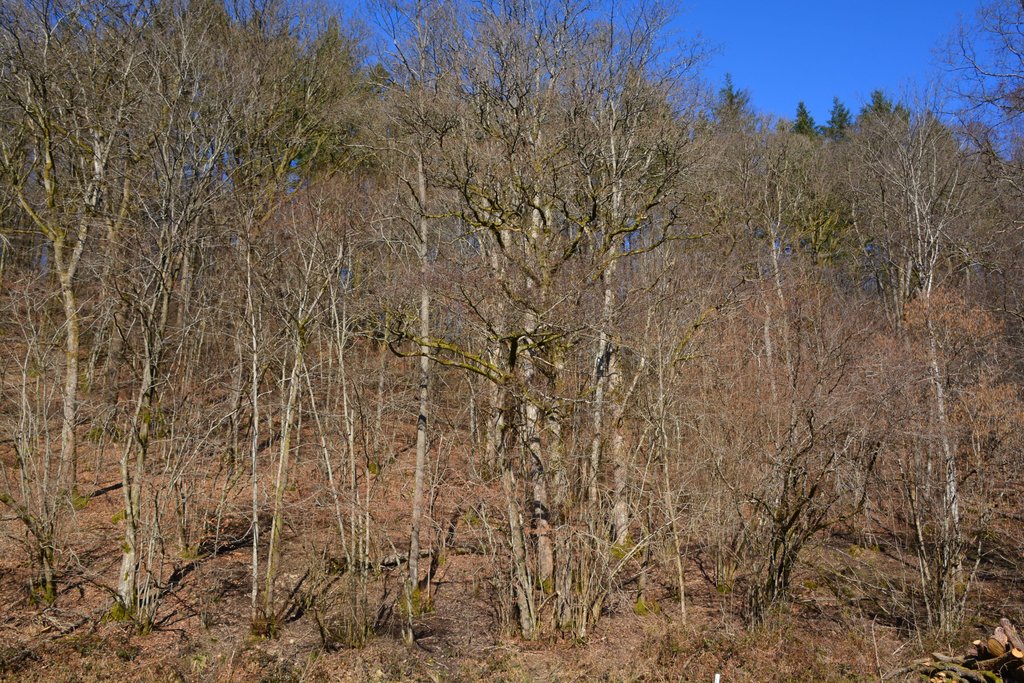
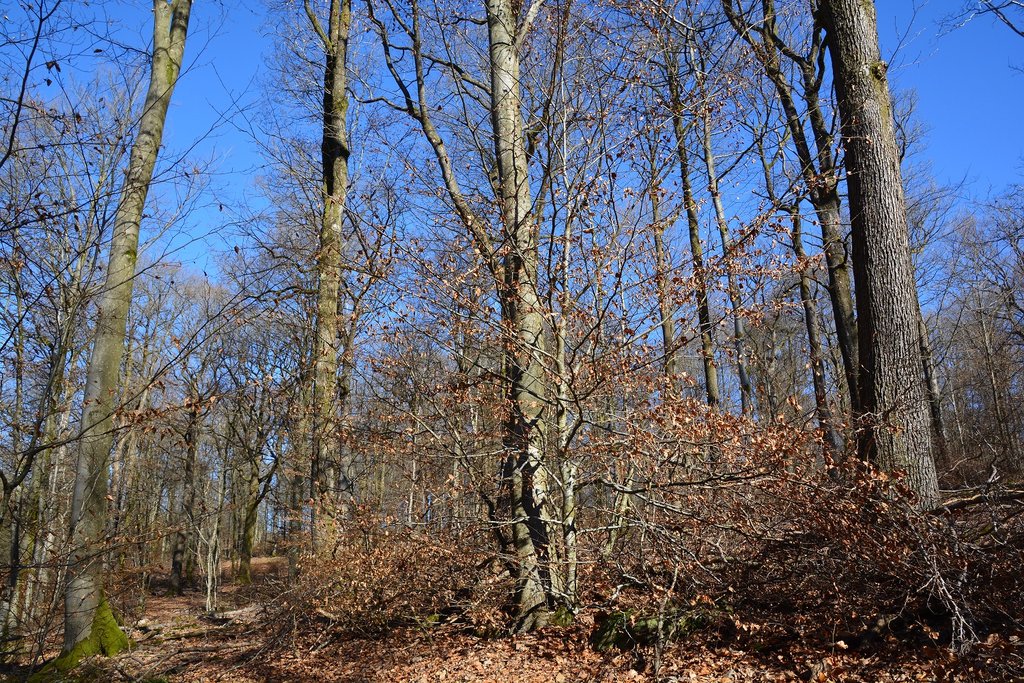
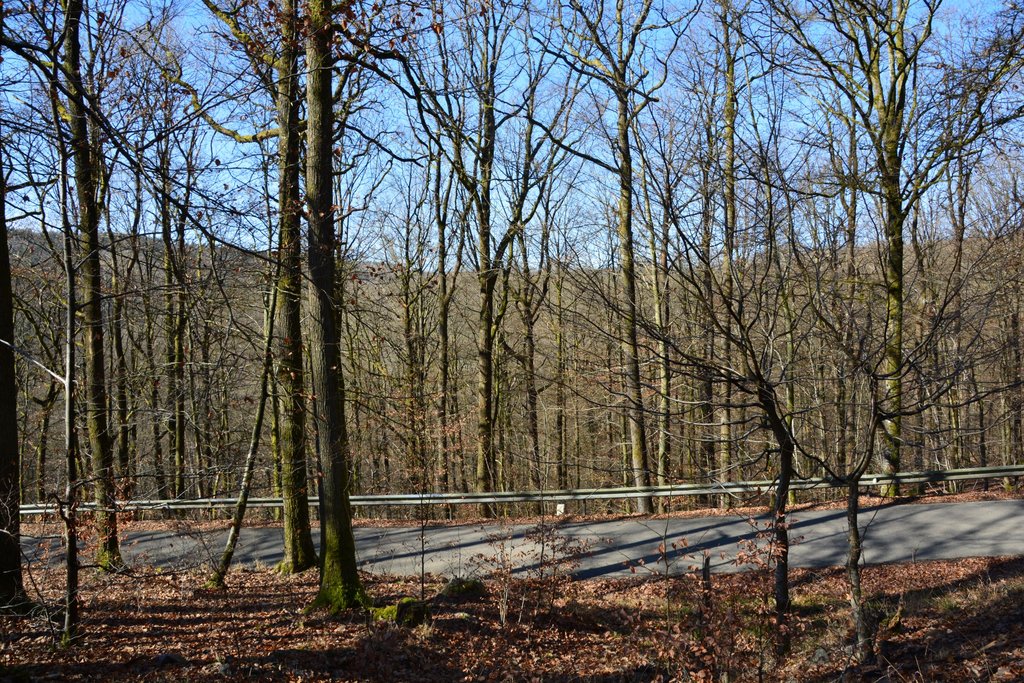
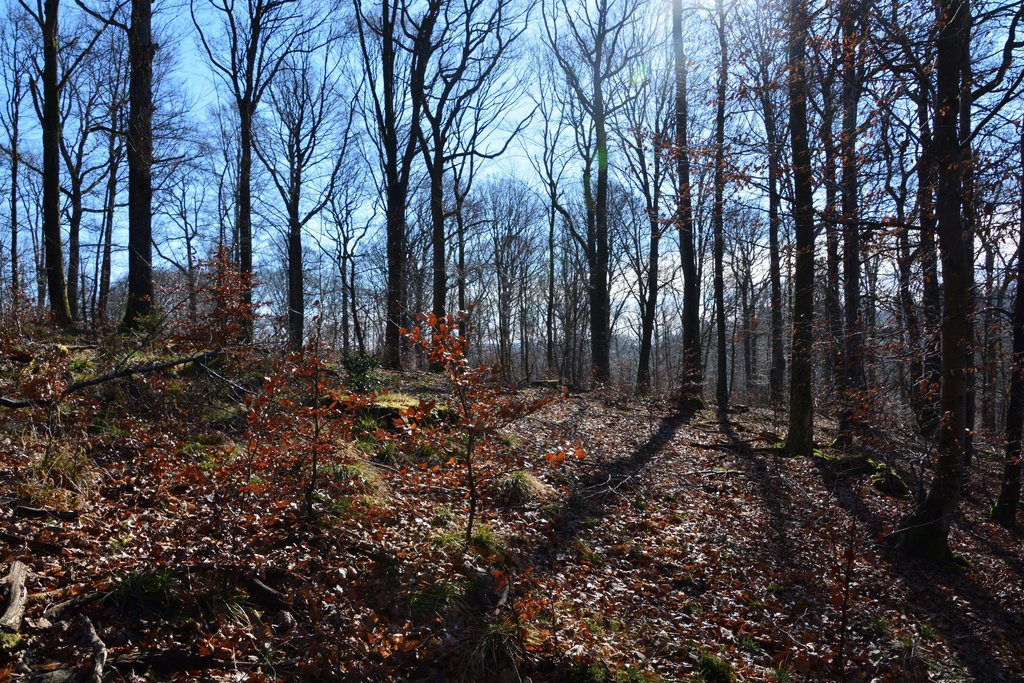
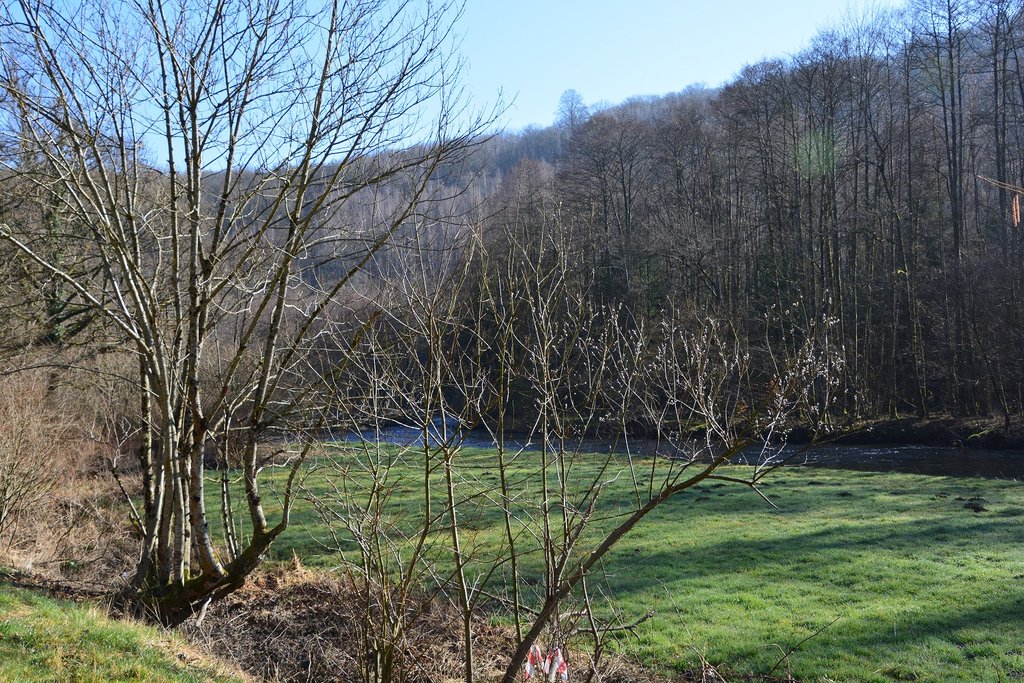
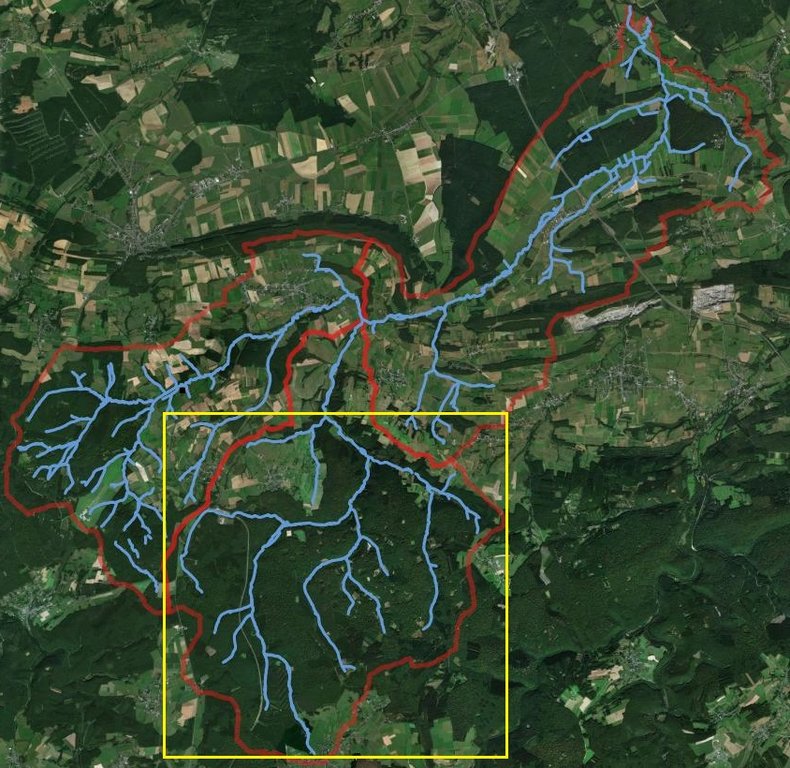
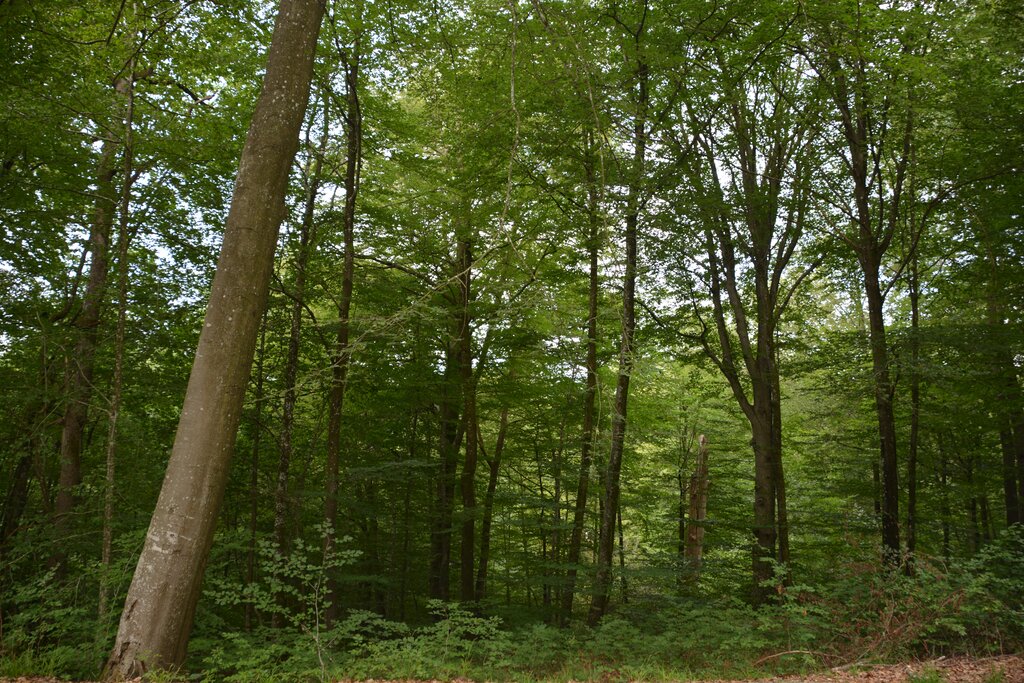
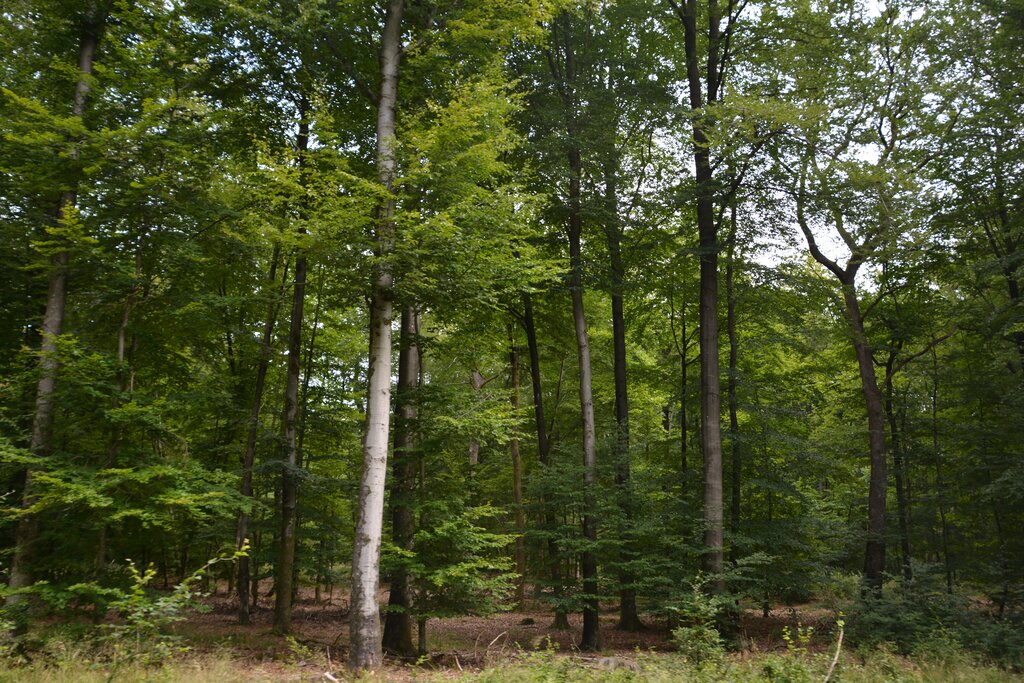
Forest cover is carefully maintained in the headwater areas of the Wimbe catchment in Belgium. The upstream (headwater) forest covers about 30% of the overall catchment area, which has a total drainage area of 93 sq. km. The trees found in the forest are mainly deciduous species such as oak, linden, birch and beech. A few evergreens/coniferous trees also grow in the area. However, in some parts of the forest, these coniferous trees are being removed/eliminated and replanted with native deciduous species. Furthermore, there is targeted control and removal of damaging invasive alien plants such as Himalayan balsam (Impatiens glandulifera). The forest in the headwater areas provides multiple benefits. First, it enhances water quality as well as regulating the flow regime and hydrological cycling, thereby providing drinking water ecosystem services. Forest soils generally have good infiltration capacity, capturing rainfall, as well as water caught by the canopy and later dripping from the leaves or flowing down the stem. The soils slowly release the rainwater captured, limiting or preventing runoff, and decelerating the rate at which the runoff water travels: maintaining forests is therefore considered to be a retention measure. Forests, in general, also increase evapotranspiration and canopy interception, which contributes to reducing runoff, and increasing precipitation recycling. Furthermore, the forest floor and its soils are generally high in organic matter content, which enhances soil-water retention. Forests also reduce pollutant runoff such as metals and organic contaminants as these pollutants are tightly bound to the organic matter in forest soils. Forest cover can significantly reduce erosion through the dense organic mat which is more resistant to erosion than exposed soils. On top of that, the forest greatly contributes to biodiversity preservation both above ground in growing and decaying vegetation, and within the soil also. Forests capture atmospheric carbon through their growth and associated utilisation of carbon dioxide. Carbon is then held in the wood, but also in the forest floor and in the organic matter-rich soil. The forest provides for tourism and aesthetic values which improves human well-being not only for the local people but also for visitors from outsider.
2.3 Photos of the Technology
2.4 Videos of the Technology
Comments, short description:
None
2.5 Country/ region/ locations where the Technology has been applied and which are covered by this assessment
Country:
Belgium
Region/ State/ Province:
Wallonie
Further specification of location:
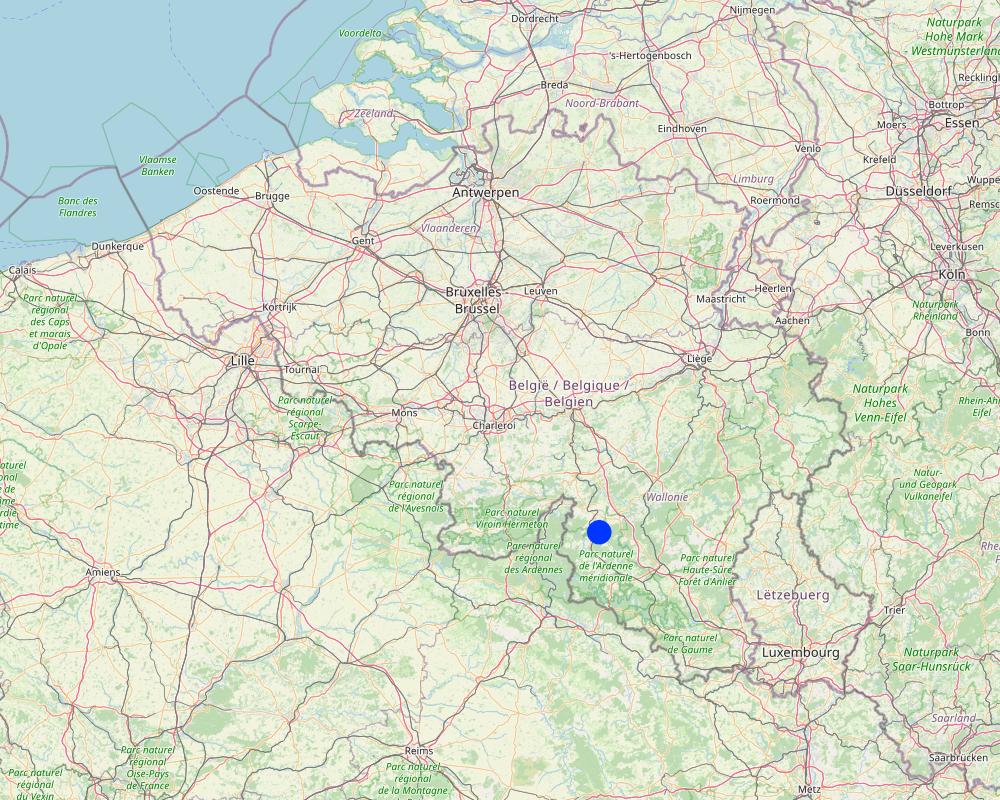
Daverdisse, Wellin
Specify the spread of the Technology:
- evenly spread over an area
If precise area is not known, indicate approximate area covered:
- 10-100 km2
Is/are the technology site(s) located in a permanently protected area?
Yes
If yes, specify:
Many parts of the forest are Natura2000 sites.
Map
×2.6 Date of implementation
If precise year is not known, indicate approximate date:
- more than 50 years ago (traditional)
2.7 Introduction of the Technology
Specify how the Technology was introduced:
- through land users' innovation
- as part of a traditional system (> 50 years)
- through projects/ external interventions
Comments (type of project, etc.):
The area is originally a forest.
3. Classification of the SLM Technology
3.1 Main purpose(s) of the Technology
- reduce, prevent, restore land degradation
- conserve ecosystem
- protect a watershed/ downstream areas – in combination with other Technologies
- preserve/ improve biodiversity
- mitigate climate change and its impacts
3.2 Current land use type(s) where the Technology is applied
Forest/ woodlands
- (Semi-)natural forests/ woodlands
(Semi-)natural forests/ woodlands: Specify management type:
- Dead wood/ prunings removal
- Non-wood forest use
Are the trees specified above deciduous or evergreen?
- mixed deciduous/ evergreen
Products and services:
- Timber
- Fruits and nuts
- Other forest products
- Nature conservation/ protection
- Recreation/ tourism
- Protection against natural hazards
3.3 Has land use changed due to the implementation of the Technology?
Has land use changed due to the implementation of the Technology?
- No (Continue with question 3.4)
3.4 Water supply
Water supply for the land on which the Technology is applied:
- rainfed
3.5 SLM group to which the Technology belongs
- natural and semi-natural forest management
- forest plantation management
3.6 SLM measures comprising the Technology
management measures
- M3: Layout according to natural and human environment
- M5: Control/ change of species composition
3.7 Main types of land degradation addressed by the Technology
biological degradation
- Bc: reduction of vegetation cover
- Bh: loss of habitats
- Bs: quality and species composition/ diversity decline
3.8 Prevention, reduction, or restoration of land degradation
Specify the goal of the Technology with regard to land degradation:
- prevent land degradation
4. Technical specifications, implementation activities, inputs, and costs
4.1 Technical drawing of the Technology
Technical specifications (related to technical drawing):
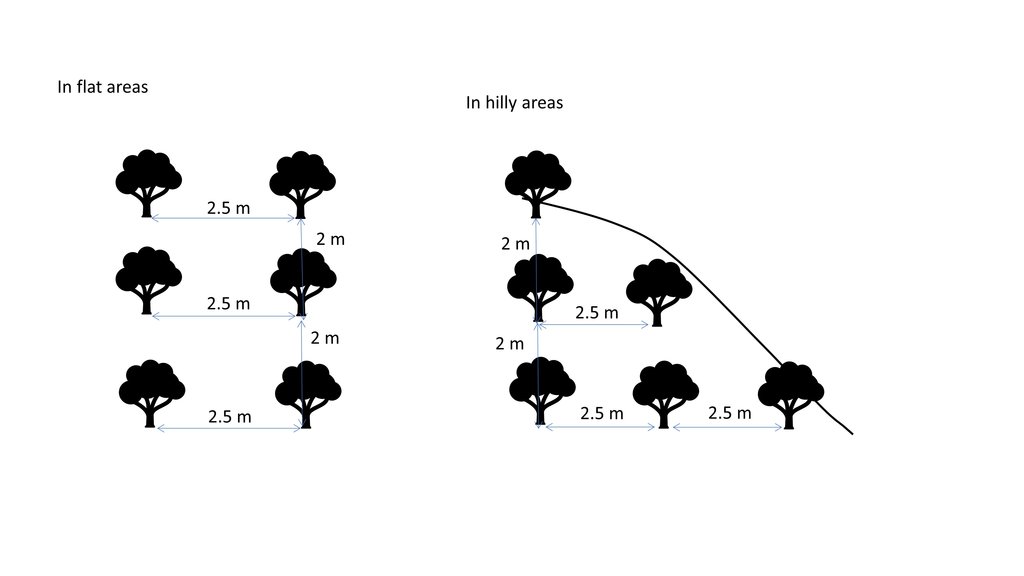
The figure represent the suggested distance between trees when planting trees in hilly and flat terrain.
4.2 General information regarding the calculation of inputs and costs
Specify how costs and inputs were calculated:
- per Technology area
Indicate size and area unit:
0.01 sq. km (1 ha)
other/ national currency (specify):
Euro
If relevant, indicate exchange rate from USD to local currency (e.g. 1 USD = 79.9 Brazilian Real): 1 USD =:
1.0
Indicate average wage cost of hired labour per day:
280
4.3 Establishment activities
Comments:
Additional information can be found in http://biodiversite.wallonie.be/fr/c-actions-de-restauration.html?IDC=6382
4.4 Costs and inputs needed for establishment
| Specify input | Unit | Quantity | Costs per Unit | Total costs per input | % of costs borne by land users | |
|---|---|---|---|---|---|---|
| Labour | Planting trees | person-day | 27.0 | 280.0 | 7560.0 | 100.0 |
| Plant material | Tree seedlings | pcs | 2000.0 | 2.0 | 4000.0 | |
| Total costs for establishment of the Technology | 11560.0 | |||||
| Total costs for establishment of the Technology in USD | 11560.0 | |||||
If land user bore less than 100% of costs, indicate who covered the remaining costs:
From subsidies
Comments:
Depending on the tree species, tree seedling can range from 1USD to 2.5 USD (Given 1 USD=1Euro)
4.5 Maintenance/ recurrent activities
| Activity | Timing/ frequency | |
|---|---|---|
| 1. | Targeted control of invasive alien plants | once or twice a year |
| 2. | Elimination of isolated softwoods (conifers) | |
| 3. | Clearing of forest clearings | |
| 4. | Planting of native hardwood (deciduous trees), with or without protections |
Comments:
https://biodiversite.wallonie.be/fr/c-actions-de-restauration.html?IDC=6382
4.6 Costs and inputs needed for maintenance/ recurrent activities (per year)
Comments:
If the tree seedling dies, then it will have to be replanted again.
4.7 Most important factors affecting the costs
Describe the most determinate factors affecting the costs:
The replanting of trees, in general, and in particular eliminating softwoods (coniferous) and replanting of hardwoods (deciduous).
5. Natural and human environment
5.1 Climate
Annual rainfall
- < 250 mm
- 251-500 mm
- 501-750 mm
- 751-1,000 mm
- 1,001-1,500 mm
- 1,501-2,000 mm
- 2,001-3,000 mm
- 3,001-4,000 mm
- > 4,000 mm
Agro-climatic zone
- sub-humid
5.2 Topography
Slopes on average:
- flat (0-2%)
- gentle (3-5%)
- moderate (6-10%)
- rolling (11-15%)
- hilly (16-30%)
- steep (31-60%)
- very steep (>60%)
Landforms:
- plateau/plains
- ridges
- mountain slopes
- hill slopes
- footslopes
- valley floors
Altitudinal zone:
- 0-100 m a.s.l.
- 101-500 m a.s.l.
- 501-1,000 m a.s.l.
- 1,001-1,500 m a.s.l.
- 1,501-2,000 m a.s.l.
- 2,001-2,500 m a.s.l.
- 2,501-3,000 m a.s.l.
- 3,001-4,000 m a.s.l.
- > 4,000 m a.s.l.
Indicate if the Technology is specifically applied in:
- not relevant
5.3 Soils
Soil depth on average:
- very shallow (0-20 cm)
- shallow (21-50 cm)
- moderately deep (51-80 cm)
- deep (81-120 cm)
- very deep (> 120 cm)
Soil texture (topsoil):
- medium (loamy, silty)
Soil texture (> 20 cm below surface):
- medium (loamy, silty)
Topsoil organic matter:
- medium (1-3%)
5.4 Water availability and quality
Ground water table:
5-50 m
Availability of surface water:
good
Water quality (untreated):
poor drinking water (treatment required)
Water quality refers to:
both ground and surface water
Is water salinity a problem?
No
Is flooding of the area occurring?
Yes
Regularity:
episodically
5.5 Biodiversity
Species diversity:
- medium
Habitat diversity:
- medium
Comments and further specifications on biodiversity:
Observations suggest a notable reduction in biodiversity and a decline in forest health over the past few decades, largely driven by forestry and hunting practices that do not always support forest resilience, along with the impacts of climate change and pest and pathogen outbreaks
5.6 Characteristics of land users applying the Technology
Sedentary or nomadic:
- Sedentary
Market orientation of production system:
- commercial/ market
Relative level of wealth:
- average
Individuals or groups:
- individual/ household
- groups/ community
Level of mechanization:
- manual work
- mechanized/ motorized
Gender:
- women
- men
Age of land users:
- middle-aged
- elderly
5.7 Average area of land used by land users applying the Technology
- < 0.5 ha
- 0.5-1 ha
- 1-2 ha
- 2-5 ha
- 5-15 ha
- 15-50 ha
- 50-100 ha
- 100-500 ha
- 500-1,000 ha
- 1,000-10,000 ha
- > 10,000 ha
Is this considered small-, medium- or large-scale (referring to local context)?
- small-scale
5.8 Land ownership, land use rights, and water use rights
Land ownership:
- state
- individual, titled
Land use rights:
- communal (organized)
- individual
Water use rights:
- communal (organized)
Are land use rights based on a traditional legal system?
Yes
Comments:
Land ownership here applies to the single sites.
5.9 Access to services and infrastructure
health:
- poor
- moderate
- good
education:
- poor
- moderate
- good
technical assistance:
- poor
- moderate
- good
employment (e.g. off-farm):
- poor
- moderate
- good
markets:
- poor
- moderate
- good
energy:
- poor
- moderate
- good
roads and transport:
- poor
- moderate
- good
drinking water and sanitation:
- poor
- moderate
- good
financial services:
- poor
- moderate
- good
6. Impacts and concluding statements
6.1 On-site impacts the Technology has shown
Socio-economic impacts
Production
forest/ woodland quality
Comments/ specify:
Forest provide wood products (Verkerk et al., 2015)
Pieter J. Verkerk, Christian Levers, Tobias Kuemmerle, Marcus Lindner, Ruben Valbuena, Peter H. Verburg, Sergey Zudin, Mapping wood production in European forests, Forest Ecology and Management Volume 357, 2015, pages 228-238,ISSN 0378-1127, https://doi.org/10.1016/j.foreco.2015.08.007
Water availability and quality
drinking water availability
drinking water quality
Comments/ specify:
Healthy forest provide various ecosystem services such as drinking water production as they can filter out water pollution, regulate stream flows, recharge aquifers, and absorb flooding (Jenkins and Schaap, 2018).
Reference:
Jenkins, M., & Schaap, B. (2018). Forest ecosystem services. Background analytical study, 1.
Socio-cultural impacts
health situation
land use/ water rights
cultural opportunities
recreational opportunities
Comments/ specify:
Forests provide recreation opportunities through tourism improving the health and well being of humans.
SLM/ land degradation knowledge
Comments/ specify:
Forest prevents land degradation ( (Jenkins and Schaap, 2018).
Reference:
Jenkins, M., & Schaap, B. (2018). Forest ecosystem services. Background analytical study, 1.
Ecological impacts
Water cycle/ runoff
water quantity
water quality
surface runoff
Soil
soil moisture
soil cover
soil loss
soil organic matter/ below ground C
Biodiversity: vegetation, animals
Vegetation cover
biomass/ above ground C
plant diversity
animal diversity
beneficial species
habitat diversity
Comments/ specify:
Forest supports biodiversity
Climate and disaster risk reduction
landslides/ debris flows
drought impacts
emission of carbon and greenhouse gases
micro-climate
6.2 Off-site impacts the Technology has shown
water availability
reliable and stable stream flows in dry season
downstream flooding
Comments/ specify:
Decrease in downstream flooding is a positive thing
downstream siltation
groundwater/ river pollution
buffering/ filtering capacity
impact of greenhouse gases
6.3 Exposure and sensitivity of the Technology to gradual climate change and climate-related extremes/ disasters (as perceived by land users)
Gradual climate change
Gradual climate change
| Season | increase or decrease | How does the Technology cope with it? | |
|---|---|---|---|
| seasonal rainfall | winter | increase | very well |
Climate-related extremes (disasters)
Climatological disasters
| How does the Technology cope with it? | |
|---|---|
| extreme winter conditions | well |
| drought | well |
Hydrological disasters
| How does the Technology cope with it? | |
|---|---|
| general (river) flood | well |
6.4 Cost-benefit analysis
How do the benefits compare with the establishment costs (from land users’ perspective)?
Short-term returns:
positive
Long-term returns:
very positive
How do the benefits compare with the maintenance/ recurrent costs (from land users' perspective)?
Short-term returns:
positive
Long-term returns:
very positive
6.5 Adoption of the Technology
- 1-10%
6.6 Adaptation
Has the Technology been modified recently to adapt to changing conditions?
No
6.7 Strengths/ advantages/ opportunities of the Technology
| Strengths/ advantages/ opportunities in the compiler’s or other key resource person’s view |
|---|
| Enhances biodiversity. |
| Promotes tourism |
| Maintains good water and air quality |
6.8 Weaknesses/ disadvantages/ risks of the Technology and ways of overcoming them
| Weaknesses/ disadvantages/ risks in the compiler’s or other key resource person’s view | How can they be overcome? |
|---|---|
| Land not used for farming agricultural crops. |
7. References and links
7.1 Methods/ sources of information
- field visits, field surveys
2
- interviews with land users
1
- interviews with SLM specialists/ experts
1
- compilation from reports and other existing documentation
3
When were the data compiled (in the field)?
15/02/2022
7.2 References to available publications
Title, author, year, ISBN:
No related publications
7.3 Links to relevant online information
Title/ description:
Individual NWRM Maintenance of forest cover in headwater areas
URL:
http://nwrm.eu/sites/default/files/nwrm_ressources/f2_-_maintenance_of_forest_cover_in_headwater_areas_0.pdf
Title/ description:
Restore Actions
URL:
http://biodiversite.wallonie.be/fr/c-actions-de-restauration.html?IDC=6382
7.4 General comments
The database provide interesting information.
Just comment on the questionnaire. Some questions does not use the same units all throughout, for example in some case it uses km2, sometimes hectare. Maybe better that it will be consistent?
Response: Thanks. I have changed the ha unit into sq. km.
Links and modules
Expand all Collapse allLinks
No links
Modules
No modules


