Agroforestry and Reforestation for Improved Livelihoods and Ecosystem Services [Indonesia]
- Creation:
- Update:
- Compiler: Siti Indriani
- Editor: –
- Reviewers: William Critchley, Rima Mekdaschi Studer
Tree Planting or Agroforestry
technologies_7142 - Indonesia
View sections
Expand all Collapse all1. General information
1.2 Contact details of resource persons and institutions involved in the assessment and documentation of the Technology
Name of project which facilitated the documentation/ evaluation of the Technology (if relevant)
Land Use Based Mitigation for Resilient Climate Pathways (LANDMARC)Name of the institution(s) which facilitated the documentation/ evaluation of the Technology (if relevant)
Sustainability & Resilience company (su-re.co) - Indonesia1.3 Conditions regarding the use of data documented through WOCAT
The compiler and key resource person(s) accept the conditions regarding the use of data documented through WOCAT:
Yes
1.4 Declaration on sustainability of the described Technology
Is the Technology described here problematic with regard to land degradation, so that it cannot be declared a sustainable land management technology?
No
Comments:
It can be declared a sustainable land management technology
2. Description of the SLM Technology
2.1 Short description of the Technology
Definition of the Technology:
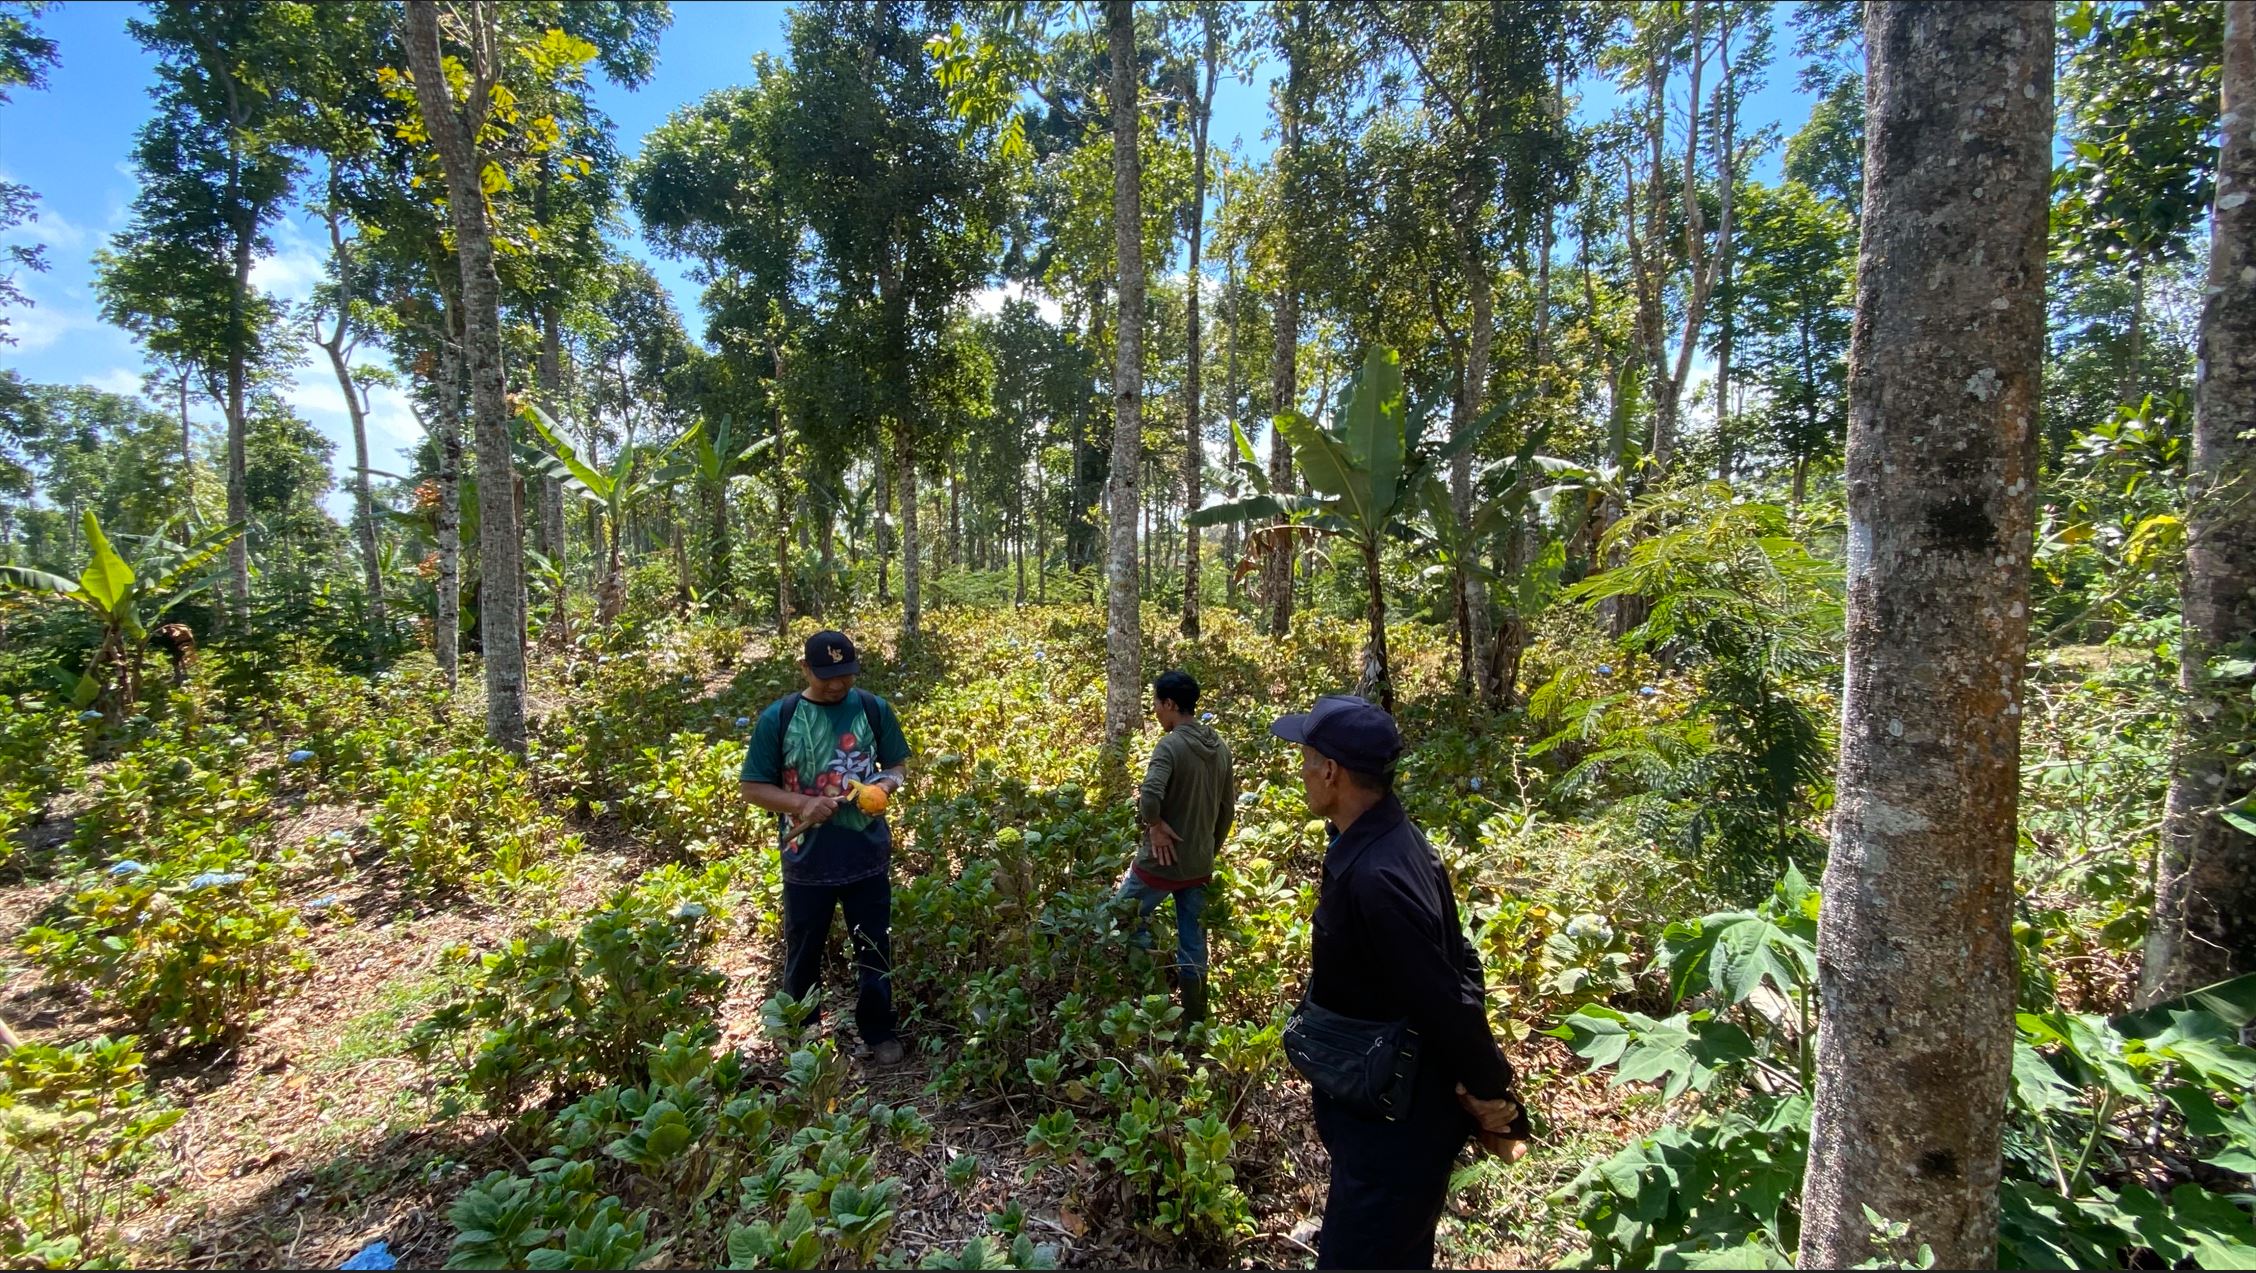
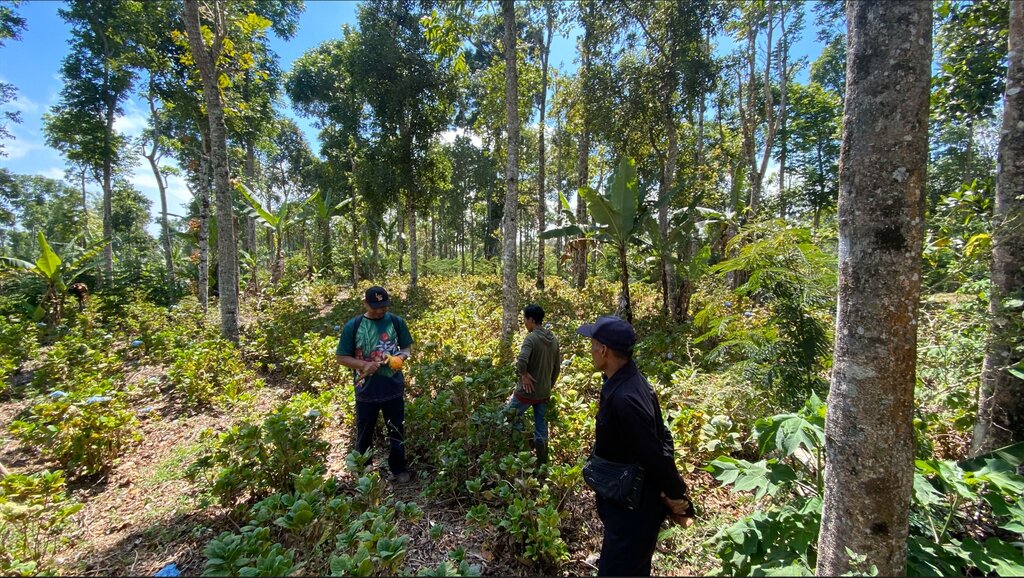
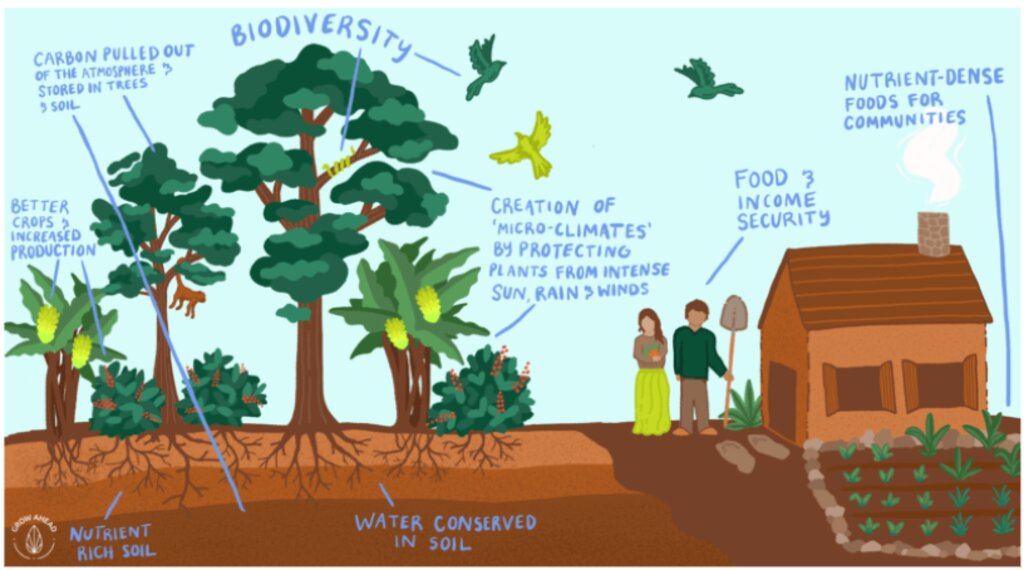
Approximately 20,000 hectares of degraded land is being rehabilitated land using assisted natural regeneration, enrichment planting and agroforestry. The resultant secondary forests and agroforests will have high values for ecotourism, sequester substantial amounts of carbon, produce a range of in-demand commodities (e.g., coffee, spices), generate bioenergy, and offer improved ecosystem services.
2.2 Detailed description of the Technology
Description:
A partnership of local communities and governments is, in collaboration with international and national development organizations, donors and investors, rehabilitating approximately 20,000 hectares of degraded forest and agricultural land using assisted natural regeneration, enrichment planting and agroforestry. The resultant secondary forests and agroforests will have high values for ecotourism, sequester substantial amounts of carbon, produce a range of in-demand commodities (e.g., coffee, spices), and generate bioenergy. They will also offer improved ecosystem services to Bali as a whole, which will be very valuable for the tourism industry, representing an opportunity for investment and payment for ecosystem services (PES).
In the first 20 hectares, around 1,600 trees were planted per hectare, consisting of Coffee Arabica Katimor and Local Avocado trees. In between, shrubs such as local cassava and root species already existed. The spacing followed recommendations from ICCRI (Indonesian Coffee and Cacao Research Institute) whereby 2-3 meters distance are placed in between coffee trees, with much further distances for the shade trees. For fertilization, local goat manure is primarily used and filled in the planting holes the size of 30cm x 30cm x 30cm.
Northeast Bali, Indonesia — which includes the Batur UNESCO Global Geopark — features approximately 135,000 ha of degraded land in the Government’s Forest Estate (‘Kawasan Hutan’), which is managed by the provincial government’s Forestry and Environment Agency (Dinas Kehutanan Dan Lingkungan Hidup Provinsi Bali/DKLH).
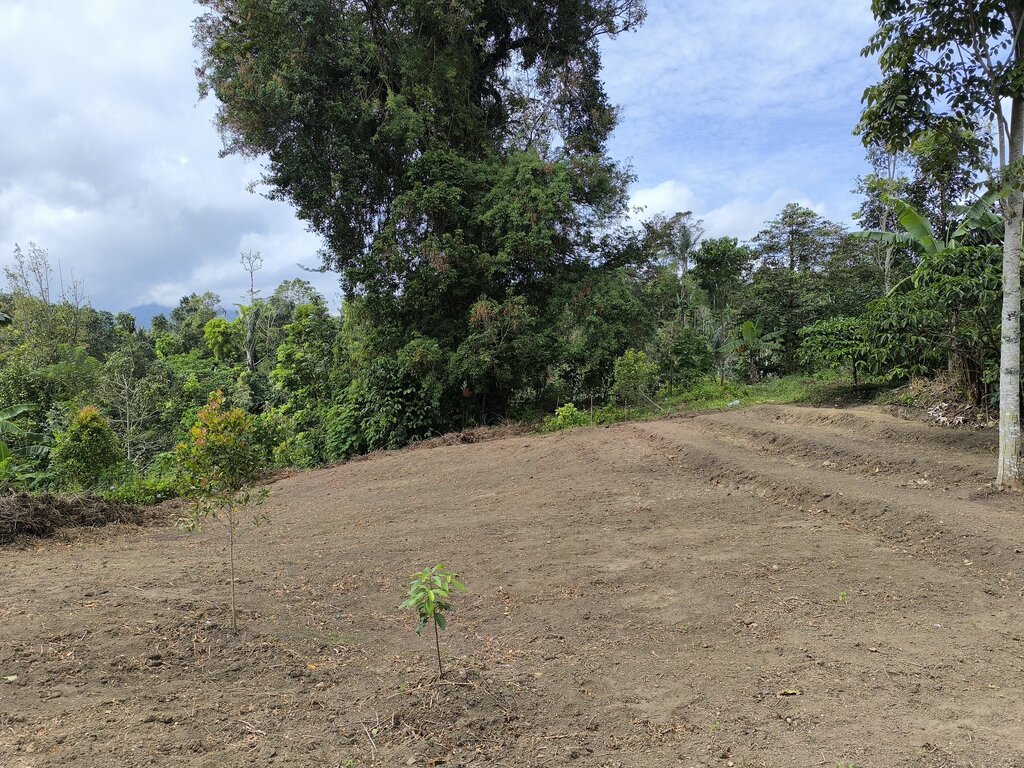
The vegetation, soils and water resources are designated as ‘potentially’ to ‘very severely’ degraded on 463,500 hectares. This is steadily increasing owing to unsustainable forestry and farming practices. Local communities within and surrounding the Kawasan Hutan — among the poorest in Bali — are affected by droughts, flash floods, landslides and poor water quality.
The Geopark in Northeast Bali was established in 2012 on the active volcanic landscape of Mt Batur, which features not only unique and dramatic geological formations, protected forests and endemic flora and fauna but also 15 villages. Approximately 90% of the Geopark is classified as severely degraded owing to a lack of post-eruption rehabilitation and unsustainable farming practices. The Geopark received almost one million visitors in 2019.
The ten-year project will be implemented by a consortium consisting of Sustainability and Resilience Co. (a local NGO), Indonesian government (through DKLH), local university (Udayana), international research-in-development organization (CIFOR-ICRAF), specialist national research organizations, intergovernmental organization, larger private sector and investment partners, each bringing a specific set of skills and expertise.
The work will be carried out through four major components.
1. Establishment of a coordinated enabling environment through a multistakeholder forum of local governments, national and provincial government agencies, communities, larger private sector and project consortium members.
2. Co-designing and co-implementing models of integrated ecosystem and livelihoods restoration that suit local socio-economic and environmental conditions with staged expansion over the ten years.
3. Training communities, local small businesses and Government staff in co-design, establishment and management of restored, productive ecosystems and value chains.
4. Strengthening and further introducing partnerships between the community, public and private sectors in all aspects of the landscape, including co-developing and co-implementing an enabling investment environment for continuing financial flows.
2.3 Photos of the Technology
2.4 Videos of the Technology
Comments, short description:
Degraded area in Wanagiri, Bali, as a pilot location
Date:
04/06/2024
Location:
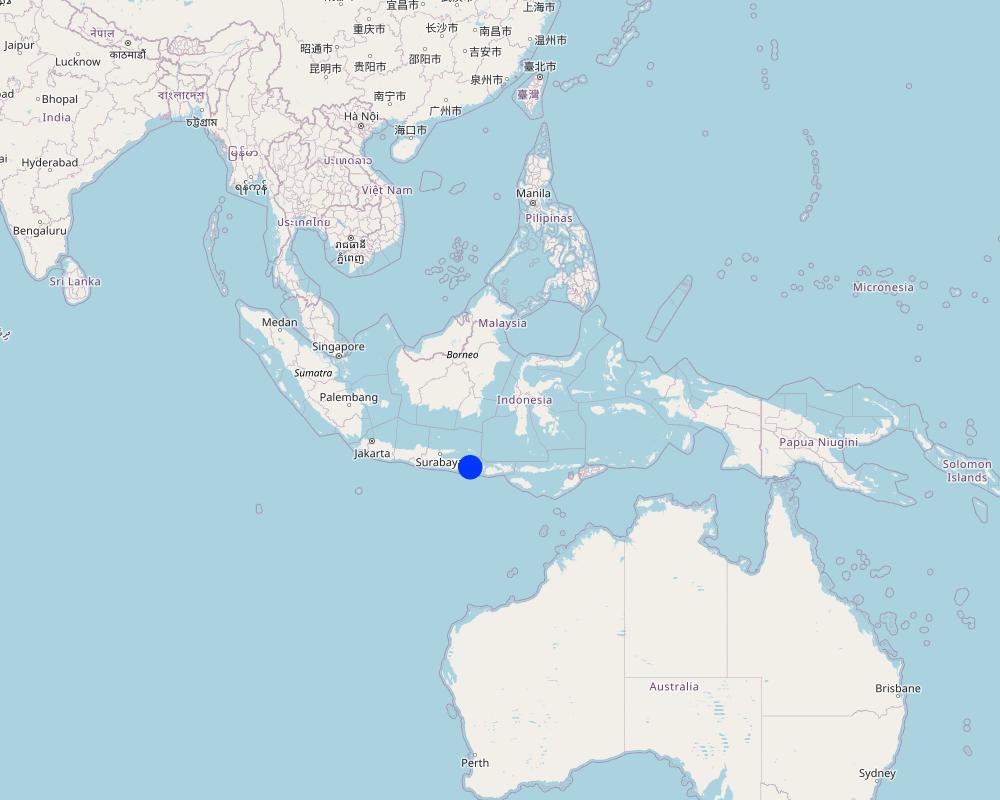
Wanagiri, Bali, Indonesia
Name of videographer:
Fabian Wiropranoto
2.5 Country/ region/ locations where the Technology has been applied and which are covered by this assessment
Country:
Indonesia
Region/ State/ Province:
Bali
Further specification of location:
Wanagiri, Northeast Bali
Specify the spread of the Technology:
- evenly spread over an area
If precise area is not known, indicate approximate area covered:
- 0.1-1 km2
Is/are the technology site(s) located in a permanently protected area?
Yes
If yes, specify:
Batur UNESCO Global Geopark
Comments:
Batur UNESCO Global Geopark
Map
×2.6 Date of implementation
Indicate year of implementation:
2024
If precise year is not known, indicate approximate date:
- less than 10 years ago (recently)
2.7 Introduction of the Technology
Specify how the Technology was introduced:
- through projects/ external interventions
Comments (type of project, etc.):
Training communities, local small businesses, and Government staff in the co-design, establishment, and management of restored, productive ecosystems and value chains.
3. Classification of the SLM Technology
3.1 Main purpose(s) of the Technology
- reduce, prevent, restore land degradation
- preserve/ improve biodiversity
- mitigate climate change and its impacts
- create beneficial economic impact
- create beneficial social impact
3.2 Current land use type(s) where the Technology is applied
Land use mixed within the same land unit:
Yes
Specify mixed land use (crops/ grazing/ trees):
- Agroforestry

Forest/ woodlands
- (Semi-)natural forests/ woodlands
(Semi-)natural forests/ woodlands: Specify management type:
- Shifting cultivation
Type of (semi-)natural forest:
- tropical mountain systems natural vegetation
Type of tree:
- Acacia species
- Leucaena leucocephala
- Swietenia macrophylla
Are the trees specified above deciduous or evergreen?
- evergreen
Products and services:
- Timber
- Fruits and nuts
- Nature conservation/ protection
- Recreation/ tourism
Comments:
Degraded or unproductive land in Wanagiri, Bali, Indonesia
3.3 Has land use changed due to the implementation of the Technology?
Has land use changed due to the implementation of the Technology?
- Yes (Please fill out the questions below with regard to the land use before implementation of the Technology)
Land use mixed within the same land unit:
Yes
Specify mixed land use (crops/ grazing/ trees):
- Agroforestry
Unproductive land
Specify:
Underutilized forest land
Comments:
Agroforestry
3.4 Water supply
Water supply for the land on which the Technology is applied:
- rainfed
3.5 SLM group to which the Technology belongs
- agroforestry
3.6 SLM measures comprising the Technology
agronomic measures
- A1: Vegetation/ soil cover
- A2: Organic matter/ soil fertility
- A5: Seed management, improved varieties
vegetative measures
- V1: Tree and shrub cover
- V3: Clearing of vegetation
- V5: Others
structural measures
- S6: Walls, barriers, palisades, fences
- S9: Shelters for plants and animals
management measures
- M1: Change of land use type
- M2: Change of management/ intensity level
Comments:
Agroforestry practices
3.7 Main types of land degradation addressed by the Technology
soil erosion by water
- Wt: loss of topsoil/ surface erosion

biological degradation
- Bc: reduction of vegetation cover
3.8 Prevention, reduction, or restoration of land degradation
Specify the goal of the Technology with regard to land degradation:
- restore/ rehabilitate severely degraded land
- adapt to land degradation
4. Technical specifications, implementation activities, inputs, and costs
4.1 Technical drawing of the Technology
Technical specifications (related to technical drawing):
In the first 20 hectares, around 1,600 trees were planted per hectare, consisting of coffee arabica Katimor and local avocado trees. In between, shrubs such as local cassava and root species already existed. The spacing followed recommendations from ICCRI (Indonesian Coffee and Cacao Research Institute) whereby 2-3 meters distance are placed in between coffee trees, with much further distances for the shade trees. For fertilization, local goat manure is primarily used and filled in the planting holes the size of 30cm x 30cm x 30cm
20 ha is the pilot area
Spacing between plants [m]
Avocado: 5x5
Coffee: 3x3
Vertical vegetative measures [m]
Avocado:
Coffee:
Lateral gradient of structures
Density of plants per ha
Avocado: 20
Coffee: 50
Author:
Bruno Bordoni
Date:
30/05/2024
4.2 General information regarding the calculation of inputs and costs
Specify how costs and inputs were calculated:
- per Technology area
Indicate size and area unit:
20 ha as the pilot case
If using a local area unit, indicate conversion factor to one hectare (e.g. 1 ha = 2.47 acres): 1 ha =:
1 ha = 2.47 acres
Specify currency used for cost calculations:
- USD
If relevant, indicate exchange rate from USD to local currency (e.g. 1 USD = 79.9 Brazilian Real): 1 USD =:
600.0
4.3 Establishment activities
| Activity | Timing (season) | |
|---|---|---|
| 1. | Survey | Month 1-2 |
| 2. | Stakeholders Engagement | Month 3-4 |
| 3. | Climate Field School | Month 4 |
| 4. | Nursing Establishment | Month 5-7 |
| 5. | Initial Tree Plantation | Month 8 |
| 6. | Fertilizing and Biocides | Month 8 |
| 7. | Maintenance | Month 9-12 |
| 8. | Tree Planting | Month 13 |
| 9. | Fertilizing and Biocides | Month 13 |
| 10. | Maintenance | Month 14-17 |
4.4 Costs and inputs needed for establishment
| Specify input | Unit | Quantity | Costs per Unit | Total costs per input | % of costs borne by land users | |
|---|---|---|---|---|---|---|
| Labour | Workers and Researchers | 1000 | 20.0 | 1000.0 | 20000.0 | |
| Plant material | Seedlings | 500 | 40.0 | 500.0 | 20000.0 | |
| Fertilizers and biocides | Organic fertilizer | 60 | 100.0 | 60.0 | 6000.0 | |
| Construction material | Nursery | 1000 | 14.0 | 1000.0 | 14000.0 | |
| Total costs for establishment of the Technology | 60000.0 | |||||
| Total costs for establishment of the Technology in USD | 100.0 | |||||
If you are unable to break down the costs in the table above, give an estimation of the total costs of establishing the Technology:
60000.0
If land user bore less than 100% of costs, indicate who covered the remaining costs:
Project donors and grants will cover all costs
4.5 Maintenance/ recurrent activities
| Activity | Timing/ frequency | |
|---|---|---|
| 1. | Fertilizer | Once per year |
| 2. | Transportation, accommodation for fertilizing and stakeholders engagement | Once per year |
4.6 Costs and inputs needed for maintenance/ recurrent activities (per year)
| Specify input | Unit | Quantity | Costs per Unit | Total costs per input | % of costs borne by land users | |
|---|---|---|---|---|---|---|
| Labour | Transportation, accommodation in the 1st year | Package | 1.0 | 250.0 | 250.0 | |
| Labour | Transportation, accommodation in the 2nd year | Package | 1.0 | 250.0 | 250.0 | |
| Labour | Transportation, accommodation in the 2nd year | Package | 1.0 | 250.0 | 250.0 | |
| Fertilizers and biocides | Goat manure in the 1st year | kg | 400.0 | 0.2 | 80.0 | |
| Fertilizers and biocides | Chicken manure in the 1st year | kg | 400.0 | 0.1 | 40.0 | |
| Fertilizers and biocides | Goat manure in the 2nd year | kg | 400.0 | 0.2 | 80.0 | |
| Fertilizers and biocides | Chicken manure in the 2nd year | kg | 400.0 | 0.1 | 40.0 | |
| Fertilizers and biocides | Goat manure in the 3rd year | kg | 400.0 | 0.2 | 80.0 | |
| Fertilizers and biocides | Chicken manure in the 3rd year | kg | 400.0 | 0.1 | 40.0 | |
| Total costs for maintenance of the Technology | 1110.0 | |||||
| Total costs for maintenance of the Technology in USD | 1.85 | |||||
If you are unable to break down the costs in the table above, give an estimation of the total costs of maintaining the Technology:
1110.0
If land user bore less than 100% of costs, indicate who covered the remaining costs:
The project donors and grants will cover all the cost
4.7 Most important factors affecting the costs
Describe the most determinate factors affecting the costs:
Climate or seasonal change will affect the fertilizing time and will affect the annual cost for fertilizer
5. Natural and human environment
5.1 Climate
Annual rainfall
- < 250 mm
- 251-500 mm
- 501-750 mm
- 751-1,000 mm
- 1,001-1,500 mm
- 1,501-2,000 mm
- 2,001-3,000 mm
- 3,001-4,000 mm
- > 4,000 mm
Indicate the name of the reference meteorological station considered:
Staklim Bali
Agro-climatic zone
- humid
Lenght of Growing Period > 270
Tropical
Oct-March: wet season
April-Sept: dry season
5.2 Topography
Slopes on average:
- flat (0-2%)
- gentle (3-5%)
- moderate (6-10%)
- rolling (11-15%)
- hilly (16-30%)
- steep (31-60%)
- very steep (>60%)
Landforms:
- plateau/plains
- ridges
- mountain slopes
- hill slopes
- footslopes
- valley floors
Altitudinal zone:
- 0-100 m a.s.l.
- 101-500 m a.s.l.
- 501-1,000 m a.s.l.
- 1,001-1,500 m a.s.l.
- 1,501-2,000 m a.s.l.
- 2,001-2,500 m a.s.l.
- 2,501-3,000 m a.s.l.
- 3,001-4,000 m a.s.l.
- > 4,000 m a.s.l.
Indicate if the Technology is specifically applied in:
- not relevant
5.3 Soils
Soil depth on average:
- very shallow (0-20 cm)
- shallow (21-50 cm)
- moderately deep (51-80 cm)
- deep (81-120 cm)
- very deep (> 120 cm)
Soil texture (topsoil):
- medium (loamy, silty)
Soil texture (> 20 cm below surface):
- fine/ heavy (clay)
Topsoil organic matter:
- high (>3%)
If available, attach full soil description or specify the available information, e.g. soil type, soil PH/ acidity, Cation Exchange Capacity, nitrogen, salinity etc.
Andosols (volcanic soil)
Rich organic matter
Highly porous
Dark coloured
Developed from parent material of volcanic origin
Low pH
High porosity
5.4 Water availability and quality
Ground water table:
5-50 m
Availability of surface water:
medium
Water quality (untreated):
poor drinking water (treatment required)
Water quality refers to:
ground water
Is water salinity a problem?
No
Is flooding of the area occurring?
No
5.5 Biodiversity
Species diversity:
- high
Habitat diversity:
- medium
Comments and further specifications on biodiversity:
Wanagiri forest
67 plant species
Agroforestry systems involve growing crops and trees together, which can increase the overall biodiversity of the area.
5.6 Characteristics of land users applying the Technology
Sedentary or nomadic:
- Sedentary
Market orientation of production system:
- mixed (subsistence/ commercial)
Off-farm income:
- 10-50% of all income
- > 50% of all income
Relative level of wealth:
- poor
- average
Individuals or groups:
- groups/ community
Level of mechanization:
- manual work
Gender:
- women
- men
Age of land users:
- middle-aged
- elderly
5.7 Average area of land used by land users applying the Technology
- < 0.5 ha
- 0.5-1 ha
- 1-2 ha
- 2-5 ha
- 5-15 ha
- 15-50 ha
- 50-100 ha
- 100-500 ha
- 500-1,000 ha
- 1,000-10,000 ha
- > 10,000 ha
Is this considered small-, medium- or large-scale (referring to local context)?
- medium-scale
5.8 Land ownership, land use rights, and water use rights
Land ownership:
- state
Land use rights:
- communal (organized)
Water use rights:
- open access (unorganized)
Are land use rights based on a traditional legal system?
No
5.9 Access to services and infrastructure
health:
- poor
- moderate
- good
education:
- poor
- moderate
- good
technical assistance:
- poor
- moderate
- good
employment (e.g. off-farm):
- poor
- moderate
- good
markets:
- poor
- moderate
- good
energy:
- poor
- moderate
- good
roads and transport:
- poor
- moderate
- good
drinking water and sanitation:
- poor
- moderate
- good
financial services:
- poor
- moderate
- good
Comments:
52.64% primary education
35.51% lower secondary and upper secondary
11.85% undergraduate and graduate school
Technical assistance
Employment
Markets
Energy
Road and transport
Drinking water and sanitation
6. Impacts and concluding statements
6.1 On-site impacts the Technology has shown
Socio-economic impacts
Production
land management
Quantity before SLM:
0 ha
Quantity after SLM:
20 ha
Comments/ specify:
This is calculated per 20 ha of the pilot area.
Income and costs
diversity of income sources
Quantity before SLM:
1 income source
Quantity after SLM:
2 income sources
Comments/ specify:
Per 20 ha
Socio-cultural impacts
cultural opportunities
Quantity before SLM:
0 activity
Quantity after SLM:
3 activities
Comments/ specify:
Traditional rituals in 20 ha of the pilot area
Ecological impacts
Biodiversity: vegetation, animals
Vegetation cover
Quantity before SLM:
30%
Quantity after SLM:
75%
plant diversity
Quantity before SLM:
5 types
Quantity after SLM:
10 types
Climate and disaster risk reduction
emission of carbon and greenhouse gases
6.2 Off-site impacts the Technology has shown
Organisational Support
Quantity before SLM:
0 organisation
Quantity after SLM:
10 organisations
Comments/ specify:
Per 20 ha
6.3 Exposure and sensitivity of the Technology to gradual climate change and climate-related extremes/ disasters (as perceived by land users)
Gradual climate change
Gradual climate change
| Season | increase or decrease | How does the Technology cope with it? | |
|---|---|---|---|
| annual rainfall | decrease | moderately |
Climate-related extremes (disasters)
Climatological disasters
| How does the Technology cope with it? | |
|---|---|
| drought | moderately |
Other climate-related consequences
Other climate-related consequences
| How does the Technology cope with it? | |
|---|---|
| reduced growing period | not known |
6.4 Cost-benefit analysis
How do the benefits compare with the establishment costs (from land users’ perspective)?
Short-term returns:
neutral/ balanced
Long-term returns:
positive
How do the benefits compare with the maintenance/ recurrent costs (from land users' perspective)?
Short-term returns:
neutral/ balanced
Long-term returns:
positive
Comments:
Enabling environment for investment in tree-product supply chains
Readily investable business plans and economically viable restoration models targeting profitable species, such as Pongamia, Bamboo, Coffee
Carbon credits
A landscape of integrated restoration, bioenergy, and payment for ecosystem services.
At least 10,000 male and female farmers trained in assisted natural regeneration, enrichment planting, climate-smart agroforestry, bioenergy and other productive practices.
6.5 Adoption of the Technology
- 11-50%
Of all those who have adopted the Technology, how many did so spontaneously, i.e. without receiving any material incentives/ payments?
- 11-50%
Comments:
Yes, they voluntarily did the tree planting
6.6 Adaptation
Has the Technology been modified recently to adapt to changing conditions?
Yes
If yes, indicate to which changing conditions it was adapted:
- changing markets
Specify adaptation of the Technology (design, material/ species, etc.):
By applying intercropping, farmers will have more products variants, e.g. potatoes, chillies
6.7 Strengths/ advantages/ opportunities of the Technology
| Strengths/ advantages/ opportunities in the land user’s view |
|---|
| Quality germplasm from commercially viable nurseries (coffee, avocado, cassava, jackfruit, lamtoro) |
| Landscape restoration |
| Strengths/ advantages/ opportunities in the compiler’s or other key resource person’s view |
|---|
| Community engagement |
| Carbon credits |
6.8 Weaknesses/ disadvantages/ risks of the Technology and ways of overcoming them
| Weaknesses/ disadvantages/ risks in the land user’s view | How can they be overcome? |
|---|---|
| Reduced crops production due to lack of capacity and resources to maintain | Monitoring, evaluation, and maintenance |
| Weaknesses/ disadvantages/ risks in the compiler’s or other key resource person’s view | How can they be overcome? |
|---|---|
| Natural Disaster | Risk Mitigation |
7. References and links
7.1 Methods/ sources of information
- field visits, field surveys
30
- interviews with land users
20
- interviews with SLM specialists/ experts
10
When were the data compiled (in the field)?
21/10/2024
7.2 References to available publications
Title, author, year, ISBN:
N/A
7.3 Links to relevant online information
Title/ description:
Let's restore 43,000 ha of Bali
URL:
https://www.su-re.co/tree-planting
7.4 General comments
Envision a revitalized Bali where degraded lands bloom once more, fostering sustainable farming, robust ecotourism, and enhanced ecosystem services.
Links and modules
Expand all Collapse allLinks
No links
Modules
No modules


