Minimum tillage in UK arable cropping systems: Tivington [United Kingdom]
- Creation:
- Update:
- Compiler: Ceris A. Jones
- Editor: –
- Reviewers: Fabian Ottiger, Alexandra Gavilano
non-inversion tillage (eng); conservation tillage (eng)
technologies_984 - United Kingdom
View sections
Expand all Collapse all1. General information
1.2 Contact details of resource persons and institutions involved in the assessment and documentation of the Technology
SLM specialist:
Oborn Jo
Farming wildlife advisory group
United Kingdom
Name of project which facilitated the documentation/ evaluation of the Technology (if relevant)
Soil and water protection (EU-SOWAP)Name of the institution(s) which facilitated the documentation/ evaluation of the Technology (if relevant)
Farmin & wildlife advisory group (FWAG) - United Kingdom1.3 Conditions regarding the use of data documented through WOCAT
The compiler and key resource person(s) accept the conditions regarding the use of data documented through WOCAT:
Yes
1.5 Reference to Questionnaire(s) on SLM Approaches (documented using WOCAT)
Individual experimental farmer: Tivington [United Kingdom]
Individual farmer experimenting with machinery to maintain economic viability and reduce time spent on land preparation.
- Compiler: Ceris A. Jones
2. Description of the SLM Technology
2.1 Short description of the Technology
Definition of the Technology:
Non-inversion tillage to create a seedbed
2.2 Detailed description of the Technology
Description:
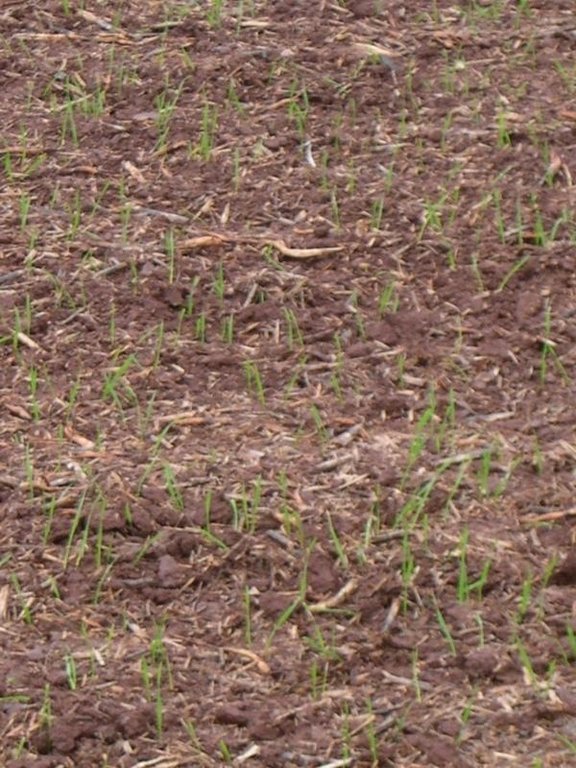
Non-inversion tillage to provide suitable seedbed for following crop.
Purpose of the Technology: Even and cost-effective crop establishment, saving time and benefiting the environment. Maintenance: annually, per crop,
Establishment / maintenance activities and inputs: innovative farmer reducing impacts of farming on the environemnt, expanding his businesss and saving time
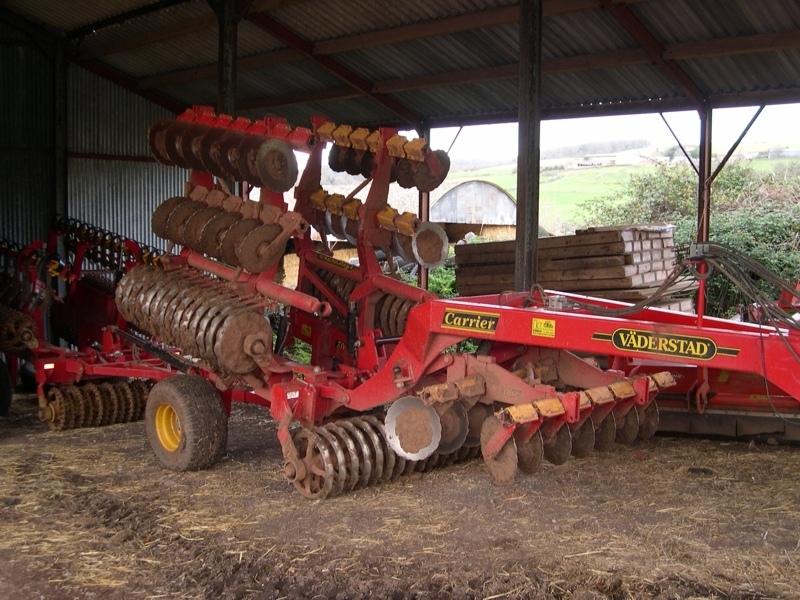
2.3 Photos of the Technology
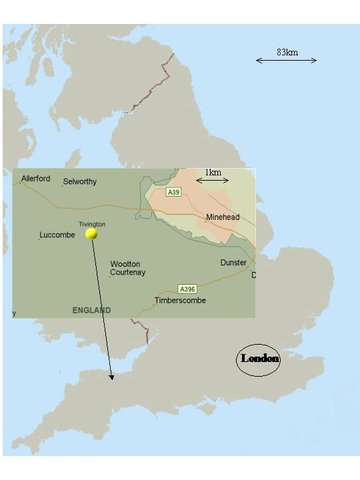
2.5 Country/ region/ locations where the Technology has been applied and which are covered by this assessment
Country:
United Kingdom
Region/ State/ Province:
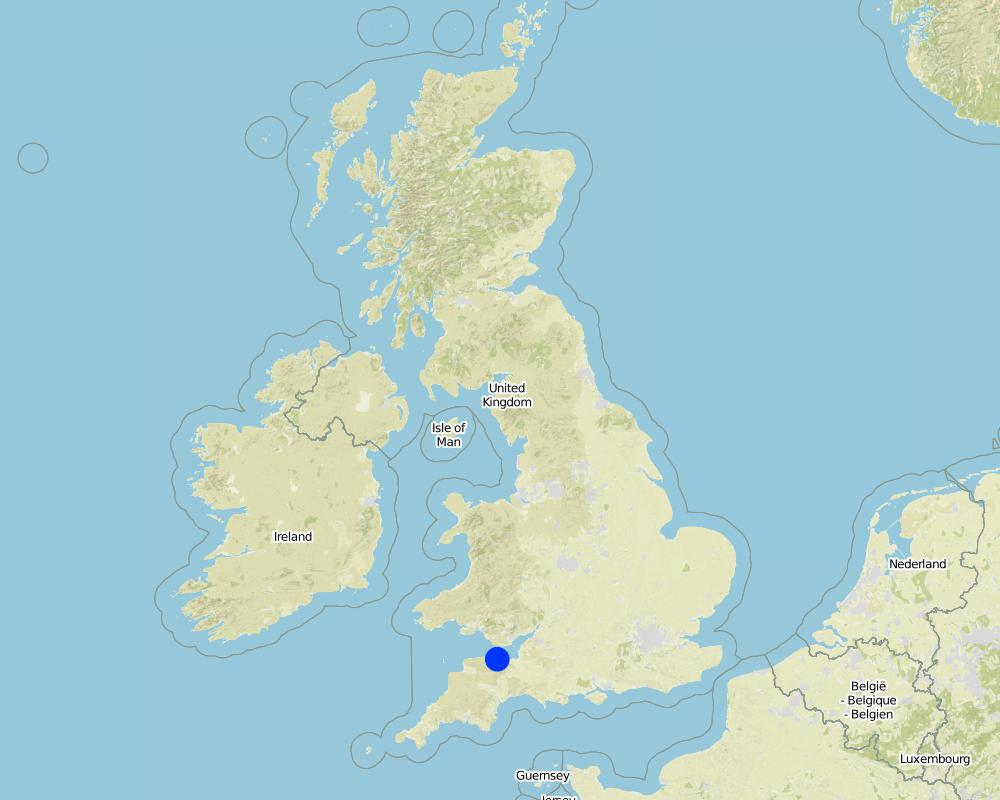
Somerset
Further specification of location:
Minehead
Comments:
Total area covered by the SLM Technology is 0.78 km2.
Farm is a total of 126ha of which 28ha are grazed, 9ha are under environmental stewardship and 7ha are set aside
Map
×3. Classification of the SLM Technology
3.1 Main purpose(s) of the Technology
- reduce, prevent, restore land degradation
3.2 Current land use type(s) where the Technology is applied

Cropland
- Annual cropping
Annual cropping - Specify crops:
- cereals - wheat (spring)
- oilseed crops - sunflower, rapeseed, other
Number of growing seasons per year:
- 1
Specify:
Longest growing period in days: 300 Longest growing period from month to month: Sep - Jul
Comments:
Major land use problems (compiler’s opinion): Soil erosion and compaction caused by inappropriate land use and intensive grazing respectively
Major land use problems (land users’ perception): Soil erosion and capping of the soil
Type of cropping system and major crops comments: winter wheat - winter oilseed rape - winter wheat - beans - winter wheat
3.4 Water supply
Water supply for the land on which the Technology is applied:
- rainfed
3.5 SLM group to which the Technology belongs
- minimal soil disturbance
3.6 SLM measures comprising the Technology
agronomic measures
- A3: Soil surface treatment
Comments:
Main measures: agronomic measures
Type of agronomic measures: early planting, manure / compost / residues, mineral (inorganic) fertilizers, soil conditioners (lime, gypsum), breaking compacted topsoil, minimum tillage
3.7 Main types of land degradation addressed by the Technology
soil erosion by water
- Wt: loss of topsoil/ surface erosion
- Wo: offsite degradation effects
physical soil deterioration
- Pk: slaking and crusting
Comments:
Main type of degradation addressed: Wt: loss of topsoil / surface erosion
Secondary types of degradation addressed: Wo: offsite degradation effects, Pk: sealing and crusting
Main causes of degradation: other human induced causes (specify) (economic viability), poverty / wealth (lack of captial), education, access to knowledge and support services (lack of knowledge)
3.8 Prevention, reduction, or restoration of land degradation
Specify the goal of the Technology with regard to land degradation:
- reduce land degradation
4. Technical specifications, implementation activities, inputs, and costs
4.1 Technical drawing of the Technology
Technical specifications (related to technical drawing):
Technical knowledge required for field staff / advisors: moderate
Technical knowledge required for land users: moderate
Main technical functions: improvement of soil structure
Secondary technical functions: control of raindrop splash, control of dispersed runoff: retain / trap, improvement of ground cover, increase in organic matter, increase in soil fertility
Early planting
Material/ species: crop
Quantity/ density: depends on
Manure / compost / residues
Material/ species: crop residue
Quantity/ density: 2-5 t/ha
Remarks: residue chopped + spread over width of combine
Mineral (inorganic) fertilizers
Remarks: broadcast
Soil conditioners (lime, gypsum)
Material/ species: biosolids (from Aug05)
Breaking compacted topsoil
Remarks: when required
4.2 General information regarding the calculation of inputs and costs
other/ national currency (specify):
£
If relevant, indicate exchange rate from USD to local currency (e.g. 1 USD = 79.9 Brazilian Real): 1 USD =:
0.56
4.3 Establishment activities
Comments:
Additional info: - Year2: surface cultivation: mid September / per crop - Year2: drill: mid September / per crop - Year2: roll: mid September / per crop - Year3: shallow sub-soil: November / per crop - Year3: drill: November / per crop
4.5 Maintenance/ recurrent activities
| Activity | Timing/ frequency | |
|---|---|---|
| 1. | Year1: shallow sub-soil | 3rd-4th week in August / annual |
| 2. | Year1: spray with non-selective herbicide (glyphosate) | late August/ early September / annual |
| 3. | Year1: drill | late August/ early September, 3-4 days after spraying / annual |
| 4. | Year1: roll (optional) | after drilling / annual |
| 5. | Year2: surface cultivation (more in Annex 3) | mid August / per crop |
4.6 Costs and inputs needed for maintenance/ recurrent activities (per year)
| Specify input | Unit | Quantity | Costs per Unit | Total costs per input | % of costs borne by land users | |
|---|---|---|---|---|---|---|
| Equipment | Equipment (year1)-machine hour | |||||
| Equipment | Equipment (year2)-machine hour | |||||
| Equipment | Equipment (year3)-machine hour |
Comments:
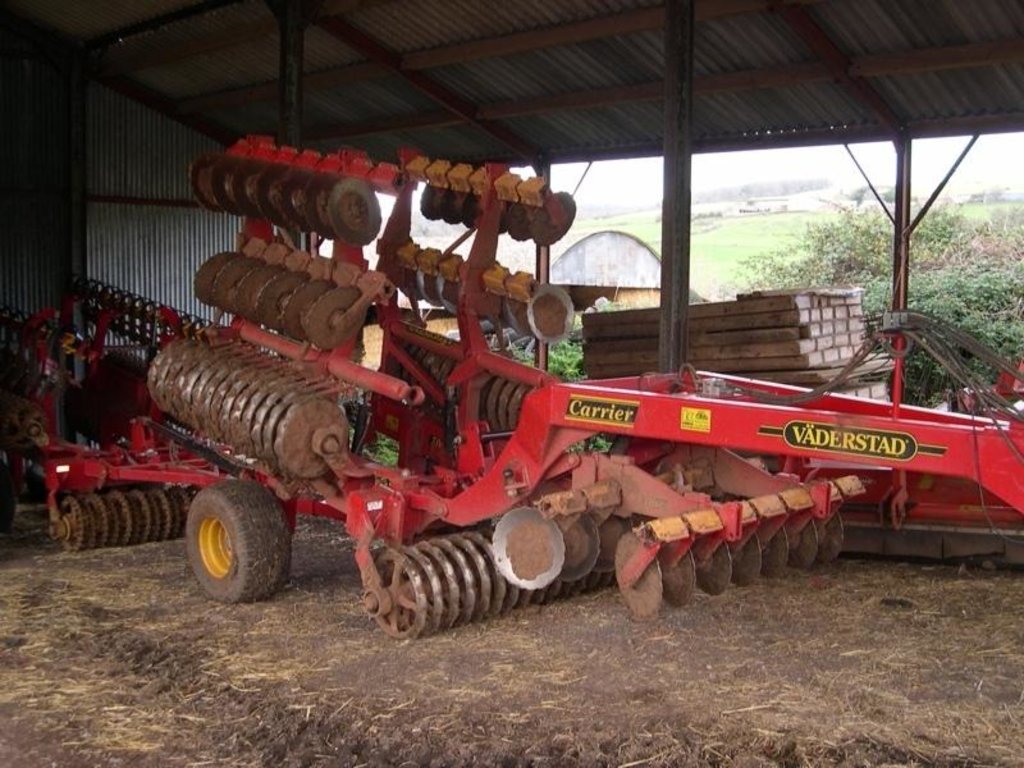
Machinery/ tools: Vaderstad Carrier, Vaderstad drill and roller
Only crop establishment costs are included as all other costs - seed, fertilisers, pesticides - are equivalent with those for conventionally mouldboard ploughing. The costs highlghted include labour. Equivalent crop establishment costs by ploughing are 225 (year1), 231 (year2), 190 (year3)
4.7 Most important factors affecting the costs
Describe the most determinate factors affecting the costs:
slope (steeper slopes require more horsepower), state of the soil, climate, crop
5. Natural and human environment
5.1 Climate
Annual rainfall
- < 250 mm
- 251-500 mm
- 501-750 mm
- 751-1,000 mm
- 1,001-1,500 mm
- 1,501-2,000 mm
- 2,001-3,000 mm
- 3,001-4,000 mm
- > 4,000 mm
Specify average annual rainfall (if known), in mm:
800.00
Agro-climatic zone
- sub-humid
5.2 Topography
Slopes on average:
- flat (0-2%)
- gentle (3-5%)
- moderate (6-10%)
- rolling (11-15%)
- hilly (16-30%)
- steep (31-60%)
- very steep (>60%)
Landforms:
- plateau/plains
- ridges
- mountain slopes
- hill slopes
- footslopes
- valley floors
Altitudinal zone:
- 0-100 m a.s.l.
- 101-500 m a.s.l.
- 501-1,000 m a.s.l.
- 1,001-1,500 m a.s.l.
- 1,501-2,000 m a.s.l.
- 2,001-2,500 m a.s.l.
- 2,501-3,000 m a.s.l.
- 3,001-4,000 m a.s.l.
- > 4,000 m a.s.l.
5.3 Soils
Soil depth on average:
- very shallow (0-20 cm)
- shallow (21-50 cm)
- moderately deep (51-80 cm)
- deep (81-120 cm)
- very deep (> 120 cm)
Soil texture (topsoil):
- medium (loamy, silty)
Topsoil organic matter:
- medium (1-3%)
If available, attach full soil description or specify the available information, e.g. soil type, soil PH/ acidity, Cation Exchange Capacity, nitrogen, salinity etc.
Soil fertility is medium
Soil drainage/infiltration is good
5.6 Characteristics of land users applying the Technology
Market orientation of production system:
- commercial/ market
Relative level of wealth:
- rich
Level of mechanization:
- mechanized/ motorized
Indicate other relevant characteristics of the land users:
Population density: 10-50 persons/km2
Annual population growth: < 0.5%
5% of the land users are very rich and own 20% of the land.
10% of the land users are rich and own 20% of the land.
85% of the land users are average wealthy and own 60% of the land.
Off-farm income specification: Contracting work forms greater part of income
5.7 Average area of land used by land users applying the Technology
- < 0.5 ha
- 0.5-1 ha
- 1-2 ha
- 2-5 ha
- 5-15 ha
- 15-50 ha
- 50-100 ha
- 100-500 ha
- 500-1,000 ha
- 1,000-10,000 ha
- > 10,000 ha
Comments:
126 ha
5.8 Land ownership, land use rights, and water use rights
- Other
Land use rights:
- leased
6. Impacts and concluding statements
6.1 On-site impacts the Technology has shown
Socio-economic impacts
Production
crop production
Comments/ specify:
In early years
Other socio-economic impacts
Timeliness of operations
Comments/ specify:
Operation twice as quick as ploughing
Economic viability
Input constraints
Comments/ specify:
Possible increasing herbicide costs
Hindered farm opperations
Comments/ specify:
timing of operations critical
High machinery costs
Comments/ specify:
High capital investment but low running costs
Socio-cultural impacts
SLM/ land degradation knowledge
Preparation for new legislation
Comments/ specify:
CAP reform, Soil Action Plan for England, EU Water Framework directive
Acceptance by society
Comments/ specify:
Age difference: Technology tends to be taken up by younger farmers
Ecological impacts
Soil
soil moisture
soil cover
soil loss
Quantity before SLM:
0.01
Quantity after SLM:
1
soil crusting/ sealing
Comments/ specify:
Possibility
soil compaction
Biodiversity: vegetation, animals
animal diversity
Comments/ specify:
More earthworms compared to land that has been ploughed
6.2 Off-site impacts the Technology has shown
downstream siltation
6.4 Cost-benefit analysis
How do the benefits compare with the establishment costs (from land users’ perspective)?
Short-term returns:
slightly positive
Long-term returns:
positive
How do the benefits compare with the maintenance/ recurrent costs (from land users' perspective)?
Short-term returns:
neutral/ balanced
Long-term returns:
neutral/ balanced
6.5 Adoption of the Technology
Comments:
100% of land user families have adopted the Technology without any external material support
1 land user families have adopted the Technology without any external material support
There is a moderate trend towards spontaneous adoption of the Technology
Comments on adoption trend: Driven by economics
6.7 Strengths/ advantages/ opportunities of the Technology
| Strengths/ advantages/ opportunities in the land user’s view |
|---|
| Increased work rate making operations quicker |
| Better trafficability |
| Less at risk of weather |
| Earlier drilling. It is a systems approach - minimum tillage combined with early drilling and low seed rates |
| Strengths/ advantages/ opportunities in the compiler’s or other key resource person’s view |
|---|
|
Increased work rate How can they be sustained / enhanced? Better planning |
| Improved soil organic matter |
| (Possible) soil structure improvements |
| Improved soil ecology and other wildlife benefits |
6.8 Weaknesses/ disadvantages/ risks of the Technology and ways of overcoming them
| Weaknesses/ disadvantages/ risks in the land user’s view | How can they be overcome? |
|---|---|
| Dependent on dry weather | Co-operation with other farmers or larger acreage |
| Machinery more complex and expensive | A combination of crop rotation, pesticides and stale seedbeds |
| Increasing grass weed populations | Does not necessarily mean spending money eg utilising old equipment on farm like subsoilers. However, need the right attitude |
| Need to be experimental | Accept advice for varying sources, talk to different people |
| Advice can be fragmented/ confusing |
| Weaknesses/ disadvantages/ risks in the compiler’s or other key resource person’s view | How can they be overcome? |
|---|---|
| Technological knowledge of farmer | Training and education, dissemination |
| Initial high capital investment | Extended finance |
| Possible increasing weed populations | More diverse management options - cultural and chemical |
| Need to expand acreage to cover capital costs | More diverse crop rotation but perhaps this is insufficient to retain economic viability |
7. References and links
7.1 Methods/ sources of information
7.2 References to available publications
Title, author, year, ISBN:
SOWAP project
Available from where? Costs?
www.sowap.org
7.3 Links to relevant online information
Title/ description:
L and D farming
URL:
www.landdfarming.co.uk
Title/ description:
Vaderstad machinery
URL:
www.vaderstad.com
Links and modules
Expand all Collapse allLinks

Individual experimental farmer: Tivington [United Kingdom]
Individual farmer experimenting with machinery to maintain economic viability and reduce time spent on land preparation.
- Compiler: Ceris A. Jones
Modules
No modules


