Sand dams [Kenya]
- Creation:
- Update:
- Compiler: Ian Neal
- Editor: –
- Reviewers: David Streiff, Deborah Niggli, Alexandra Gavilano
Sand storage dams, Groundwater dams
technologies_1537 - Kenya
View sections
Expand all Collapse all1. General information
1.2 Contact details of resource persons and institutions involved in the assessment and documentation of the Technology
SLM specialist:
SLM specialist:
Musila Andrew
Africa Sand Dam Foundation
Kenya
Name of project which facilitated the documentation/ evaluation of the Technology (if relevant)
Book project: Water Harvesting – Guidelines to Good Practice (Water Harvesting)Name of the institution(s) which facilitated the documentation/ evaluation of the Technology (if relevant)
Africa Sand Dam Foundation (ASDF) - KenyaName of the institution(s) which facilitated the documentation/ evaluation of the Technology (if relevant)
Excellent Development Ltd. (Excellent Development Ltd.) - United Kingdom1.3 Conditions regarding the use of data documented through WOCAT
The compiler and key resource person(s) accept the conditions regarding the use of data documented through WOCAT:
Yes
2. Description of the SLM Technology
2.1 Short description of the Technology
Definition of the Technology:
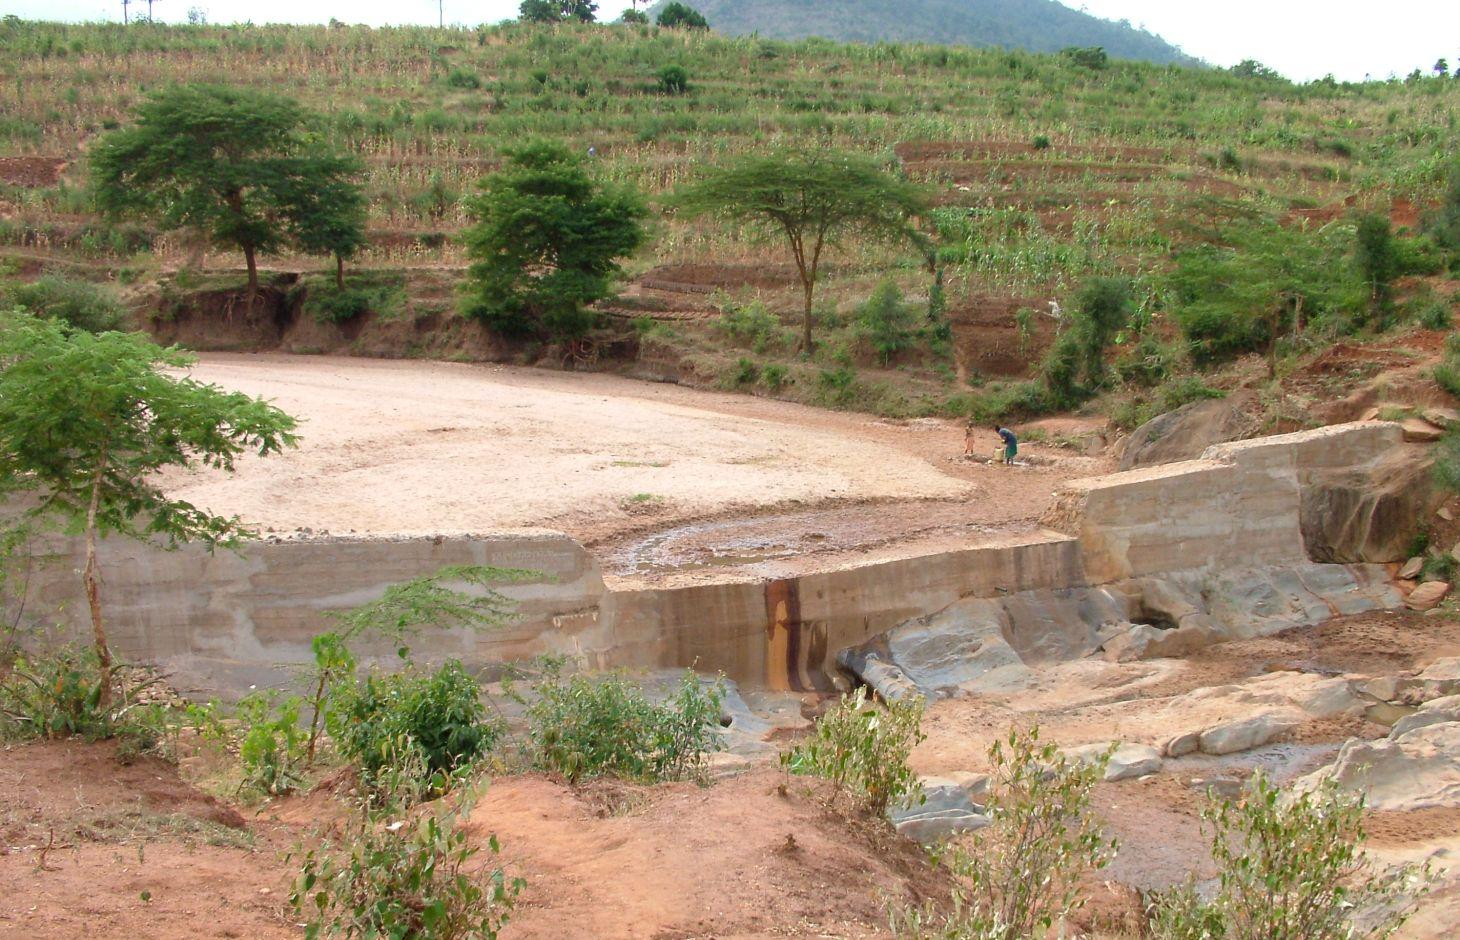
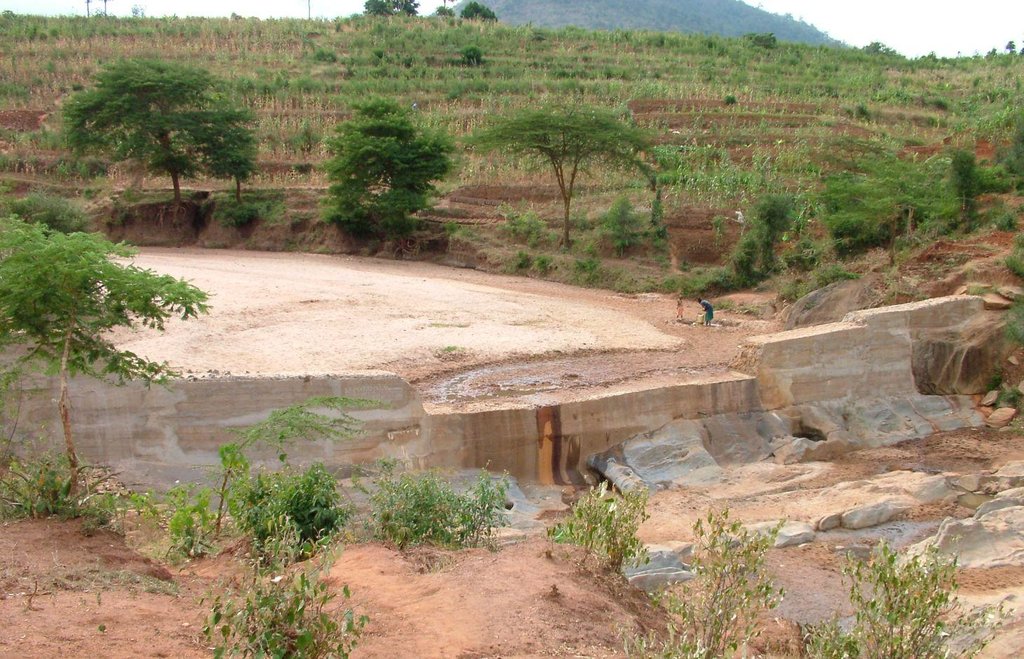
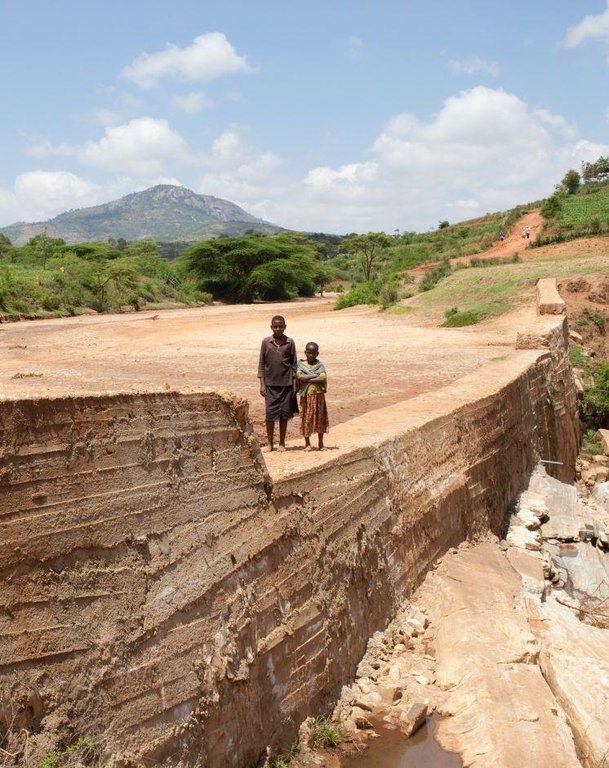
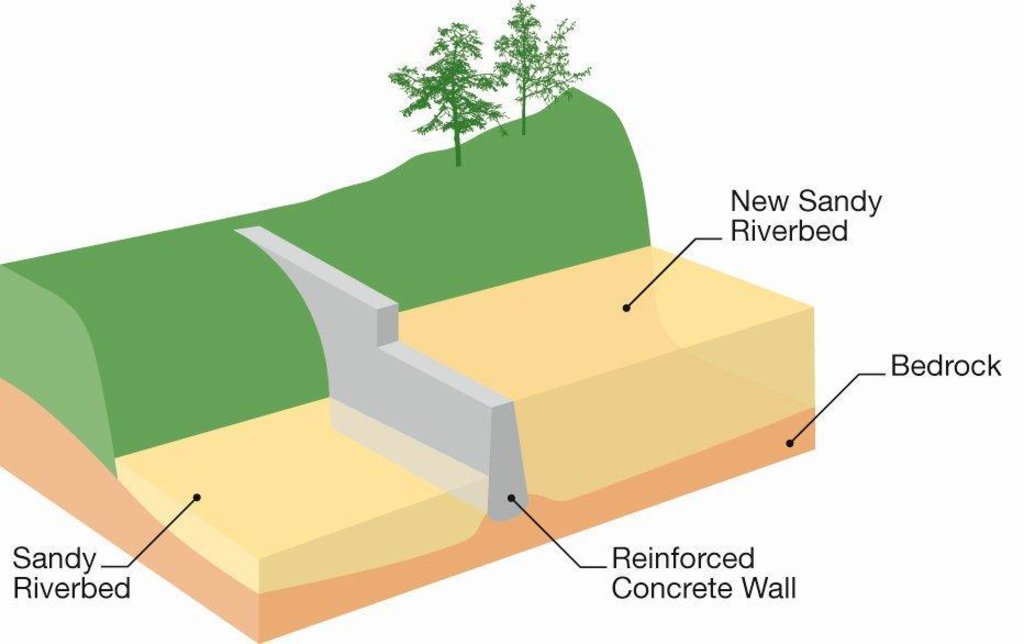
A sand dam is a stone masonry barrier across a seasonal sandy riverbed that traps rainwater and sand flowing down the catchment.
2.2 Detailed description of the Technology
Description:
A sand dam is typically 1 - 5 metres high and 10-50 metres across. When it rains the dam captures soil laden water behind it – the sand in the water sinks to the bottom, whilst the silt remains suspended in the water. Eventually the dams fill with sand - sometimes after only one rainfall or over 1 – 3 seasons. 25 to 40% of the volume of the sand held is actually water. A mature sand dam can store millions of litres of water – refilling after each rainfall providing a year round supply to over 1,000 people.
Purpose of the Technology: Sand dams are a simple, low cost and low maintenance, replicable rainwater harvesting technology. They provide a clean, local water supply for domestic and farming use and are suited to arid and semi-arid areas of the world. It is a solution that is scaleable and has a broader application for use as a rural and game park road crossing to replace less effective culvert bridges.
Establishment / maintenance activities and inputs: Sand dams are the lowest cost form of rainwater harvesting and its robust nature and very low operational and maintenance costs make it particularly suited to remote and poorly served regions. A typical dam using 500 bags of cement would approx be 40 metres in length with a spillway 2 metres above the bedrock. The dam is constructed using stone masonry placed in timber formwork. Such a dam costs approximately USD 11,800 (in 2012 prices). This consists of materials (cement, steel reinforcement, timber, transport) and dam permit USD 8,800 (75%), project management including technical support from skilled local artisans and dam designers USD 2150 (18%) and finance and administration costs of implementing organisation USD 850 (7%). Local people freely contribute their labour to collect rock, sand and water, terrace and protect the immediate catchment and construct the dam. If this contribution was costed and included the cost of the dam would almost double. The maintenance and repair costs of the dam provided it has been well designed and constructed is negligible. Local users are responsible for the management and repair of the dam and its abstraction system. Where a hand pump is fitted, local users fund the repair and replacement of the pump as required. The purchase and repair of petrol powered water pumps which some groups use to irrigate adjacent land is the responsibility of the members of the local group.
Natural / human environment: Because the water is stored within the sand, evaporation losses are very low, the sand filters the water and water-vector diseases such as malaria are controlled. Sand dams provide significant environmental benefits such as aquifer recharge, increased downstream flows in the dry-season, rejuvenation of river ecologies and moderation of floods. As such, it contributes to ecosystem services and climate change adaption.
2.3 Photos of the Technology
2.5 Country/ region/ locations where the Technology has been applied and which are covered by this assessment
Country:
Kenya
Region/ State/ Province:
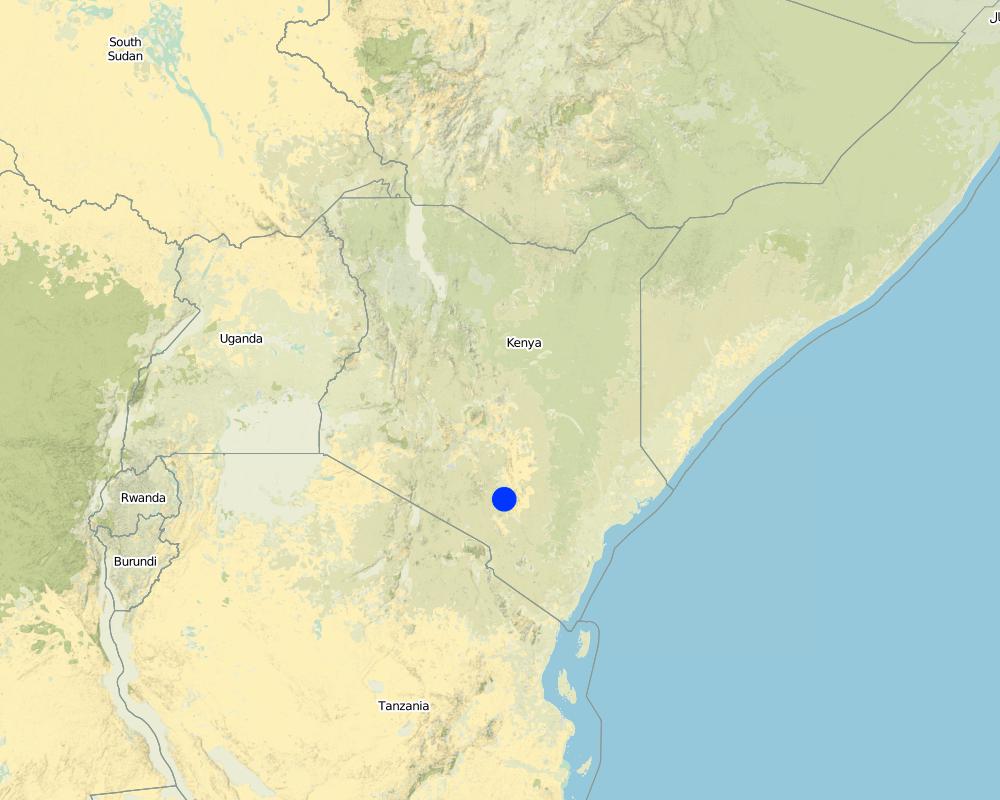
Machakos, Kitui and Makueni Counties
Further specification of location:
Eastern Province, Kenya
Specify the spread of the Technology:
- evenly spread over an area
If precise area is not known, indicate approximate area covered:
- 1,000-10,000 km2
Comments:
Boundary points of the Technology area: An approx. triangular area bordered by Machakos, Kitui and Mitio Andei.
Over 1000 dams have been built to date in these counties, predominantly by 3 organisations: Utooni Development organisation, SASOL and Africa Sand Dam Foundation in an approx. triangular area bordered by Machakos, Kitui and Mitio Andei.
Map
×2.6 Date of implementation
If precise year is not known, indicate approximate date:
- 10-50 years ago
2.7 Introduction of the Technology
Specify how the Technology was introduced:
- through projects/ external interventions
Comments (type of project, etc.):
Sand dams are an ancient technology. Examples are found across the world's drylands although the greatest concentration is found in Kenya. They were introduced to Kenya in the 1950s from India. Dams were pioneered in Machakos and Makueni counties of Kenya by Joshua Mukusya, a visionary farmer and development worker, in 1978. He worked with a range of agencies to develop and implement the technology. In 1990, staff trained by Joshua set up SASOL to pioneer sand dams in the neighbouring county of Kitui. In 2002, Joshua teamed up with Simon Maddrell, Excellent Development's director, to establish Excellent Development Kenya, now Utooni Development Organisation (UDO) to scale up the work. Sadly, in 2011, Joshua passed away. In 2010, Excellent Development formed a strategic partnership with the Kenyan NGO, Africa Sand Dam Foundation (ASDF), to support the wider uptake beyond Kenya. Today, ASDF, SASOL and UDO are the three NGOs with the most experience of building successful sand dams, approx. 130 dams / year, although many other NGOs have adopted the technology.
3. Classification of the SLM Technology
3.1 Main purpose(s) of the Technology
- access to water
3.2 Current land use type(s) where the Technology is applied

Waterways, waterbodies, wetlands
- Drainage lines, waterways
- Ponds, dams
Comments:
Major land use problems (compiler’s opinion): Drylands are characterised by intense and variable rainfall and a lack of vegetative cover. As a result, drylands are prone to droughts, flooding and soil erosion which result in endemic water and food scarcity.
Major land use problems (land users’ perception): “We used to fetch water from Londokwe; we could spend a night to collect water. One way was 3 to 10 km and up to 12 hours or more to go and come back [because of the time taken to queue]. If we could not make it to the river, we would send our children to fetch water. When they went fetching water that would mean they did not go to school. At times people would fight over fetching water from other people’s scoop holes. Scoop holes would be guarded in turns. The gourds [water containers] would be damaged and the water poured down. Children would not go to school [as they needed to] take care of the young ones as the parents went to fetch water. Children would fail to go to school because they were hungry – just because there was no water to cook."
Yikiuuku SHG
3.5 SLM group to which the Technology belongs
- water harvesting
3.6 SLM measures comprising the Technology
structural measures
- S3: Graded ditches, channels, waterways
- S5: Dams, pans, ponds
Comments:
Main measures: structural measures
3.7 Main types of land degradation addressed by the Technology

biological degradation
- Bq: quantity/ biomass decline
- Bs: quality and species composition/ diversity decline

water degradation
- Ha: aridification
- Hs: change in quantity of surface water
- Hg: change in groundwater/aquifer level
Comments:
Main type of degradation addressed: Hs: change in quantity of surface water
Secondary types of degradation addressed: Bq: quantity / biomass decline, Bs: quality and species composition /diversity decline, Ha: aridification, Hg: change in groundwater / aquifer level
Main causes of degradation: Heavy / extreme rainfall (intensity/amounts), droughts
3.8 Prevention, reduction, or restoration of land degradation
Specify the goal of the Technology with regard to land degradation:
- prevent land degradation
- reduce land degradation
4. Technical specifications, implementation activities, inputs, and costs
4.1 Technical drawing of the Technology
Technical specifications (related to technical drawing):
Cross-section of sand dam
Technical knowledge required for field staff / advisors: moderate (The technical skills required to site, design and supervise construction. These skills have and can be developed locally.)
Technical knowledge required for land users: low (Knowledge of local rivers and their flood levels essential. Basic knowledge of stone masonry useful)
Main technical functions: control of concentrated runoff: retain / trap, water harvesting / increase water supply, improvement of water quality, buffering / filtering water
Secondary technical functions: increase of groundwater level / recharge of groundwater, sediment retention / trapping, sediment harvesting, increase of biomass (quantity), promotion of vegetation species and varieties (quality, eg palatable fodder)
Dam/ pan/ pond
Depth of ditches/pits/dams (m): 1-5
Width of ditches/pits/dams (m): 1-2
Length of ditches/pits/dams (m): 5-50
Specification of dams/ pans/ ponds: Capacity 5,000m3
Catchment area: 300 km2m2
Author:
Excellent Development
4.2 General information regarding the calculation of inputs and costs
other/ national currency (specify):
Kenyan Shilling
If relevant, indicate exchange rate from USD to local currency (e.g. 1 USD = 79.9 Brazilian Real): 1 USD =:
83.0
Indicate average wage cost of hired labour per day:
2.50
4.3 Establishment activities
| Activity | Timing (season) | |
|---|---|---|
| 1. | Collection of rock, sand and water | 1-3 months before construction |
| 2. | Construct dam | During dry season |
| 3. | Cure dam | For 4 weeks after construction |
| 4. | Terracing and protection of immediate catchment | 1-3 months before construction |
4.4 Costs and inputs needed for establishment
| Specify input | Unit | Quantity | Costs per Unit | Total costs per input | % of costs borne by land users | |
|---|---|---|---|---|---|---|
| Labour | Collection of rock, sand and water | Persons/day | 220.0 | 2.5 | 550.0 | 100.0 |
| Labour | Terracing and protection of immediate catchment | Persons/day | 100.0 | 2.5 | 250.0 | 100.0 |
| Labour | Construct dam | Persons/day | 500.0 | 2.5 | 1250.0 | 90.0 |
| Labour | Cure dam | Persons/day | 50.0 | 2.5 | 125.0 | 100.0 |
| Equipment | Tools | per dam | 1.0 | 300.0 | 300.0 | |
| Construction material | Cement (bag = 50kg) | bags | 500.0 | 9.15 | 4575.0 | |
| Construction material | Steel (12m x Y20 steel bar) | pieces | 7.0 | 45.7 | 319.9 | |
| Construction material | Steel | per dam | 1.0 | 1000.0 | 1000.0 | |
| Other | Skilled labour | per dam | 1.0 | 3000.0 | 3000.0 | |
| Total costs for establishment of the Technology | 11369.9 | |||||
| Total costs for establishment of the Technology in USD | 136.99 | |||||
Comments:
Duration of establishment phase: 6 month(s)
4.5 Maintenance/ recurrent activities
| Activity | Timing/ frequency | |
|---|---|---|
| 1. | Inspect and if necessary extend spillway or repair erosion around dam | As required / annually |
| 2. | Maintain hand pump if fitted | As required / annually |
4.6 Costs and inputs needed for maintenance/ recurrent activities (per year)
Comments:
In 2012, in Machakos County, Kenya, the cost of materials and technical support for a dam using 250 bags of cement is USD 7,000 and USD 11,700 for a 500 bag dam. The costs in 2.6.1 are based on a 500 bag dam. The volume of a 500 bag dam is approx 140m3 of stone masonry of which 40% is mortar (sand and cement) and 60% is rock. Such a dam will typically be appropriate on rivers 30m wide and with a spillway 3 metres above the bedrock in the river bed level. Costs rise by up to 50% in more remote regions or countries. Sand dams require a lot of hard work. Community members collect the required stones, sand and water, support construction and terrace the land around the dam. If this in-kind contribution is included the costs would rise by 100%. In Kenya, with a long tradition of building sand dams, it takes from 6 to 12 weeks to plan and prepare for construction and 2 days to 2 weeks to build the dam. In other areas, with less experience and/or less community commitment, building a dam may take 6 months or more.
4.7 Most important factors affecting the costs
Describe the most determinate factors affecting the costs:
Each dam is individually designed. The size, design and cost of a dam varies considerably with the size of the river and to a lesser extent, location and transport costs. Sand dams are the world’s lowest cost method of capturing rainwater in dry rural areas by a factor of 3 to 30 times compared to rain water harvesting tanks, earth dams, haffirs and rock catchments.
5. Natural and human environment
5.1 Climate
Annual rainfall
- < 250 mm
- 251-500 mm
- 501-750 mm
- 751-1,000 mm
- 1,001-1,500 mm
- 1,501-2,000 mm
- 2,001-3,000 mm
- 3,001-4,000 mm
- > 4,000 mm
Specifications/ comments on rainfall:
Sand dams suit dryland climate: dry sub-humid, semi-arid and arid climates
Agro-climatic zone
- semi-arid
Thermal climate class: subtropics
5.2 Topography
Slopes on average:
- flat (0-2%)
- gentle (3-5%)
- moderate (6-10%)
- rolling (11-15%)
- hilly (16-30%)
- steep (31-60%)
- very steep (>60%)
Landforms:
- plateau/plains
- ridges
- mountain slopes
- hill slopes
- footslopes
- valley floors
Altitudinal zone:
- 0-100 m a.s.l.
- 101-500 m a.s.l.
- 501-1,000 m a.s.l.
- 1,001-1,500 m a.s.l.
- 1,501-2,000 m a.s.l.
- 2,001-2,500 m a.s.l.
- 2,501-3,000 m a.s.l.
- 3,001-4,000 m a.s.l.
- > 4,000 m a.s.l.
Comments and further specifications on topography:
Land forms: Sand dams only suit seasonal rivers with sufficient sandy sediment and an accessible bedrock
Altitudinal zone: Also 1,001-1,500 m a.s.l.
Slopes on average: Also moderate
5.3 Soils
If available, attach full soil description or specify the available information, e.g. soil type, soil PH/ acidity, Cation Exchange Capacity, nitrogen, salinity etc.
Soil water storage capacity: The aquifer behind the dam must consist of sandy sediments with a high porosity and drainable porosity
5.4 Water availability and quality
Ground water table:
5-50 m
Availability of surface water:
excess
Water quality (untreated):
good drinking water
Comments and further specifications on water quality and quantity:
Availability of surface water: Sand dams only suit seasonal rivers
Water quality (untreated): Good drinking water because the sand filters the water. Water abstracted through an infiltration gallery has a high bacterialogical quality but water is often used for small scale irrigation and livestock watering.
5.5 Biodiversity
Species diversity:
- high
Comments and further specifications on biodiversity:
Sand dams rejuvenate riverine ecologies and increase local biodiversity
5.6 Characteristics of land users applying the Technology
Off-farm income:
- less than 10% of all income
Relative level of wealth:
- poor
- average
Individuals or groups:
- groups/ community
Gender:
- women
Indicate other relevant characteristics of the land users:
Land users applying the Technology are mainly common / average land users
Difference in the involvement of women and men: The dams are built by members of registered self-help groups, typically 50 members / group and two-thirds women. The primary concerns of these groups tend to be food and water. Sand dams provide for people, livestock and crops. Water collection and farming are primarily undertaken by women in Kikamba culture and hence women have the greatest vested interest to imrpove food and water availability. Many men migrate away from the area in search of work.
Population density: 50-100 persons/km2
Annual population growth: 2% - 3%
Off-farm income specification: This varies considerably, but most self-help group members are subsistence farmers
5.7 Average area of land used by land users applying the Technology
- < 0.5 ha
- 0.5-1 ha
- 1-2 ha
- 2-5 ha
- 5-15 ha
- 15-50 ha
- 50-100 ha
- 100-500 ha
- 500-1,000 ha
- 1,000-10,000 ha
- > 10,000 ha
Is this considered small-, medium- or large-scale (referring to local context)?
- small-scale
5.8 Land ownership, land use rights, and water use rights
Land ownership:
- state
Land use rights:
- communal (organized)
Water use rights:
- communal (organized)
Comments:
Legal agreements for construction and access between the self-help group and the owners of land adjacent to the dam and registering the dam and its associated water rights by the self-help group with the Kenyan Water Resources Management Authority (WRMA) is vital to safeguarding water rights, controlling water and sand abstraction, formalising the authority of the self-help group to levy water tarriffs if appropriate and ensuring there is open access to all to water from scoop holes.
5.9 Access to services and infrastructure
health:
- poor
- moderate
- good
education:
- poor
- moderate
- good
technical assistance:
- poor
- moderate
- good
employment (e.g. off-farm):
- poor
- moderate
- good
markets:
- poor
- moderate
- good
energy:
- poor
- moderate
- good
roads and transport:
- poor
- moderate
- good
drinking water and sanitation:
- poor
- moderate
- good
financial services:
- poor
- moderate
- good
6. Impacts and concluding statements
6.1 On-site impacts the Technology has shown
Socio-economic impacts
Production
crop production
fodder production
fodder quality
animal production
wood production
risk of production failure
product diversity
energy generation
Comments/ specify:
Tree planting enabled by dams increases fuel wood availability
Water availability and quality
drinking water availability
water availability for livestock
water quality for livestock
irrigation water availability
irrigation water quality
Income and costs
farm income
diversity of income sources
workload
Comments/ specify:
Construction of sand dams is labour intensive. This is more than offset by the time savings created by reducing the time required to collect water.
Other socio-economic impacts
School attendance
Socio-cultural impacts
food security/ self-sufficiency
Comments/ specify:
Sand dams are integrated within a wider programme that promotes food security and self sufficiency
health situation
Comments/ specify:
Reduced water borne disease. Increased access to higher quality water and improved food security improves health.
cultural opportunities
Comments/ specify:
Working through and strengthening self help groups builds on the local tradition of self-help called mwethya
community institutions
Comments/ specify:
Increases the capacity of self-help groups
SLM/ land degradation knowledge
Comments/ specify:
Learning exchanges between self-help groups and demonstration plots builds knowledge and adoption of conservation farming
conflict mitigation
Comments/ specify:
If ownership and management of dam is not clear and legally protected this can result in conflict
Fuel security
Comments/ specify:
Tree nursersies and agro-forestry enabled by sand dams improves access to fuel food
Livelihood and human well-being
Comments/ specify:
Sand dams save farmers hours every day that they can invest in improving their farms to grow more food and create the potential for farmers to irrigate trees and crops, water livestock and generate an income. It is strongly advised that sand ams are integrated within a wider land management and livelihoods programme in order to realise these opportunities to the maximum. Community ownership and management is critical to achieving this
Livestock health
Comments/ specify:
Sand dams provide secure water source for livestock
Income
Comments/ specify:
Irrigated horticulture and tree nurseries improves farmer incomes
Ecological impacts
Water cycle/ runoff
water quantity
Quantity before SLM:
<1000m3
Quantity after SLM:
2-10,000m3
water quality
Comments/ specify:
Sand filters the water
harvesting/ collection of water
Comments/ specify:
Sand dams capture excess flood flows
surface runoff
Comments/ specify:
Terracing the immediate dam catchment reduces surface runoff
groundwater table/ aquifer
Comments/ specify:
Studies of Kitui dams found watertable increased by several metres
evaporation
Comments/ specify:
Once the water level in the dam aquifer is below 60cm, evaporation losses from the sand are negligible
Soil
soil moisture
Comments/ specify:
Sand dams recharge the aquifer and raises the watertable above and below the dam
salinity
Comments/ specify:
Salinity of sand dam water is often less than surrounding groundwater
Biodiversity: vegetation, animals
plant diversity
Comments/ specify:
Rejuvenation of riverine ecologies and planting indigenous trees increases diversity
habitat diversity
Comments/ specify:
Riverine ecologies rejuvenated
Climate and disaster risk reduction
flood impacts
Comments/ specify:
By creating a buffer, flooding downstream of a dam or series of dams is reduced
emission of carbon and greenhouse gases
Comments/ specify:
Tree nursersies enabled by sand dams capture store carbon and reduce deforestation
6.2 Off-site impacts the Technology has shown
water availability
downstream flooding
buffering/ filtering capacity
damage on neighbours' fields
damage on public/ private infrastructure
6.3 Exposure and sensitivity of the Technology to gradual climate change and climate-related extremes/ disasters (as perceived by land users)
Gradual climate change
Gradual climate change
| Season | increase or decrease | How does the Technology cope with it? | |
|---|---|---|---|
| annual temperature | increase | well |
Climate-related extremes (disasters)
Meteorological disasters
| How does the Technology cope with it? | |
|---|---|
| local rainstorm | well |
| local windstorm | well |
Climatological disasters
| How does the Technology cope with it? | |
|---|---|
| drought | well |
Hydrological disasters
| How does the Technology cope with it? | |
|---|---|
| general (river) flood | well |
Other climate-related consequences
Other climate-related consequences
| How does the Technology cope with it? | |
|---|---|
| reduced growing period | well |
Comments:
The capacity of the spillway would be increased to control peak flood events
6.4 Cost-benefit analysis
How do the benefits compare with the establishment costs (from land users’ perspective)?
Short-term returns:
positive
Long-term returns:
very positive
How do the benefits compare with the maintenance/ recurrent costs (from land users' perspective)?
Short-term returns:
very positive
Long-term returns:
very positive
Comments:
The very low cost of operating and maintaining sand dams means they are well suited to remote, poorly served regions. Because it is a low cost technology that requires a major community contribution and the knowledge and skills of locally trained artisans, it’s a solution particularly suited to community ownership and self-supply. This contributes to effective implementation.
6.5 Adoption of the Technology
Of all those who have adopted the Technology, how many did so spontaneously, i.e. without receiving any material incentives/ payments?
- 0-10%
Comments:
100% of land user families have adopted the Technology with external material support
Comments on acceptance with external material support: Sand dams require external material support including technical advice to correctly site, design and construct
There is a little trend towards spontaneous adoption of the Technology
Comments on adoption trend: There is some evidence of spontaneous adoption amongst development agencies working in regions suited to sand dams.
6.7 Strengths/ advantages/ opportunities of the Technology
| Strengths/ advantages/ opportunities in the land user’s view |
|---|
| “I will be able to rent a plot of land near to the sand dam and grow vegetables (tomatoes, peppers, and French beans). My animals will also be healthy because they will always be able to drink here, even during the droughts.” Mauwa Maingi, self-help group member, aged 87, 2010 |
|
Mbatha Mbuli, 83. "My family collects water from a near-by well, about ½ Km away, but the water is very salty. It takes one hour to collect water, and needs 6 trips to fetch enough to last the day. There is a pipeline nearby but we must pay 2 shillings per 20 litres. I planted 9 different crops last year, but only 2 survived. I wanted to work with Excellent on this project because I had heard that the projects you support help communities like us to build sand dams, grow trees and create seed banks. I would like to grow trees like Neem in the future and a sand dam here will really help with that. Excellent shares in the interests of the community and they listen to the community and take direction from us" |
| Stephen Hussey, Dabane Trust, 2011 “Dabane has made its name by getting water out of sand rivers – Our next step is to ensure we don’t over abstract – the answer to that, especially upstream, is sand dams. Without a doubt.” |
| Milka Mutunga, Kilili Catchment SHG, Kenya 2009-10 "The distance that I used to travel in order to fetch water has been reduced..now I am able to plant more vegetables close to my home. I have learnt how to dig terraces which have helped in increasing the yields that I harvest from my farm..If this is not development then I do not know what development means" |
| Kimanthi Ngovi, Yikiuuku SHG “The sand dams have done an incredible work for us – water availability at a shorter distance has helped me in saving time for other activities. When water was a long way away I had to get time to collect water in one day and dig terraces on the other day. Today I can fetch water and dig terraces on the same day.” |
| Strengths/ advantages/ opportunities in the compiler’s or other key resource person’s view |
|---|
|
Sand dams provide a safe, reliable, year round, local supply of water for people, crops and livestock in water scarce environments How can they be sustained / enhanced? The very low cost of operating and maintaining sand dams means they are well suited to remote, poorly served regions. Community ownership is critical to their effective management. |
|
Sand dams save farmers hours every day that they can invest in improving their farms to grow more food and create the potential for farmers to irrigate trees and crops, water livestock and generate an income How can they be sustained / enhanced? Don’t build a sand dam in isolation. An independent evaluation in 2010 of 2 sand dam programmes found the long term impacts on poverty, food security and incomes were greatest when sand dams were integrated within a wider community development programme aimed at improving food production, livestock management and land management practice. |
|
Because it is a low cost technology that requires a major community contribution and the knowledge and skills of locally trained artisans, it’s a solution particularly suited to community ownership and self-supply. This contributes to effective implementation. How can they be sustained / enhanced? Don’t short cut community ownership. Communities better understand and are able to implement solutions to their problems if they are central to the planning of the solution. Genuine community commitment and ownership from initial planning to on-going management is vital to realise the intended benefits and full potential created by a dam. Legal registration and agreements to safeguard community access and water rights help this. |
|
Sand dams provide significant environmental benefits such as aquifer recharge, increased downstream flows in the dry-season, rejuvenation of river ecologies and moderation of floods. As such, it contributes to eco-system services and climate change adaption. How can they be sustained / enhanced? Support terracing, tree planting and conservation farming in the wider catchment. This conserves soil and water on farms, increases aquifer recharge and base flows into the dam and reduces the amount of silt in the sand dam aquiver. Research and disseminate evidence of these benefits and the value of these eco-system services |
|
The technology is scaleable and has a broader application for use as a rural and game park road crossing to replace less effective culvert bridges. How can they be sustained / enhanced? In order to upscale this solution, there is a need for greater awareness and advocacy of the technology and its benefits amongst these groups. Nothing generates interest in sand dams more than exposure to successful examples |
6.8 Weaknesses/ disadvantages/ risks of the Technology and ways of overcoming them
| Weaknesses/ disadvantages/ risks in the compiler’s or other key resource person’s view | How can they be overcome? |
|---|---|
| Although sand dams are technically replicable, their application in new contexts requires careful understanding and consideration. | Excellent Development has developed a framework tool to help agencies identify the political, economic, social, technical, legal and environmental factors that should be taken account of when introducing sand dams to a new context. |
| Sand dams require the technical knowledge and skills of local artisans in order to correctly site, design and construct them | The technical barriers to adoption are low: The technical skills required have and can be developed locally. Learning exchanges between implementing organisations and developing technical manuals and resources aids this learning |
| This is a drylands solution. Sand dams can only be built on seasonal rivers with sufficient sandy sediment and where the bedrock or impermeable layer is accessible in the river bed. | Increase awareness of the criteria that determine the technical suitability of a site. Use simple field tests, such as sediment seiving and probing, to assess potential sites and to map the potenial application of sand dams. |
7. References and links
7.1 Methods/ sources of information
7.2 References to available publications
Title, author, year, ISBN:
Be buffered website including Managing the Water Buffer for Development and Climate Change Adaptation. Groundwater recharge, retention, reuse and rainwater storage. Steenbergen F. van and A. Tuinhof. (2009) which includes sand dams
Available from where? Costs?
www.bebuffered.com/3rbook
Links and modules
Expand all Collapse allLinks
No links
Modules
No modules


