Index Based Livestock Insurance [Kenya]
- Creation:
- Update:
- Compiler: Duncan Collins Khalai
- Editor: –
- Reviewers: Alexandra Gavilano, Rima Mekdaschi Studer, Donia Mühlematter, Hanspeter Liniger, Joana Eichenberger
IBLI
technologies_3361 - Kenya
- Full summary as PDF
- Full summary as PDF for print
- Full summary in the browser
- Full summary (unformatted)
- Index Based Livestock Insurance: May 9, 2019 (inactive)
- Index Based Livestock Insurance: Sept. 3, 2018 (inactive)
- Index Based Livestock Insurance: Nov. 2, 2021 (public)
- Index Based Livestock Insurance: June 7, 2018 (inactive)
- Index Based Livestock Insurance: May 13, 2018 (inactive)
- Index Based Livestock Insurance: Jan. 25, 2018 (inactive)
View sections
Expand all Collapse all1. General information
1.2 Contact details of resource persons and institutions involved in the assessment and documentation of the Technology
Name of project which facilitated the documentation/ evaluation of the Technology (if relevant)
Index Based Livestock Insurance, Kenya (IBLI)Name of project which facilitated the documentation/ evaluation of the Technology (if relevant)
Book project: Guidelines to Rangeland Management in Sub-Saharan Africa (Rangeland Management) {'additional_translations': {}, 'value': 6111, 'label': 'Name of the institution(s) which facilitated the documentation/ evaluation of the Technology (if relevant)', 'text': 'International Livestock Research Institute (ILRI) - Kenya', 'template': 'raw'}1.3 Conditions regarding the use of data documented through WOCAT
The compiler and key resource person(s) accept the conditions regarding the use of data documented through WOCAT:
Yes
1.4 Declaration on sustainability of the described Technology
Is the Technology described here problematic with regard to land degradation, so that it cannot be declared a sustainable land management technology?
No
2. Description of the SLM Technology
2.1 Short description of the Technology
Definition of the Technology:
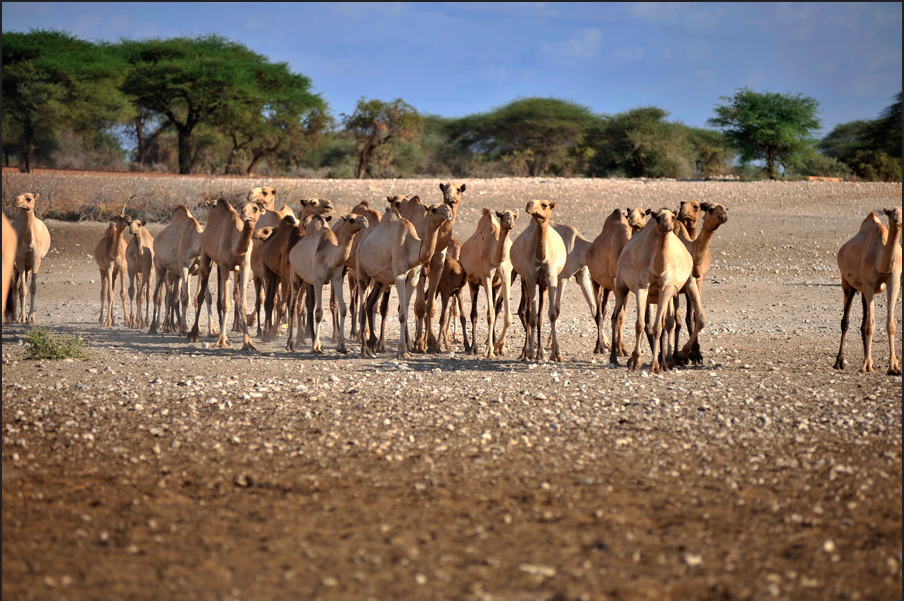
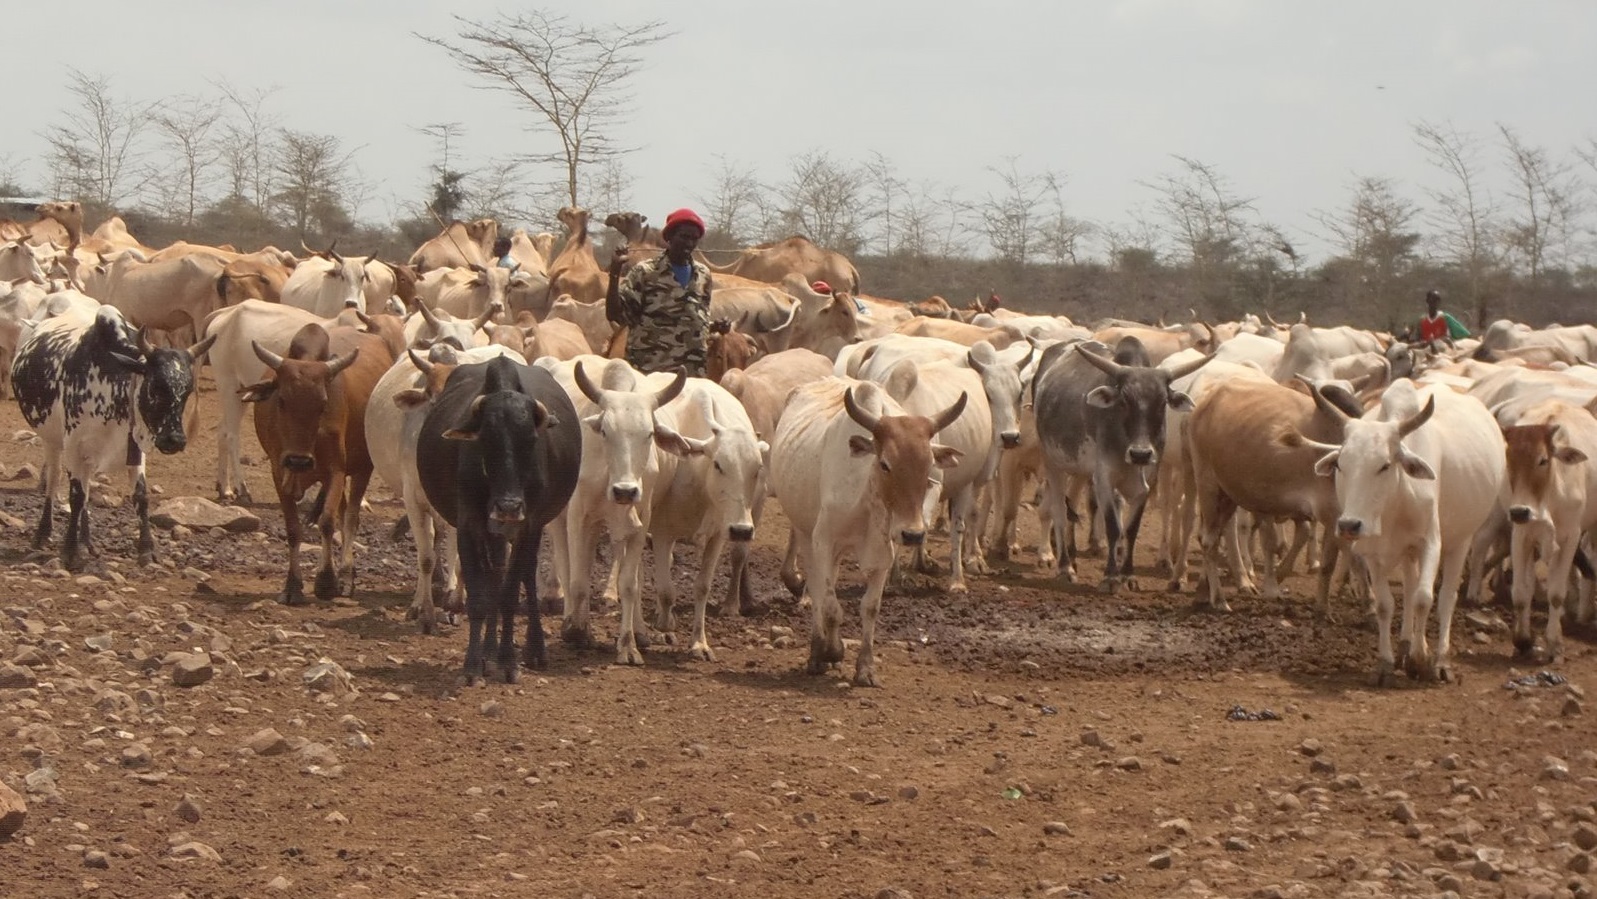
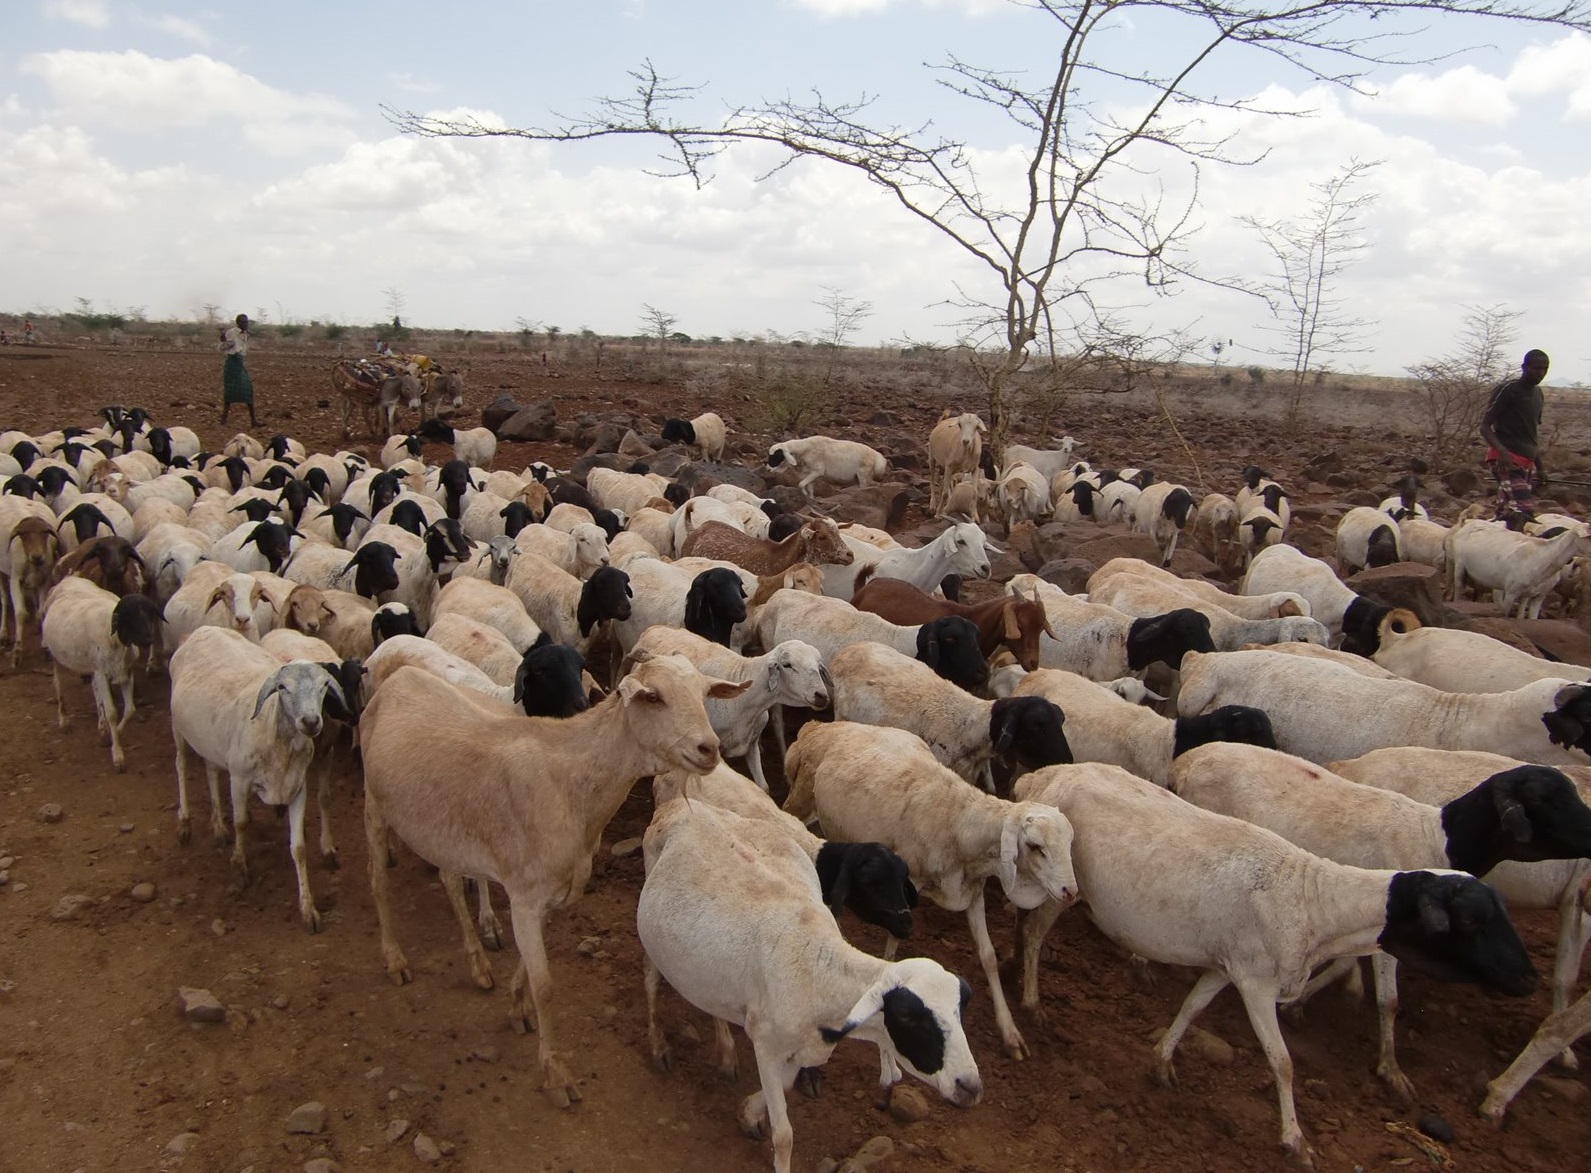
Index-Based Livestock Insurance (IBLI) is a product that was designed to help protect pastoralists and their livestock against the effects of prolonged forage scarcity. IBLI triggers payment to pastoralists when the forage situation deteriorates to levels considered to be severe, as compared to historical conditions over time.
2.2 Detailed description of the Technology
Description:
In the event of severe seasonal drought, forage and grazing resources are depleted and livestock may die because of starvation. Index Based Livestock Insurance (IBLI) is the technology applied in the provision of forage based livestock (asset) protection insurance. IBLI uses Normalized Difference Vegetation Index (NDVI), a satellite-derived indicator of the amount and vigor of vegetation, based on the observed level of photosynthetic activity (Tucker et al., 2005). NDVI is derived from 10-day composites of 250m filtered eMODIS processed by the United States’ National Aeronautics and Space Administration (NASA) and transformed by The Earth Resources Observation Systems (EROS) Data Center (EDC) of the US Geological Survey (USGS). NDVI data from the AQUA satellite platform are available from July 2002 to present at https://lta.cr.usgs.gov/emodis.
In the case of IBLI, the index is a deviation of cumulative forage availability (ZCumNDVI) in the insured season. It measures forage conditions over a defined time period and compares the observed NDVI over a particular season, with the observed NDVI over a given historical period (e.g. 15 years). A set threshold below which payouts must be made is called the trigger level. Therefore, when the forage situation in a given season is worse than the 20th worst season in the last 15 years, a payout is triggered. In other words, IBLI will compensate if the forage conditions fall below the worst 20th percentile of seasonal pasture levels cumulated over the historical drought seasons in the past 15 years. IBLI therefore uses the satellite-based vegetation index to measure forage availability and to trigger timely payouts to pastoralists based on the costs of providing supplementary feeds to the animals for the specific season that a drought is triggered.
For precision and proper administration each insured county is broken down into smaller units of insurance which are referred to as Unit Areas of Insurance (UAIs). Each UAI represents a geographical area whose forage availability index data are aggregated as one unit for insurance purposes. The identification of the geographic areas that constitute UAIs is a key step in IBLI contract design because the use of average NDVI over insurable units is based on the premise that drought is a covariate shock and that pastoral communities affected in a particular area are deemed to suffer in equal measure.Thus, for accuracy and acceptability, the index should be tightly correlated with forage scarcity and reflect relative conditions on the ground. Also forage access should be relatively homogeneous for herders residing in the same insurable unit. The process of demarcating UAIs is known as clustering. It is done through a combination of active participatory community engagement and scientific methods .
Insured pastoralists are not always paid when there is drought. They are only paid when drought is so severe that the amount of forage falls below the strike level. Insured pastoralists will not receive payments if the forage availability is more than the strike level. This is an annual policy which covers forage availability as measured by satellite Normalized Difference Vegetation Index (NDVI) in up to 2 rainy seasons as per the bimodal rain patterns in Kenya. Pastoralists who do not hold insurance contracts are not covered by under, and therefore do not receive payments, even if they live in the same UAIs as the ones who have insured their livestock.
2.3 Photos of the Technology
Media Gallery
2.5 Country/ region/ locations where the Technology has been applied and which are covered by this assessment
Country:
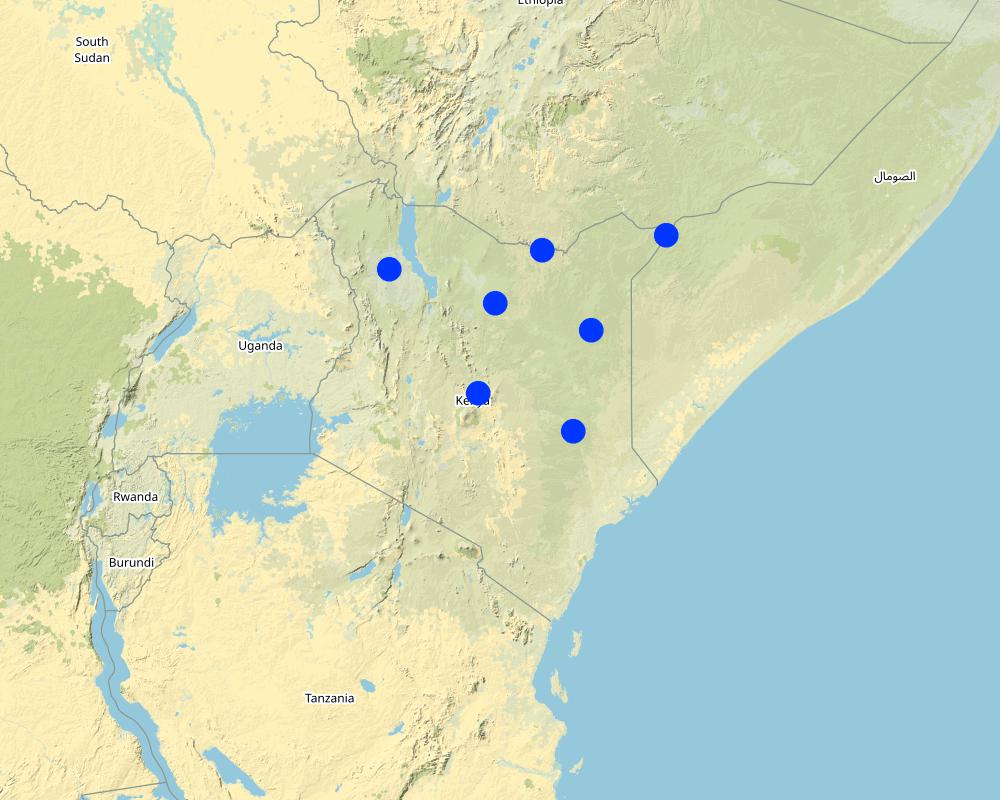
Kenya
Specify the spread of the Technology:
- evenly spread over an area
If precise area is not known, indicate approximate area covered:
- 100-1,000 km2
Map
×2.6 Date of implementation
If precise year is not known, indicate approximate date:
- less than 10 years ago (recently)
2.7 Introduction of the Technology
Specify how the Technology was introduced:
- during experiments/ research
3. Classification of the SLM Technology
3.1 Main purpose(s) of the Technology
- reduce risk of disasters
- adapt to climate change/ extremes and its impacts
- create beneficial economic impact
3.2 Current land use type(s) where the Technology is applied

Grazing land
Extensive grazing:
- Nomadism
- Semi-nomadic pastoralism
Animal type:
- goats
- camels
- sheep
- cattle
Comments:
Number of growing seasons per year: 2
3.4 Water supply
Water supply for the land on which the Technology is applied:
- rainfed
3.5 SLM group to which the Technology belongs
- pastoralism and grazing land management
3.6 SLM measures comprising the Technology

other measures
Comments:
Providing Index Based Livestock Insurance to pastoralist communities to cushion the cost of keeping their animals alive during severe drought seasons.
3.7 Main types of land degradation addressed by the Technology
other
Comments:
IBLI mainly addresses the risk of livestock mortality as a result of severe forage scarcity due to drought.
3.8 Prevention, reduction, or restoration of land degradation
Specify the goal of the Technology with regard to land degradation:
- adapt to land degradation
4. Technical specifications, implementation activities, inputs, and costs
4.1 Technical drawing of the Technology
Technical specifications (related to technical drawing):
Picture 1 &2: Monthly NDVI for each insured unit in a month is derived by averaging the 10-day NDVI values for each Insured Unit over the three 10-days periods in each month, where the 10-day NDVI value for each Insured Unit is derived by averaging the pixel-level NDVI of all the pixels that fall within the insured unit boundary.
Picture 3: An accumulation of monthly NDVI over the critical months of each season starting from the beginning of the season (March for LRLD and October for SRSD).
Picture 4: There is a representation of a cumulation of monthly NDVI (CumNDVI) which represents the evolution of green vegetation and can be used as a proxy of the green biomass that has developed, and as such a proxy of the available forage across the season.
Picture 5: Deviation of Cumulative NDVI from normal conditions of the particular season and insured unit (ZCumNDVI) - is derived by
subtracting CumNDVI derived for each season and each insured unit by the long-term historical average value and dividing by long-term historical standard deviation of the particular season (SRSD or LRLD) in each
insured unit. ZCumNDVI thus measures the deviation from the historical mean,
expressed as a standard deviation. A positive ZCumNDVI value therefore indicates above normal vegetation cover while negative ZNDVI value indicates below normal vegetation. The purpose of this transformation is to provide an indicator that expresses current forage conditions in comparison to average forage conditions for each specific insurance unit
at the prescribed period within the season.
NOTE: The delineations used in this figure are just for purposes of illustration, assuming Kenya as an entire unit. However, IBLI used smaller delineated units which can be seen in the lines with lighter shade within the map.
5. Natural and human environment
5.1 Climate
Annual rainfall
- < 250 mm
- 251-500 mm
- 501-750 mm
- 751-1,000 mm
- 1,001-1,500 mm
- 1,501-2,000 mm
- 2,001-3,000 mm
- 3,001-4,000 mm
- > 4,000 mm
Indicate the name of the reference meteorological station considered:
Kenya Meteorological Department
Agro-climatic zone
- semi-arid
- arid
5.2 Topography
Slopes on average:
- flat (0-2%)
- gentle (3-5%)
- moderate (6-10%)
- rolling (11-15%)
- hilly (16-30%)
- steep (31-60%)
- very steep (>60%)
Landforms:
- plateau/plains
- ridges
- mountain slopes
- hill slopes
- footslopes
- valley floors
Altitudinal zone:
- 0-100 m a.s.l.
- 101-500 m a.s.l.
- 501-1,000 m a.s.l.
- 1,001-1,500 m a.s.l.
- 1,501-2,000 m a.s.l.
- 2,001-2,500 m a.s.l.
- 2,501-3,000 m a.s.l.
- 3,001-4,000 m a.s.l.
- > 4,000 m a.s.l.
Indicate if the Technology is specifically applied in:
- not relevant
5.3 Soils
Soil depth on average:
- very shallow (0-20 cm)
- shallow (21-50 cm)
- moderately deep (51-80 cm)
- deep (81-120 cm)
- very deep (> 120 cm)
Soil texture (topsoil):
- coarse/ light (sandy)
Soil texture (> 20 cm below surface):
- coarse/ light (sandy)
Topsoil organic matter:
- low (<1%)
5.4 Water availability and quality
Ground water table:
< 5 m
Availability of surface water:
poor/ none
Water quality (untreated):
poor drinking water (treatment required)
Is water salinity a problem?
Yes
Is flooding of the area occurring?
No
5.5 Biodiversity
Species diversity:
- medium
Habitat diversity:
- medium
5.6 Characteristics of land users applying the Technology
Sedentary or nomadic:
- Nomadic
Market orientation of production system:
- mixed (subsistence/ commercial)
Off-farm income:
- less than 10% of all income
Relative level of wealth:
- average
Individuals or groups:
- individual/ household
Gender:
- women
- men
Age of land users:
- middle-aged
- elderly
5.7 Average area of land used by land users applying the Technology
- < 0.5 ha
- 0.5-1 ha
- 1-2 ha
- 2-5 ha
- 5-15 ha
- 15-50 ha
- 50-100 ha
- 100-500 ha
- 500-1,000 ha
- 1,000-10,000 ha
- > 10,000 ha
Comments:
Most land is communal.
5.8 Land ownership, land use rights, and water use rights
Land ownership:
- communal/ village
Land use rights:
- communal (organized)
Water use rights:
- communal (organized)
5.9 Access to services and infrastructure
health:
- poor
- moderate
- good
education:
- poor
- moderate
- good
technical assistance:
- poor
- moderate
- good
employment (e.g. off-farm):
- poor
- moderate
- good
markets:
- poor
- moderate
- good
energy:
- poor
- moderate
- good
roads and transport:
- poor
- moderate
- good
drinking water and sanitation:
- poor
- moderate
- good
6. Impacts and concluding statements
6.1 On-site impacts the Technology has shown
Socio-cultural impacts
food security/ self-sufficiency
situation of socially and economically disadvantaged groups
Ecological impacts
Climate and disaster risk reduction
drought impacts
6.2 Off-site impacts the Technology has shown
Reduction of livestock mortality as a result of forage scarcity due to drought.
6.3 Exposure and sensitivity of the Technology to gradual climate change and climate-related extremes/ disasters (as perceived by land users)
Gradual climate change
Gradual climate change
| Season | increase or decrease | How does the Technology cope with it? | |
|---|---|---|---|
| annual rainfall | decrease | moderately |
Climate-related extremes (disasters)
Climatological disasters
| How does the Technology cope with it? | |
|---|---|
| drought | well |
Other climate-related extremes (disasters)
| other (specify) | How does the Technology cope with it? |
|---|---|
| Forage scarcity | well |
6.4 Cost-benefit analysis
How do the benefits compare with the establishment costs (from land users’ perspective)?
Short-term returns:
slightly positive
Long-term returns:
positive
How do the benefits compare with the maintenance/ recurrent costs (from land users' perspective)?
Short-term returns:
positive
Long-term returns:
positive
6.5 Adoption of the Technology
- 11-50%
If available, quantify (no. of households and/ or area covered):
over 25,000 households
Of all those who have adopted the Technology, how many did so spontaneously, i.e. without receiving any material incentives/ payments?
- 11-50%
6.6 Adaptation
Has the Technology been modified recently to adapt to changing conditions?
No
6.7 Strengths/ advantages/ opportunities of the Technology
| Strengths/ advantages/ opportunities in the land user’s view |
|---|
| The use NDVI for forage monitoring in provision of IBLI eliminates the high costs of loss verification which would otherwise be expensive and consuming in the case of vast and remote ASALs of Kenya. |
| Strengths/ advantages/ opportunities in the compiler’s or other key resource person’s view |
|---|
| IBLI contract design is based on robust scientific design which is easily verifiable hence boosting trust in the product. |
6.8 Weaknesses/ disadvantages/ risks of the Technology and ways of overcoming them
| Weaknesses/ disadvantages/ risks in the land user’s view | How can they be overcome? |
|---|---|
| A key concern of index-insurance products is that there might occur variances in perceived loss versus the actual payouts (basis risk) | Proper contract design should be backed with ground truthing efforts together with awareness creation. |
| Weaknesses/ disadvantages/ risks in the compiler’s or other key resource person’s view | How can they be overcome? |
|---|---|
| Basis risk is a weakness with IBLI as they could arise differences in perceived level of forage scarcity by the clients, | vis a vis the index trigger level indicated by the NDVI data. Increased precision in contract design alongside proper capacity and awareness creation to the pastoralists can help mitigate this challenge. |
7. References and links
7.1 Methods/ sources of information
- compilation from reports and other existing documentation
When were the data compiled (in the field)?
24/01/2018
7.2 References to available publications
Title, author, year, ISBN:
Chelang'a et. al 2017
Title, author, year, ISBN:
Tucker et al., 2005
7.3 Links to relevant online information
Title/ description:
IBLI website
URL:
https://ibli.ilri.org/
Links and modules
Expand all Collapse allLinks
No links
Modules
No modules