Field Margin Strips [Netherlands]
- Creation:
- Update:
- Compiler: Alan Radbourne
- Editors: David Robinson, David Norris, Sabine Reinsch
- Reviewers: Renate Fleiner, Rima Mekdaschi Studer
Akkerrand
technologies_5187 - Netherlands
View sections
Expand all Collapse all1. General information
1.2 Contact details of resource persons and institutions involved in the assessment and documentation of the Technology
Key resource person(s)
co-compiler:
Van Rijn Paul
University of Amsterdam, Institute of Biodiversity and Ecosystem Dynamics (IBED)
Netherlands
land user:
Klompe Mellany
Klompe Grondbeheer
Netherlands
Name of project which facilitated the documentation/ evaluation of the Technology (if relevant)
European Interreg project FABulous FarmersName of the institution(s) which facilitated the documentation/ evaluation of the Technology (if relevant)
UK Centre for Ecology & Hydrology (CEH) - United Kingdom1.3 Conditions regarding the use of data documented through WOCAT
The compiler and key resource person(s) accept the conditions regarding the use of data documented through WOCAT:
Yes
1.4 Declaration on sustainability of the described Technology
Is the Technology described here problematic with regard to land degradation, so that it cannot be declared a sustainable land management technology?
No
2. Description of the SLM Technology
2.1 Short description of the Technology
Definition of the Technology:
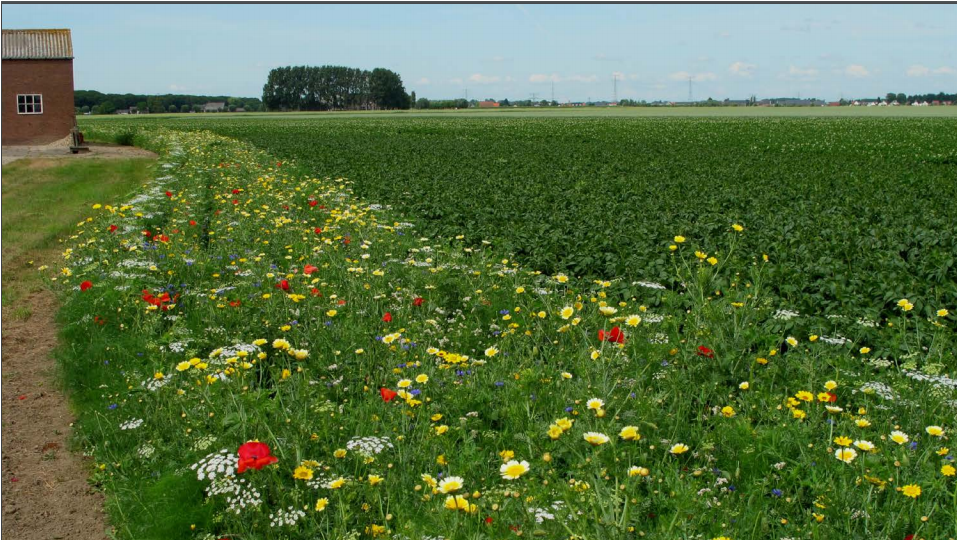
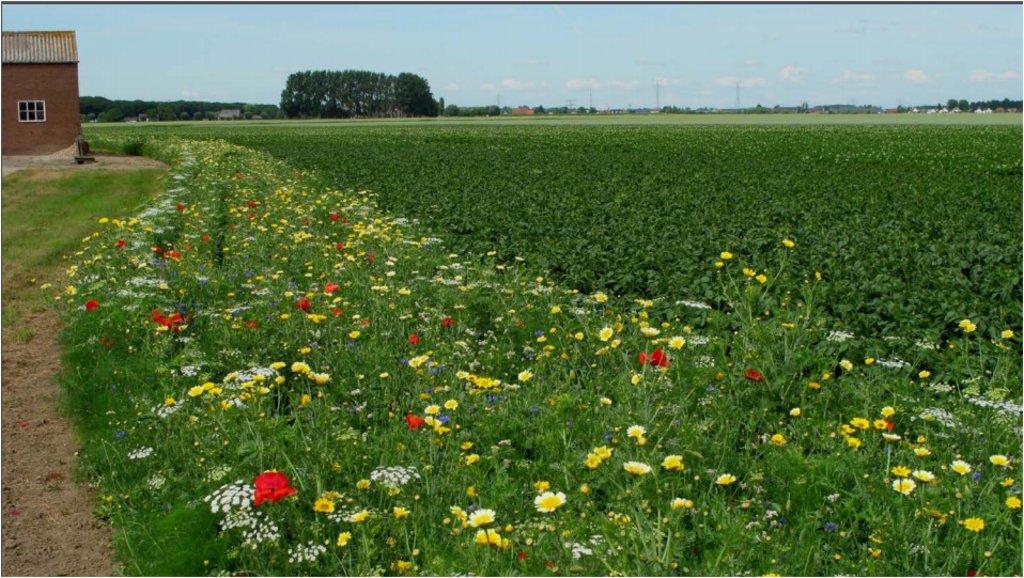
Create strips with flowering plants in the margins of arable fields.
2.2 Detailed description of the Technology
Description:
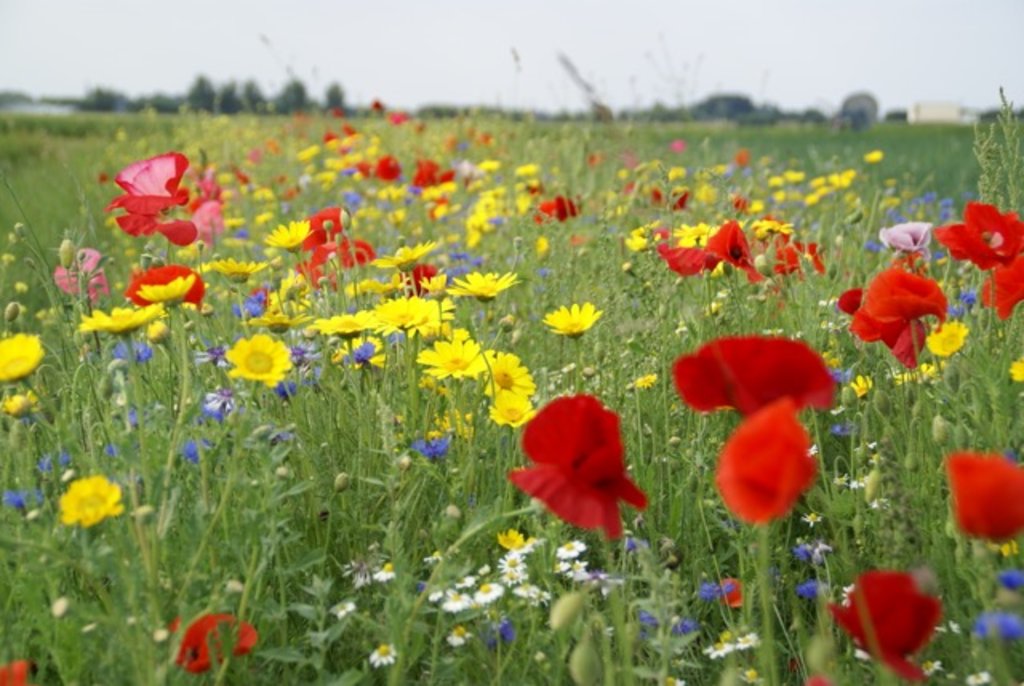
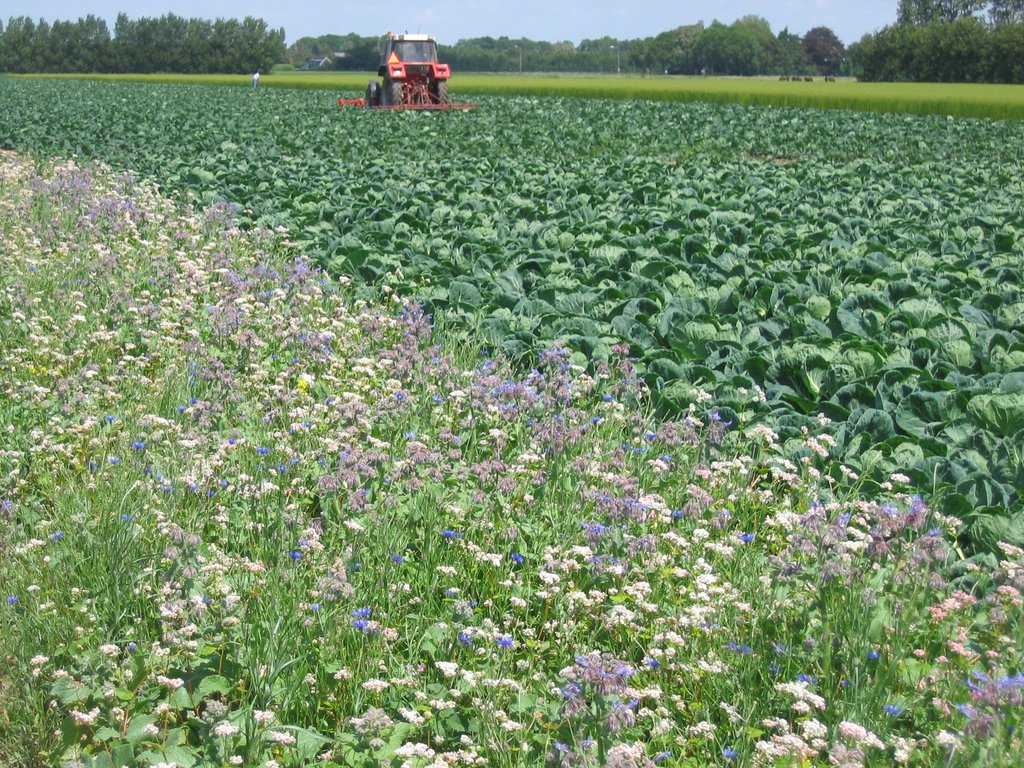
In the Hoeksche Waard area (Netherlands), field margin strips between 2 and 20 meters wide have been sown in the margins of arable or vegetable crop fields with a mixture of native flowering plant species, with plant species targeted to encourage certain target insect abundances. A mixture of annual flowers are sown in spring (April or May), or perennial plant mixtures (flowers and grasses) sown also in spring, or prefernetially in late summer (September). Annual flower strips produce flowers mostly in summer, whereas perennial strips produce mostly flowers in the following spring and following years.
The purpose of flower strips is to support the natural pest control and pollination by native insect species for reduced disease and increased production. Many flying natural enemies of pests require pollen and/or nectar in the adult stage for survival and reproduction, needing food on a regular basis, so must be in short range from the crop fields, i.e. in the margin of or within the field. Pollinators also need food when the crop is not flowering in order to build up a local population.
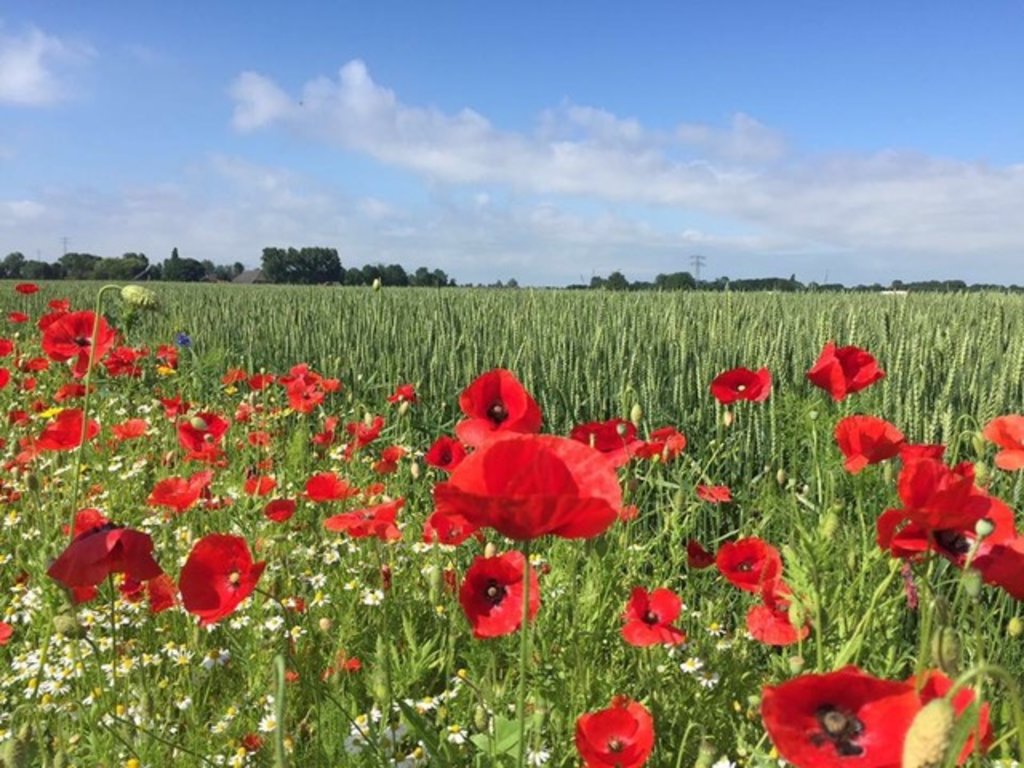
For the implementation of field margin strips to be successful, knowledge of the plant species mixtures was requried to know what would grow well in this semi-humid, deep heavy soil, agricultural environment, as well as growing well together with the right characteristics to support the target insect groups. For example, most natural enemies have small mouth parts and can only feed on nectar from shallow flowers, thus require a specific seed mix (<2 cm deep, see Van Rijn & Wäckers, Journal of Applied Ecology 2016). Here, the species were selected for their ability to support natural enemies of aphids (such as hoverflies) or wild bees, especially bumblebees. The first group includes flowers with accessible nectar (< 2 cm deep) such as Apiaceae, buckwheat, cornflower, and Asteraceae with shallow florets. The second group includes red clover, lotus and other Fabaceae, as well as Asteraceae with deeper florets (such as sunflowers). Perennial mixtures are generally supplemented with annual flowers (cornflowers and poppies) that already produce flowers the first year, as well as (slow growing) grass species (Festuca) to make the strips more robust when incidentally used as tractor paths.
Additionally for implementation, knowledge on how to effectivly use the seed sowing machines, with special care required for preparing the seed bed in advance, to prevent segregation of bigger and smaller seed in the machine, and for sowing the seeds not to deep and the field margin strips should be maintained for a number of years to allow for a local build up of beneficial insect populations. Another considertation is the farming practise and the surrounding landscape as it should provide other resources needed by the insect population, such as hibernation habitat and bee nesting sites or additional (prey and flower providing) habitats for other generations of natural enemies.
The benefits are multiple. The reduced need to use insecticides, especially against aphids, increases the capacity for pollination and reduces the need to manage honeybees, although regular scouting of pest and natural enimies in the adjacent crop field is required to ensure benefits. The strip acts as a buffer to reduce the drift of fertilisers and pesticides into adjacent ditches and water courses. And, there is a social benefit with an increased appreciaiton of the arable landscape by citizens enjoying the mosaic of flowers and crops in the landscape.
The technology overall has been a great success, yet does have a small number of draw backs to be aware of and manage effectivly. Weeds usually occur in the year of sowing and there can be some dislike of the rough nature of the vegetation compared to crop fields. To help manage these challenges field margin strips are sometimes mown while still flowering, ideally mowing is done only once a year and at the end of the growing season (September).
The compilation of this SLM is a part of the European Interreg project FABulous Farmers which aims to reduce the reliance on external inputs by encouraging the use of methods and interventions that increase the farm’s Functional AgroBiodiversity (FAB). Visit www.fabulousfarmers.eu and www.nweurope.eu/Fabulous-Farmers for more information.
2.3 Photos of the Technology
2.4 Videos of the Technology
Comments, short description:
Field margins for Functional Agro Biodiversity in the Hoeksche Waard, The Netherlands
Flowers in fieldmargins of areable farms attrack pestcontrolling insects. Flowers feed the insects by nectar and pollen. The larvae of the insects eat aphids in the crops. The flowers keep the crops free of aphids. A clever way of making use of the power of nature.
https://www.youtube.com/watch?v=w4mBTvYKVYw
Date:
28/01/2014
Location:
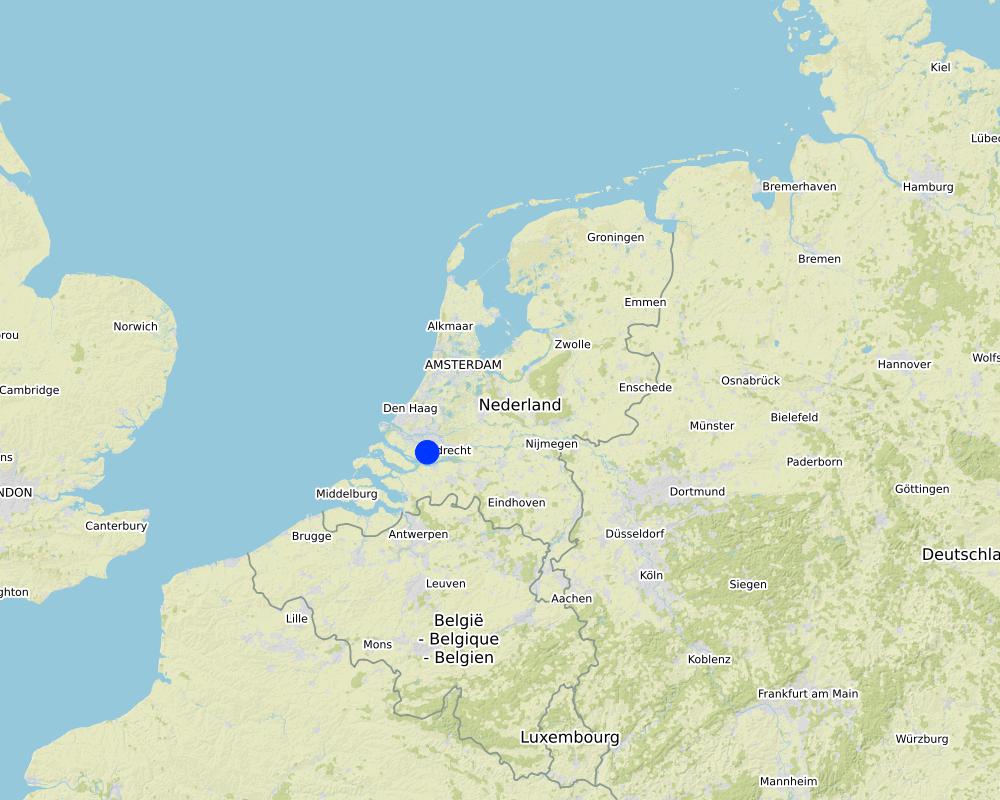
Hoeksche Waard
2.5 Country/ region/ locations where the Technology has been applied and which are covered by this assessment
Country:
Netherlands
Region/ State/ Province:
Hoeksche Waard (Zuid-Holland)
Specify the spread of the Technology:
- evenly spread over an area
If the Technology is evenly spread over an area, specify area covered (in km2):
150.0
If precise area is not known, indicate approximate area covered:
- 100-1,000 km2
Is/are the technology site(s) located in a permanently protected area?
No
Comments:
The arable land in the Hoeksche Waard is ca 150 km2. A quarter of the farmers have field margin strips on their farms, with a total of ca 500 km in length.
Latitude: 51.8050
Longitude: 4.4365
Map
×2.6 Date of implementation
Indicate year of implementation:
2005
2.7 Introduction of the Technology
Specify how the Technology was introduced:
- during experiments/ research
- through projects/ external interventions
3. Classification of the SLM Technology
3.1 Main purpose(s) of the Technology
- improve production
- conserve ecosystem
- protect a watershed/ downstream areas – in combination with other Technologies
- preserve/ improve biodiversity
- create beneficial economic impact
- support natural pest control and improve natural pollination by native insect species
3.2 Current land use type(s) where the Technology is applied
Land use mixed within the same land unit:
No

Cropland
- Annual cropping
Annual cropping - Specify crops:
- cereals - wheat (spring)
Number of growing seasons per year:
- 1
Is intercropping practiced?
Yes
If yes, specify which crops are intercropped:
Cereal crops and flowering strips
Is crop rotation practiced?
No
3.3 Has land use changed due to the implementation of the Technology?
Has land use changed due to the implementation of the Technology?
- No (Continue with question 3.4)
3.4 Water supply
Water supply for the land on which the Technology is applied:
- rainfed
3.5 SLM group to which the Technology belongs
- integrated pest and disease management (incl. organic agriculture)
- herbaceous field margin strips
3.6 SLM measures comprising the Technology
vegetative measures
- V2: Grasses and perennial herbaceous plants
management measures
- M7: Others
Comments:
Applying field margin strips for pest control and improved biodiversity
3.7 Main types of land degradation addressed by the Technology
biological degradation
- Bh: loss of habitats
- Bp: increase of pests/ diseases, loss of predators
3.8 Prevention, reduction, or restoration of land degradation
Specify the goal of the Technology with regard to land degradation:
- reduce land degradation
4. Technical specifications, implementation activities, inputs, and costs
4.1 Technical drawing of the Technology
Technical specifications (related to technical drawing):
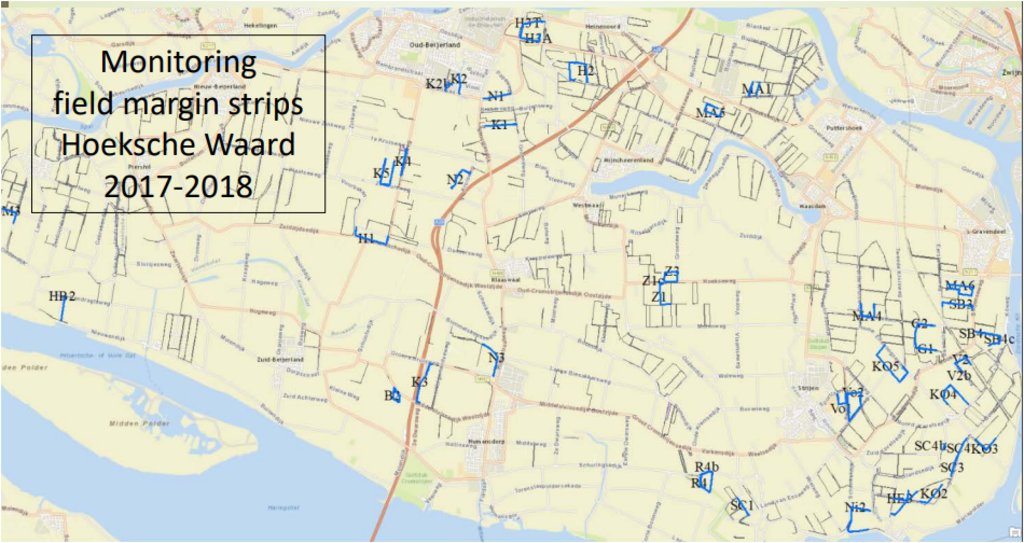
Overview of flower margins in the Hoeksche Waard (in blue).
Field margin strips are typically 3-4 meters wide but can range between 2 and 20 meters in width. They are typically present at all margins surrounding a crop field, especially where the field is delimited by a ditch. Here the land gradient is flat, but margin strips can be applied on any gradient, and would be particually effective at the bowwom of a slope for run off buffer strip benefits.
Author:
Paul van Rijn/Mellany Klompe
Date:
26/06/2019
4.2 General information regarding the calculation of inputs and costs
Specify how costs and inputs were calculated:
- per Technology unit
Specify unit:
1 ha
other/ national currency (specify):
Euro
If relevant, indicate exchange rate from USD to local currency (e.g. 1 USD = 79.9 Brazilian Real): 1 USD =:
0.89
Indicate average wage cost of hired labour per day:
100 euro
4.3 Establishment activities
| Activity | Timing (season) | |
|---|---|---|
| 1. | Creating seed bed using shallow plough to invert weeds and provide bare soil surface o sow seed | 1 month before sowing |
| 2. | Fertiliser application (as required) | Just before or with sowing |
| 3. | Sowing seed. Annual flowers are typically sown in rows (30 cm apart), allowing for mechanical weed control (once or twice) in between the rows. Perennial strips are broadcast sown (at a density of 18 kg/ha) and not weeded. | April/May or September |
| 4. | Weeding using machinery (of annual strips) | 1 month after sowing |
| 5. | Mowing using machenery | 1 month after sowing |
| 6. | Ploughing (when strips are removed or resown) | after mowing |
4.4 Costs and inputs needed for establishment
| Specify input | Unit | Quantity | Costs per Unit | Total costs per input | % of costs borne by land users | |
|---|---|---|---|---|---|---|
| Labour | Farm worker | person-days | 2.5 | 100.0 | 250.0 | 100.0 |
| Equipment | Tractor | machine-days | 2.5 | 50.0 | 125.0 | 100.0 |
| Equipment | Sowing machine | machine-days | 0.75 | 50.0 | 37.5 | 100.0 |
| Equipment | Plough | machine-days | 1.5 | 50.0 | 75.0 | 100.0 |
| Equipment | Mower | machine-days | 0.75 | 50.0 | 37.5 | 100.0 |
| Plant material | Seed mix | kg | 18.0 | 40.0 | 720.0 | |
| Fertilizers and biocides | Fertilizer | kg | 100.0 | 2.0 | 200.0 | |
| Total costs for establishment of the Technology | 1445.0 | |||||
| Total costs for establishment of the Technology in USD | 1623.6 | |||||
4.5 Maintenance/ recurrent activities
| Activity | Timing/ frequency | |
|---|---|---|
| 1. | Mowing | Once per year |
4.6 Costs and inputs needed for maintenance/ recurrent activities (per year)
| Specify input | Unit | Quantity | Costs per Unit | Total costs per input | % of costs borne by land users | |
|---|---|---|---|---|---|---|
| Labour | Farm worker | person-days | 0.75 | 100.0 | 75.0 | 100.0 |
| Equipment | Tractor | machine-days | 0.75 | 50.0 | 37.5 | 100.0 |
| Equipment | Mower | machine-days | 0.75 | 50.0 | 37.5 | 100.0 |
| Total costs for maintenance of the Technology | 150.0 | |||||
| Total costs for maintenance of the Technology in USD | 168.54 | |||||
4.7 Most important factors affecting the costs
Describe the most determinate factors affecting the costs:
Seed mixture choice can vary in price and weed control can be challenging
5. Natural and human environment
5.1 Climate
Annual rainfall
- < 250 mm
- 251-500 mm
- 501-750 mm
- 751-1,000 mm
- 1,001-1,500 mm
- 1,501-2,000 mm
- 2,001-3,000 mm
- 3,001-4,000 mm
- > 4,000 mm
Specify average annual rainfall (if known), in mm:
800.00
Indicate the name of the reference meteorological station considered:
Rotterdam
Agro-climatic zone
- sub-humid
5.2 Topography
Slopes on average:
- flat (0-2%)
- gentle (3-5%)
- moderate (6-10%)
- rolling (11-15%)
- hilly (16-30%)
- steep (31-60%)
- very steep (>60%)
Landforms:
- plateau/plains
- ridges
- mountain slopes
- hill slopes
- footslopes
- valley floors
Altitudinal zone:
- 0-100 m a.s.l.
- 101-500 m a.s.l.
- 501-1,000 m a.s.l.
- 1,001-1,500 m a.s.l.
- 1,501-2,000 m a.s.l.
- 2,001-2,500 m a.s.l.
- 2,501-3,000 m a.s.l.
- 3,001-4,000 m a.s.l.
- > 4,000 m a.s.l.
Indicate if the Technology is specifically applied in:
- not relevant
5.3 Soils
Soil depth on average:
- very shallow (0-20 cm)
- shallow (21-50 cm)
- moderately deep (51-80 cm)
- deep (81-120 cm)
- very deep (> 120 cm)
Soil texture (topsoil):
- fine/ heavy (clay)
Soil texture (> 20 cm below surface):
- fine/ heavy (clay)
Topsoil organic matter:
- medium (1-3%)
5.4 Water availability and quality
Ground water table:
< 5 m
Availability of surface water:
good
Water quality (untreated):
for agricultural use only (irrigation)
Water quality refers to:
surface water
Is water salinity a problem?
No
Is flooding of the area occurring?
No
5.5 Biodiversity
Species diversity:
- low
Habitat diversity:
- low
5.6 Characteristics of land users applying the Technology
Sedentary or nomadic:
- Sedentary
Market orientation of production system:
- commercial/ market
Off-farm income:
- less than 10% of all income
Relative level of wealth:
- average
Individuals or groups:
- individual/ household
Level of mechanization:
- mechanized/ motorized
Gender:
- women
- men
Age of land users:
- middle-aged
5.7 Average area of land used by land users applying the Technology
- < 0.5 ha
- 0.5-1 ha
- 1-2 ha
- 2-5 ha
- 5-15 ha
- 15-50 ha
- 50-100 ha
- 100-500 ha
- 500-1,000 ha
- 1,000-10,000 ha
- > 10,000 ha
Is this considered small-, medium- or large-scale (referring to local context)?
- small-scale
5.8 Land ownership, land use rights, and water use rights
Land ownership:
- individual, not titled
Land use rights:
- leased
- individual
Water use rights:
- communal (organized)
Are land use rights based on a traditional legal system?
No
Specify:
land use rights are traded
5.9 Access to services and infrastructure
health:
- poor
- moderate
- good
education:
- poor
- moderate
- good
technical assistance:
- poor
- moderate
- good
employment (e.g. off-farm):
- poor
- moderate
- good
markets:
- poor
- moderate
- good
energy:
- poor
- moderate
- good
roads and transport:
- poor
- moderate
- good
drinking water and sanitation:
- poor
- moderate
- good
financial services:
- poor
- moderate
- good
6. Impacts and concluding statements
6.1 On-site impacts the Technology has shown
Socio-economic impacts
Production
crop production
Comments/ specify:
Increased crop yeild from improved pollination
crop quality
Comments/ specify:
Increased crop health with reduced pests
Income and costs
expenses on agricultural inputs
Comments/ specify:
Less pesticides required due to better natural pest control
farm income
Comments/ specify:
Cost of implementation offset by larger crop yield and health
workload
Comments/ specify:
Implementation and management of flower strip takes longer than using whole field for single crop
Socio-cultural impacts
food security/ self-sufficiency
Comments/ specify:
Less reliance on pesticide input
recreational opportunities
Comments/ specify:
Social apprication of flowers from public
Ecological impacts
Water cycle/ runoff
water quality
Comments/ specify:
Less pesticide use leading to less being washed into adjacent ditches
Soil
soil loss
Comments/ specify:
Buffer strip adjacent to ditch reduces surface run off from field
Biodiversity: vegetation, animals
Vegetation cover
Comments/ specify:
Margin strips have greater land surace coverage than crops
plant diversity
Comments/ specify:
Large diversity in margins
animal diversity
Comments/ specify:
Habitat and forage for a range of biodoversity
beneficial species
Comments/ specify:
Targeted to pollinators and natural pest control species
habitat diversity
Comments/ specify:
Habitat and forage for a range of biodoversity
pest/ disease control
Comments/ specify:
Targeted to improve natural pest control species
6.2 Off-site impacts the Technology has shown
buffering/ filtering capacity
Comments/ specify:
Buffer strip adjacent to ditch reduces surface run off from field of soil, fertilisers and chemicals
6.3 Exposure and sensitivity of the Technology to gradual climate change and climate-related extremes/ disasters (as perceived by land users)
Climate-related extremes (disasters)
Biological disasters
| How does the Technology cope with it? | |
|---|---|
| insect/ worm infestation | very well |
6.4 Cost-benefit analysis
How do the benefits compare with the establishment costs (from land users’ perspective)?
Short-term returns:
slightly negative
Long-term returns:
neutral/ balanced
How do the benefits compare with the maintenance/ recurrent costs (from land users' perspective)?
Short-term returns:
slightly negative
Long-term returns:
neutral/ balanced
Comments:
Evaluation based on no subsidies; with subsidies the returns are balanced or slightly positive.
6.5 Adoption of the Technology
- 11-50%
Of all those who have adopted the Technology, how many did so spontaneously, i.e. without receiving any material incentives/ payments?
- 0-10%
6.6 Adaptation
Has the Technology been modified recently to adapt to changing conditions?
Yes
other (specify):
changing CAP subsidy regulations
Specify adaptation of the Technology (design, material/ species, etc.):
CAP subsidy regulations are financial supports for land management, changes since technology implementation have supported the use of flower margin strips making the implementaiton more favorable. More general information on CAP can be found here: https://ec.europa.eu/info/food-farming-fisheries/key-policies/common-agricultural-policy/cap-glance_en#documents
6.7 Strengths/ advantages/ opportunities of the Technology
| Strengths/ advantages/ opportunities in the land user’s view |
|---|
| Use of land difficult for agricultural practices can be used |
| Community building when implemented across an area, connecting farmers together and connection to the public who appreciate more flowers in thier landscape |
| Strengths/ advantages/ opportunities in the compiler’s or other key resource person’s view |
|---|
| New habitat for wildlife, including pollinators and natural pest controls: increased numbers of flowering plants increased numbers of bees, hoverflies and natural enemies |
| Multifunctionality of flower margins makes them more cost effective; e.g. flower margins close to ditches increases macrofauna diversity in waters |
| Bufferzone for surface water pollution |
| Recreational (human health) benefits |
6.8 Weaknesses/ disadvantages/ risks of the Technology and ways of overcoming them
| Weaknesses/ disadvantages/ risks in the land user’s view | How can they be overcome? |
|---|---|
| Additional work & costs sowing and maintaining the flower margins compared to leaving the areas unused | Community effort of the Hoeksche Waard reduces individual efforts |
| Weaknesses/ disadvantages/ risks in the compiler’s or other key resource person’s view | How can they be overcome? |
|---|---|
| Without subsidy the implementation costs can be prohibitive | Ensure subsidies available for continued sustainable land use. |
7. References and links
7.1 Methods/ sources of information
- field visits, field surveys
farmer-centric meetings in the Hoeksche Waard
- interviews with land users
farmer-centric meetings in the Hoeksche Waard
Comments:
Compiled during 2019-20 to summarise implementation between 2005 - 2019.
7.3 Links to relevant online information
Title/ description:
Research on field margins by the University of Amsterdam
URL:
https://ibed.uva.nl/content/news/2019/02/importance-of-flower-strips-in-arable-fields.html?1570545036515
Links and modules
Expand all Collapse allLinks
No links
Modules
No modules


