
Vegetative cross-slope barriers [Kenya]
- Creation:
- Update:
- Compiler: William Akwanyi
- Editors: George Onyango, Innocent Faith, Noel Templer, Tabitha Nekesa, Ahmadou Gaye, Siagbé Golli
- Reviewers: William Critchley, Rima Mekdaschi Studer, Sally Bunning
technologies_6705 - Kenya
View sections
Expand all Collapse all1. General information
1.2 Contact details of resource persons and institutions involved in the assessment and documentation of the Technology
Key resource person(s)
land user:
Osundwa Amirah Munyolo
Welthungerhilfe farmer
Kenya
SLM specialist:
SLM specialist:
1.3 Conditions regarding the use of data documented through WOCAT
The compiler and key resource person(s) accept the conditions regarding the use of data documented through WOCAT:
Yes
1.4 Declaration on sustainability of the described Technology
Is the Technology described here problematic with regard to land degradation, so that it cannot be declared a sustainable land management technology?
No
Comments:
The technology has shown positive result (increased production) where it has been implemented. No adverse impacts have been reported.
1.5 Reference to Questionnaire(s) on SLM Approaches (documented using WOCAT)
Promotion of different trees for agroforestry [Kenya]
Promoting the values of different trees and their benefits in agroforestry contributes to increased adoption by farmers.
- Compiler: William Akwanyi
2. Description of the SLM Technology
2.1 Short description of the Technology
Definition of the Technology:
Cross-slope barriers in the form of vegetative strips are established on sloping lands to reduce runoff velocity and prevent soil loss, thereby contributing to the conservation of soil, water, and plant nutrients.
2.2 Detailed description of the Technology
Description:
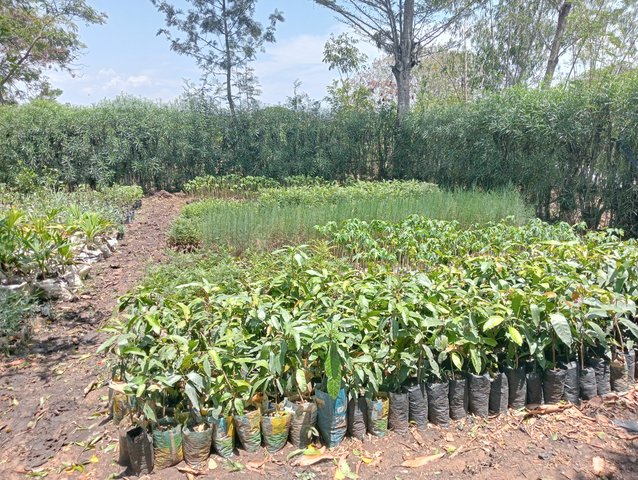
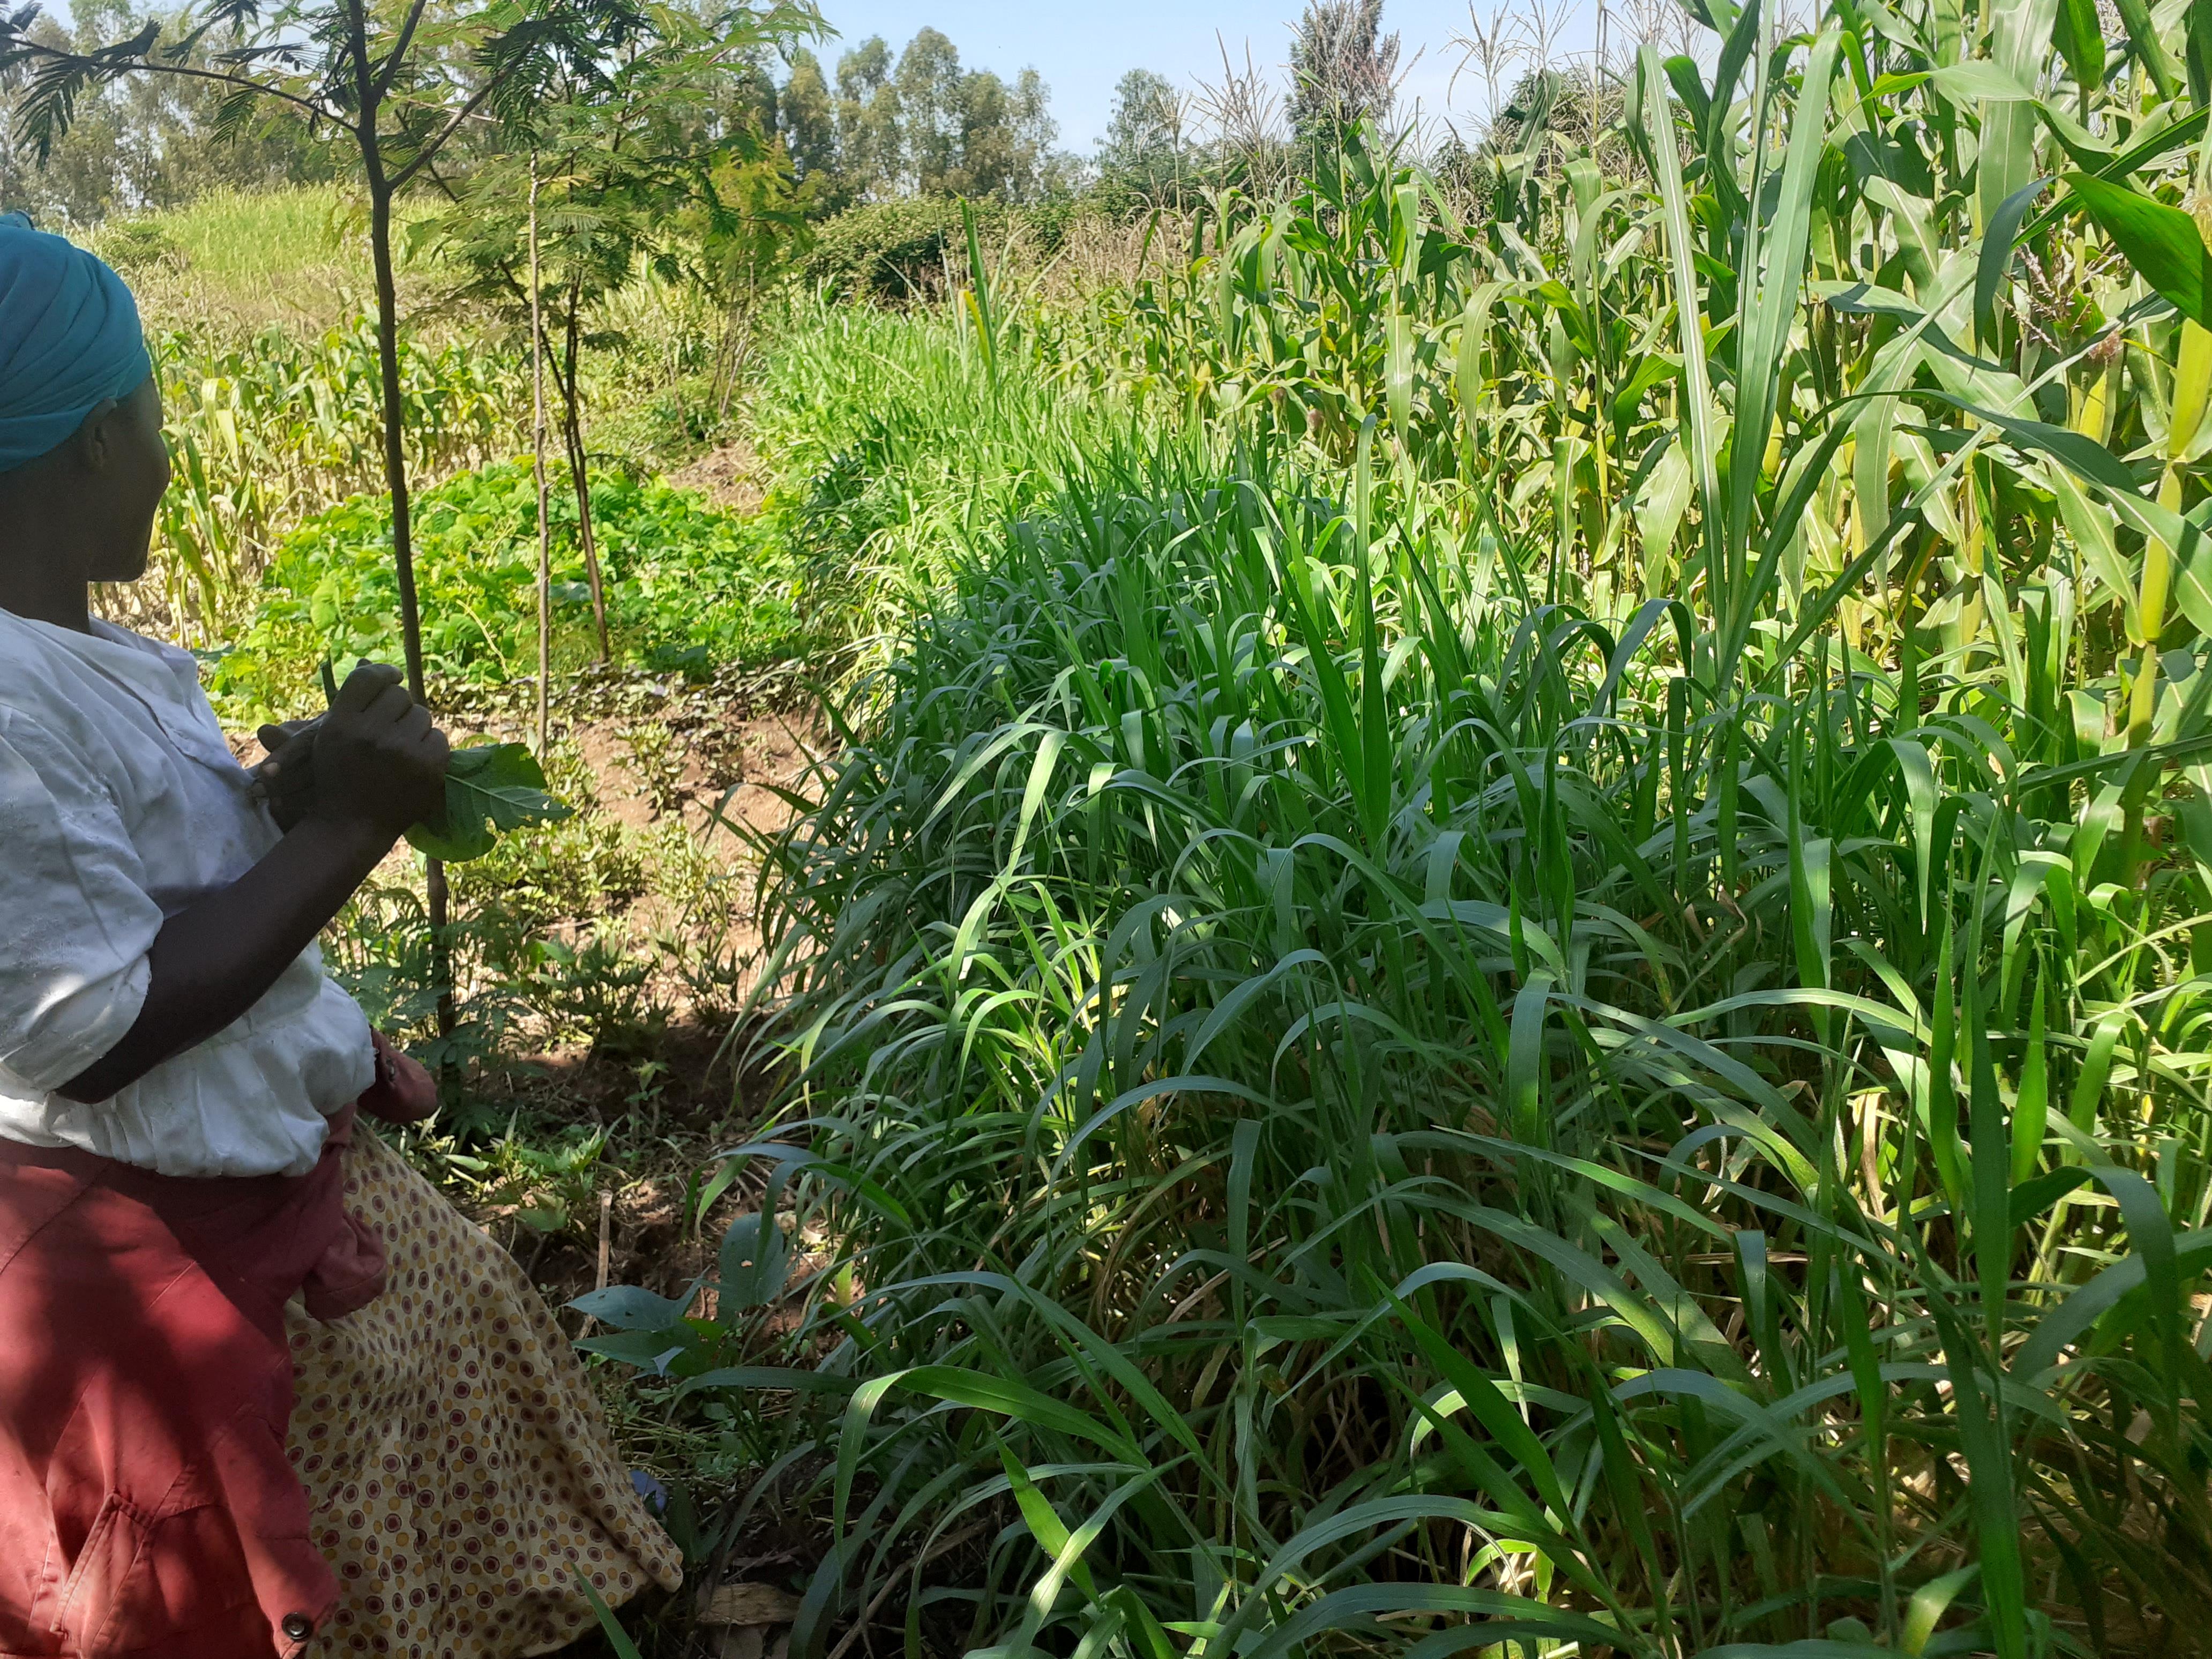
Vegetative cross-slope barriers are strips of perennial plants that are established along the contours of sloping lands. They act as soil and water conservation measures to reduce runoff velocity and consequently prevent soil loss. The strips are mostly between 0.3 m and 1.5 m wide and consist initially of one or two rows of plants. They slow down the speed of runoff during heavy rainfall. This facilitates infiltration, and eroded sediment in the runoff is trapped on the upslope side of the barriers. Hence, they contribute to the conservation of soil, water, and plant nutrients. The most used plants/ crops used in establishing vegetative cross-slope barriers are perennial erect grasses, including Brachiaria sp., napier grass (Pennisetum purpureum), and vetiver grass (Vetiver zizanioides). Depending on species (vetiver being an exception), vegetative cross-slope barriers can serve as important sources of fodder for livestock. Some farmers prefer to establish crops (e.g., bananas and pineapples) or trees and shrubs (e.g., (e.g., Calliandra calothyrus, Grevillea robusta or Sesbania sesban) as cross-slope barriers at appropriate spacing (depending on the tree/ shrub) to serve as windbreakers as well as providing additional measures to control soil erosion. Alternatively, these may be combined with grasses. These can also serve as important sources of food, fodder, fuel, and timber.
In establishing vegetative cross-slope barriers, the distance between the barriers is dictated by the slope of the land. The ProSoil project through Welthungerhilfe trained Community Resource Persons (CRPs) on how to survey contours using a line level. The CRPs by extension train farmers on how to measure slope for their fields and how to determine the distance between the barriers using a predetermined scale. Once established, minimal labour is required for maintenance. The main vegetation (grasses) must be harvested or cut back to a height of less than 0.5 m before planting a crop in the main field to prevent them from suppressing the crops through shading. The trees, and shrubs may need to be trimmed (coppiced) during the cropping period to allow adequate sunlight to reach the crops. The cut material can be collected and used as fodder or firewood as appropriate or be incorporated during land preparation, or during weeding as mulch.
Farmers like the technology because it contributes to soil, water, and nutrient conservation and it reduces the steepness of the slope as soil eroded from the upper part of the slope accumulates on the upslope side of the barrier resulting, eventually, in distinct terrace-like benches. As a result, farmers find it easier to cultivate on these terraces. Vegetative cross-slope barriers can be associated with retention ditches, especially where farmers find it important to harvest the water. They can also provide firewood and fodder, especially where palatable cut and carry varieties of grass are used.
2.3 Photos of the Technology
Media Gallery
2.5 Country/ region/ locations where the Technology has been applied and which are covered by this assessment
Country:
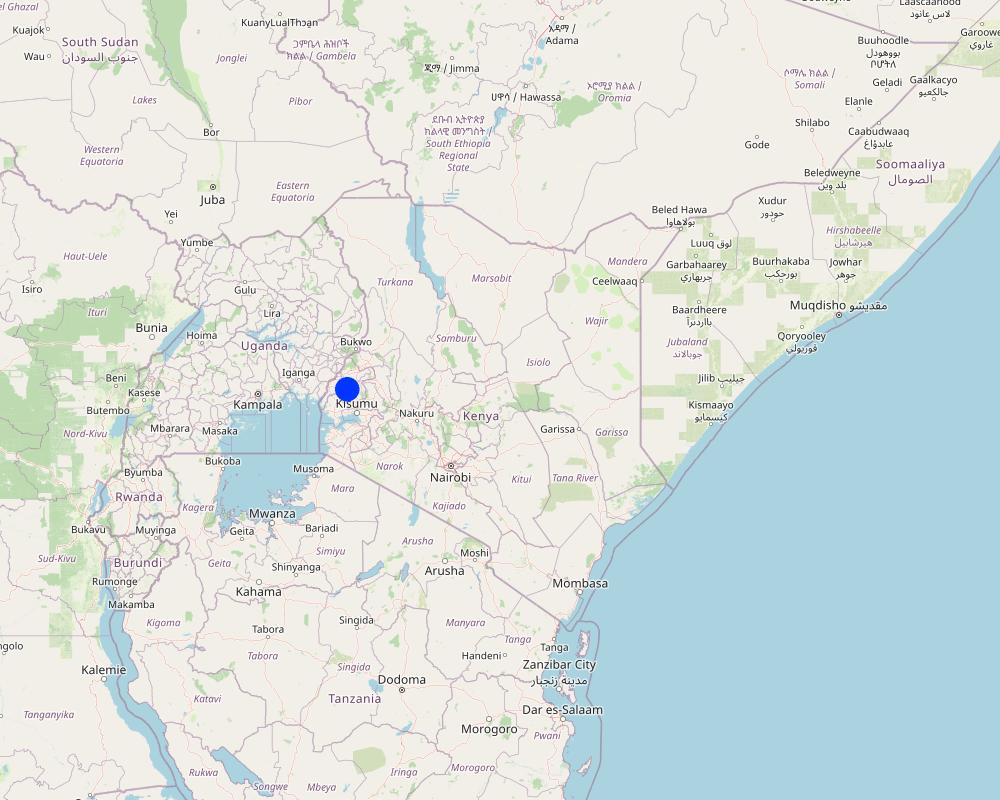
Kenya
Region/ State/ Province:
Kakamega County in western Kenya
Further specification of location:
Khalaba Ward, Matungu Sub-county in Kakamega County
Specify the spread of the Technology:
- evenly spread over an area
If the Technology is evenly spread over an area, specify area covered (in km2):
0.003804
Is/are the technology site(s) located in a permanently protected area?
No
Map
×2.6 Date of implementation
Indicate year of implementation:
2019
2.7 Introduction of the Technology
Specify how the Technology was introduced:
- as part of a traditional system (> 50 years)
- through projects/ external interventions
Comments (type of project, etc.):
The technology has been practiced by some farmers in the past. The ProSoil project came in to improve on the farmers' knowledge about the technology and incorporated improvements in terms of slope measurements to determine where to locate the barriers on the farm.
3. Classification of the SLM Technology
3.1 Main purpose(s) of the Technology
- improve production
- reduce, prevent, restore land degradation
- protect a watershed/ downstream areas – in combination with other Technologies
- preserve/ improve biodiversity
- adapt to climate change/ extremes and its impacts
3.2 Current land use type(s) where the Technology is applied
Land use mixed within the same land unit:
Yes
Specify mixed land use (crops/ grazing/ trees):
- Agroforestry

Cropland
- Annual cropping
- Perennial (non-woody) cropping
- Tree and shrub cropping
Annual cropping - Specify crops:
- fodder crops - other
- fodder crops - grasses
- fodder crops - clover
- oilseed crops - groundnuts
- cereals - maize
- legumes and pulses - beans
- legumes and pulses - soya
- root/tuber crops - cassava
Annual cropping system:
Maize/sorghum/millet intercropped with legume
Tree and shrub cropping - Specify crops:
- fodder trees (Calliandra, Leucaena leucocephala, Prosopis, etc.)
- avocado
- fruits, other
- mango, mangosteen, guava
Number of growing seasons per year:
- 2
Specify:
Crops are grown during the long and short rain seasons.
Is intercropping practiced?
Yes
If yes, specify which crops are intercropped:
Cereals intercropped with legumes.
Is crop rotation practiced?
Yes
If yes, specify:
Some of the plots are fallowed to allow soil regeneration.

Grazing land
Intensive grazing/ fodder production:
- Cut-and-carry/ zero grazing
- Improved pastures
Animal type:
- cattle - dairy and beef (e.g. zebu)
- poultry
Is integrated crop-livestock management practiced?
Yes
If yes, specify:
Manure from livestock is applied to the soil. Crops used on the slope barriers are fodder for livestock.
Products and services:
- economic security, investment prestige
- milk
- manure as fertilizer/ energy production
- eggs
- meat
Species:
cattle - dairy and beef (e.g. zebu)
Count:
3
Species:
poultry
Count:
10
3.3 Has land use changed due to the implementation of the Technology?
Has land use changed due to the implementation of the Technology?
- No (Continue with question 3.4)
3.4 Water supply
Water supply for the land on which the Technology is applied:
- rainfed
3.5 SLM group to which the Technology belongs
- agroforestry
- integrated crop-livestock management
- cross-slope measure
3.6 SLM measures comprising the Technology

vegetative measures
- V1: Tree and shrub cover
- V2: Grasses and perennial herbaceous plants
3.7 Main types of land degradation addressed by the Technology

soil erosion by water
- Wt: loss of topsoil/ surface erosion
- Wg: gully erosion/ gullying
3.8 Prevention, reduction, or restoration of land degradation
Specify the goal of the Technology with regard to land degradation:
- prevent land degradation
- reduce land degradation
Comments:
Reducing land degradation (soil erosion) is a secondary objective of the technology.
4. Technical specifications, implementation activities, inputs, and costs
4.1 Technical drawing of the Technology
Technical specifications (related to technical drawing):
Length of the farm (down the slope): 120 m
Width of the farm (along the contour): 31.7 m
Number of vegetative cross-slop barriers established: 6
Width of barriers: ranges between 0.3 m and 0.5 m
Slope: 4%
Width of the established terraces/ distance between any two barriers: 24 m
Plants used: brachiaria and napier grass (grasses), grevillea and calliandra (trees and shrub), bananas (crops)
1st barrier on the upper side (F) is on a retention ditch
Last barrier (A) is on the upper side of a channel that collects excess runoff and prevents damage to neighbours' farms on the lower side of the farm
Author:
William Akwanyi
Date:
17/02/2023
4.2 General information regarding the calculation of inputs and costs
Specify how costs and inputs were calculated:
- per Technology area
Indicate size and area unit:
0.00761 ha
If using a local area unit, indicate conversion factor to one hectare (e.g. 1 ha = 2.47 acres): 1 ha =:
1 ha = 2.47 acres
other/ national currency (specify):
KES
If relevant, indicate exchange rate from USD to local currency (e.g. 1 USD = 79.9 Brazilian Real): 1 USD =:
124.21352
Indicate average wage cost of hired labour per day:
250
4.3 Establishment activities
| Activity | Timing (season) | |
|---|---|---|
| 1. | Contour surveying to establish locations for the vegetative cross slope barriers | Before planting |
| 2. | Planting | After rains |
4.4 Costs and inputs needed for establishment
If you are unable to break down the costs in the table above, give an estimation of the total costs of establishing the Technology:
8000.0
If land user bore less than 100% of costs, indicate who covered the remaining costs:
The ProSoil project through Welthungerhilfe purchased grass splits and tree seedlings for the farmer(s) and covered the cost of contour surveying.
4.5 Maintenance/ recurrent activities
| Activity | Timing/ frequency | |
|---|---|---|
| 1. | Weeding | After every harvest |
| 2. | Adding manure/ compost | After every harvest |
| 3. | Regular inspection to fill large gaps in the barriers that are 30 Cm or more by replanting | Monthly during the rainy season |
4.6 Costs and inputs needed for maintenance/ recurrent activities (per year)
| Specify input | Unit | Quantity | Costs per Unit | Total costs per input | % of costs borne by land users | |
|---|---|---|---|---|---|---|
| Labour | Weeding | Man-days | 3.0 | 250.0 | 750.0 | 100.0 |
| Labour | Adding manure/ compost | Man-days | 2.0 | 250.0 | 500.0 | 100.0 |
| Equipment | Hoe (jembe) for weeding | No. | 1.0 | 90.0 | 90.0 | 100.0 |
| Equipment | Wheelbarrow for carrying manure/ compost | No. | 1.0 | 500.0 | 500.0 | 100.0 |
| Equipment | Spade for scooping manure/ wheelbarrow | No. | 1.0 | 100.0 | 100.0 | 100.0 |
| Fertilizers and biocides | Manure/ compost | Wheelbarrows | 20.0 | 50.0 | 1000.0 | 100.0 |
| Total costs for maintenance of the Technology | 2940.0 | |||||
| Total costs for maintenance of the Technology in USD | 23.67 | |||||
Comments:
Vegetative cross-slope barriers are productive; hence, the costs are balanced by very quick returns.
4.7 Most important factors affecting the costs
Describe the most determinate factors affecting the costs:
Rate of man-days vary from one place to another and also depend on the kind of work.
Exchange rate for January 2023, source: European Commission/ InfoEuro online at https://commission.europa.eu/funding-tenders/procedures-guidelines-tenders/information-contractors-and-beneficiaries/exchange-rate-inforeuro_en
The stated costs are estimates.
5. Natural and human environment
5.1 Climate
Annual rainfall
- < 250 mm
- 251-500 mm
- 501-750 mm
- 751-1,000 mm
- 1,001-1,500 mm
- 1,501-2,000 mm
- 2,001-3,000 mm
- 3,001-4,000 mm
- > 4,000 mm
Specify average annual rainfall (if known), in mm:
1200.00
Specifications/ comments on rainfall:
Rainfall pattern is bimodal. Monthly rainfall variability is high with some months such as January recording less than 5 mm of total rainfall.
Indicate the name of the reference meteorological station considered:
Kakamega Meteorological Station
Agro-climatic zone
- humid
5.2 Topography
Slopes on average:
- flat (0-2%)
- gentle (3-5%)
- moderate (6-10%)
- rolling (11-15%)
- hilly (16-30%)
- steep (31-60%)
- very steep (>60%)
Landforms:
- plateau/plains
- ridges
- mountain slopes
- hill slopes
- footslopes
- valley floors
Altitudinal zone:
- 0-100 m a.s.l.
- 101-500 m a.s.l.
- 501-1,000 m a.s.l.
- 1,001-1,500 m a.s.l.
- 1,501-2,000 m a.s.l.
- 2,001-2,500 m a.s.l.
- 2,501-3,000 m a.s.l.
- 3,001-4,000 m a.s.l.
- > 4,000 m a.s.l.
Indicate if the Technology is specifically applied in:
- not relevant
Comments and further specifications on topography:
Farmer's field slope is 4%. Hence, the barriers were spaced 24 m from each other.
5.3 Soils
Soil depth on average:
- very shallow (0-20 cm)
- shallow (21-50 cm)
- moderately deep (51-80 cm)
- deep (81-120 cm)
- very deep (> 120 cm)
Soil texture (topsoil):
- medium (loamy, silty)
Soil texture (> 20 cm below surface):
- medium (loamy, silty)
Topsoil organic matter:
- medium (1-3%)
5.4 Water availability and quality
Ground water table:
5-50 m
Availability of surface water:
good
Water quality (untreated):
poor drinking water (treatment required)
Water quality refers to:
both ground and surface water
Is water salinity a problem?
No
Is flooding of the area occurring?
No
5.5 Biodiversity
Species diversity:
- high
Habitat diversity:
- medium
Comments and further specifications on biodiversity:
The area has high agrobiodiversity since most farms are under crops and trees.
5.6 Characteristics of land users applying the Technology
Sedentary or nomadic:
- Semi-nomadic
Market orientation of production system:
- mixed (subsistence/ commercial)
Off-farm income:
- > 50% of all income
Relative level of wealth:
- average
Individuals or groups:
- individual/ household
Level of mechanization:
- manual work
Gender:
- women
- men
Age of land users:
- youth
- middle-aged
5.7 Average area of land used by land users applying the Technology
- < 0.5 ha
- 0.5-1 ha
- 1-2 ha
- 2-5 ha
- 5-15 ha
- 15-50 ha
- 50-100 ha
- 100-500 ha
- 500-1,000 ha
- 1,000-10,000 ha
- > 10,000 ha
Is this considered small-, medium- or large-scale (referring to local context)?
- medium-scale
5.8 Land ownership, land use rights, and water use rights
Land ownership:
- individual, not titled
- individual, titled
Land use rights:
- individual
Water use rights:
- open access (unorganized)
- individual
Are land use rights based on a traditional legal system?
No
5.9 Access to services and infrastructure
health:
- poor
- moderate
- good
education:
- poor
- moderate
- good
technical assistance:
- poor
- moderate
- good
employment (e.g. off-farm):
- poor
- moderate
- good
markets:
- poor
- moderate
- good
energy:
- poor
- moderate
- good
roads and transport:
- poor
- moderate
- good
drinking water and sanitation:
- poor
- moderate
- good
financial services:
- poor
- moderate
- good
6. Impacts and concluding statements
6.1 On-site impacts the Technology has shown
Socio-economic impacts
Production
crop production
Quantity before SLM:
2
Quantity after SLM:
6
Comments/ specify:
Quantity refers to the number of 90 Kg bags of maize produced per acre. Although vegetative cross-slope barriers reduced the available space for crops, other SLM technologies such as retention ditches and the use of compost contributed to the increase in the production. According to the farmer, the soil at the farm was highly eroded before the SLM technologies were introduced.
crop quality
Comments/ specify:
Not easy to quantify but according to the farmer, the crops are doing better compared to how they were before the cross-slope barriers were established.
fodder production
Comments/ specify:
the farmer estimates that the amount of napier grass harvested from the farm within a year has increased. Farmer not able to quantify.
fodder quality
Comments/ specify:
Not easy to quantify but according to the farmer, napier grass is doing better compared to how it was before the cross-slope barriers were established.
animal production
Quantity before SLM:
4
Quantity after SLM:
7
Comments/ specify:
Amount of milk produced by one cow during early lactation period.
land management
Comments/ specify:
Easy of working on less eroded soils. A farmer's estimate.
Income and costs
expenses on agricultural inputs
Quantity before SLM:
5000
Quantity after SLM:
0
Comments/ specify:
Expenditure on fertilizer in KES. The farmer no longer uses fertilizer.
farm income
Quantity before SLM:
0
Quantity after SLM:
6000
Comments/ specify:
The farmer earns income from selling napier grass - per year. This is based on the farmer's estimate.
diversity of income sources
Comments/ specify:
The farmer considers the money earned from selling napier grass as an extra source of income.
Socio-cultural impacts
food security/ self-sufficiency
Quantity before SLM:
2
Quantity after SLM:
0.5
Comments/ specify:
Number of months in a year when there is total lack of food in the house, and the farmer has to buy all the food required in the house. Based on the farmer's estimate.
SLM/ land degradation knowledge
Comments/ specify:
Level of knowledge in SLM/ land management. This is a farmer's estimate that she has increased her knowledge in SLM.
Ecological impacts
Water cycle/ runoff
surface runoff
Comments/ specify:
The farmer notes that the amount of water leaving the farm and silting other farms in the lower areas. has greatly reduced.
Soil
soil loss
Comments/ specify:
the farmer notes that the amount of silt deposited in the lower parts of the farm and in other farms on the lower side of the farm has reduced.
soil accumulation
Comments/ specify:
the farmer notes that the amount of soil trapped by the vegetative cross slope barriers is high and this leads to an increase in soil accummulation at the farm.
Specify assessment of on-site impacts (measurements):
No recorded data is available for reference. All are estimates based on the farmer's explanation or as given by her.
6.2 Off-site impacts the Technology has shown
damage on neighbours' fields
Comments/ specify:
Amount of runoff leaving the farm with potential to cause soil erosion in neighbouring farms.
Specify assessment of off-site impacts (measurements):
No recorded data is available for reference. All are estimates based on the farmer's explanation or as given by her.
6.3 Exposure and sensitivity of the Technology to gradual climate change and climate-related extremes/ disasters (as perceived by land users)
Gradual climate change
Gradual climate change
| Season | increase or decrease | How does the Technology cope with it? | |
|---|---|---|---|
| annual temperature | increase | well | |
| seasonal temperature | dry season | increase | well |
Climate-related extremes (disasters)
Meteorological disasters
| How does the Technology cope with it? | |
|---|---|
| local rainstorm | well |
6.4 Cost-benefit analysis
How do the benefits compare with the establishment costs (from land users’ perspective)?
Short-term returns:
very positive
Long-term returns:
very positive
How do the benefits compare with the maintenance/ recurrent costs (from land users' perspective)?
Short-term returns:
very positive
Long-term returns:
very positive
6.5 Adoption of the Technology
- 11-50%
Of all those who have adopted the Technology, how many did so spontaneously, i.e. without receiving any material incentives/ payments?
- 11-50%
6.6 Adaptation
Has the Technology been modified recently to adapt to changing conditions?
No
6.7 Strengths/ advantages/ opportunities of the Technology
| Strengths/ advantages/ opportunities in the land user’s view |
|---|
| Soil erosion control. |
| increased yields. |
| Strengths/ advantages/ opportunities in the compiler’s or other key resource person’s view |
|---|
| More benefits, including firewood and other products from trees planted on the cross slope barriers. |
6.8 Weaknesses/ disadvantages/ risks of the Technology and ways of overcoming them
| Weaknesses/ disadvantages/ risks in the compiler’s or other key resource person’s view | How can they be overcome? |
|---|---|
| Reduces area meant for crop production. | Ensure optimum use of manure to offset production loss. |
7. References and links
7.1 Methods/ sources of information
- field visits, field surveys
One visit at one farm.
- interviews with land users
One farmer interviewed at his farm. Follow-up questions on phone.
- interviews with SLM specialists/ experts
ProSoil team and project implementers from Welthungerhilfe consulted.
- compilation from reports and other existing documentation
One online source reviewed.
When were the data compiled (in the field)?
17/02/2023
7.3 Links to relevant online information
Title/ description:
Vegetative Barriers for Erosion Control
URL:
https://extension.missouri.edu/publications/g1653
7.4 General comments
1. Provide a function to be able to link the documented SLM to similar work that has been documented in other databases e.g., LandPortal, etc.
2. Some of the impacts (section 6) cannot be quantified.
Links and modules
Expand all Collapse allLinks
Promotion of different trees for agroforestry [Kenya]
Promoting the values of different trees and their benefits in agroforestry contributes to increased adoption by farmers.
- Compiler: William Akwanyi
Modules
No modules