Conservation Tillage for large-scale cereal production, Kisima, Kenya [Kenya]
- Creation:
- Update:
- Compiler: Kithinji Mutunga
- Editor: –
- Reviewers: Alexandra Gavilano, David Streiff, Deborah Niggli
Direct drilling (English)
technologies_941 - Kenya
- Full summary as PDF
- Full summary as PDF for print
- Full summary in the browser
- Full summary (unformatted)
- Conservation Tillage for large-scale cereal production, Kisima, Kenya: June 3, 2019 (public)
- Conservation Tillage for large-scale cereal production, Kisima, Kenya: April 4, 2018 (inactive)
- Conservation Tillage for large-scale cereal production, Kisima, Kenya: May 12, 2017 (inactive)
- Conservation Tillage for large-scale cereal production, Kisima, Kenya: March 27, 2017 (inactive)
- Conservation Tillage for large-scale cereal production, Kisima, Kenya: Dec. 22, 2016 (inactive)
View sections
Expand all Collapse all1. General information
1.2 Contact details of resource persons and institutions involved in the assessment and documentation of the Technology
land user:
Kimathi John
Syngenta Group, Nanyuki
Kenya
Name of project which facilitated the documentation/ evaluation of the Technology (if relevant)
Book project: SLM in Practice - Guidelines and Best Practices for Sub-Saharan Africa (SLM in Practice) {'additional_translations': {}, 'value': 76, 'label': 'Name of the institution(s) which facilitated the documentation/ evaluation of the Technology (if relevant)', 'text': 'Syngenta (Syngenta) - France', 'template': 'raw'} {'additional_translations': {}, 'value': 76, 'label': 'Name of the institution(s) which facilitated the documentation/ evaluation of the Technology (if relevant)', 'text': 'Syngenta (Syngenta) - France', 'template': 'raw'} {'additional_translations': {}, 'value': 76, 'label': 'Name of the institution(s) which facilitated the documentation/ evaluation of the Technology (if relevant)', 'text': 'Syngenta (Syngenta) - France', 'template': 'raw'}1.3 Conditions regarding the use of data documented through WOCAT
The compiler and key resource person(s) accept the conditions regarding the use of data documented through WOCAT:
Yes
2. Description of the SLM Technology
2.1 Short description of the Technology
Definition of the Technology:
Minimise soil disturbance to conserve soil moisture
2.2 Detailed description of the Technology
Description:
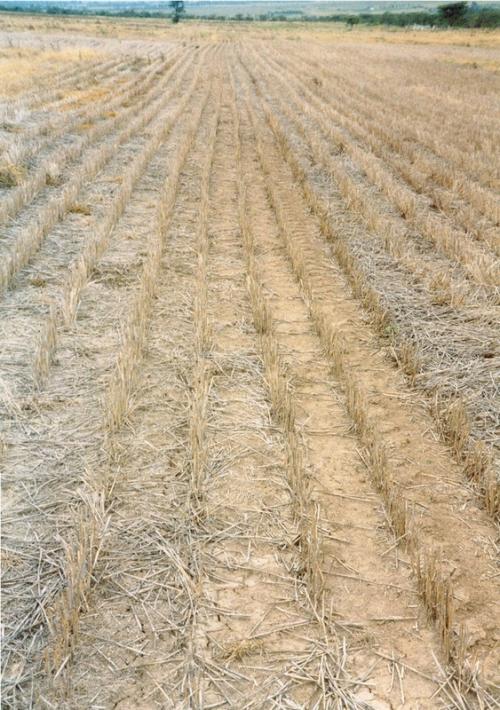
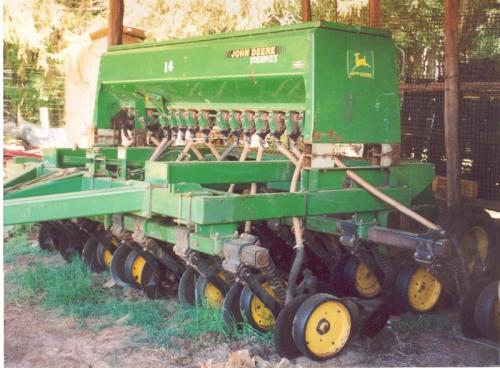
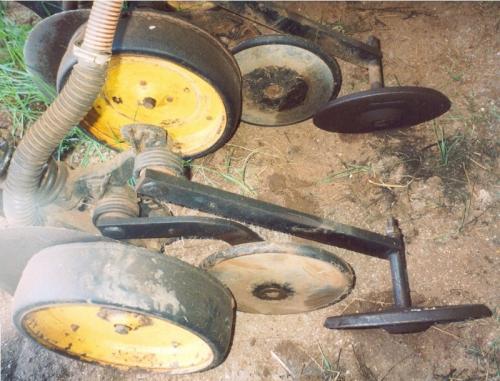
Conservation tillage (or ‘No-Till’) on large-scale commercial cereal farms is based on tractor-drawn equipment which allows furrow opening and planting in one pass. This technology minimizes soil disturbance, avoids formation of hard-pans and considerably reduces machine hours used for crop production: time is saved as well as fossil fuels – and field operations are thus cheaper than under conventional farming. Crops can be planted early to make the best use of rainfall. During harvesting, the crop residues are chopped and left as mulch on the field (3 tons of crop residues per hectare give around 70-100% cover), to improve soil organic matter and protect the soil against erosion and evaporation. Thanks to enhanced water conservation and infiltration, wheat and barley can be produced without irrigation and the risk of crop failure is reduced. Weeds are controlled with “Roundup” (glyphosate) herbicide application (2 liters/ha) two months after harvesting and shortly before planting. The company minimizes usage of pesticides. Conservation agriculture also includes contour planting (25 cm rows). Crops rotation is 3-4 years of wheat or barley followed by a season of legumes (for example peas) or canola (oilseed rape). If, after several years, the yields decrease due to compaction in the subsoil, crops with a strong tap root are planted (e.g. rape or sunflower) to break the hard pan - rather than using a ripper. As a supplementary technology tree rows (e.g. pines, cypress, or eucalyptus) are planted as shelterbelts and for wood production along boundaries, in valleys or on steep slopes.
2.3 Photos of the Technology
Media Gallery
2.5 Country/ region/ locations where the Technology has been applied and which are covered by this assessment
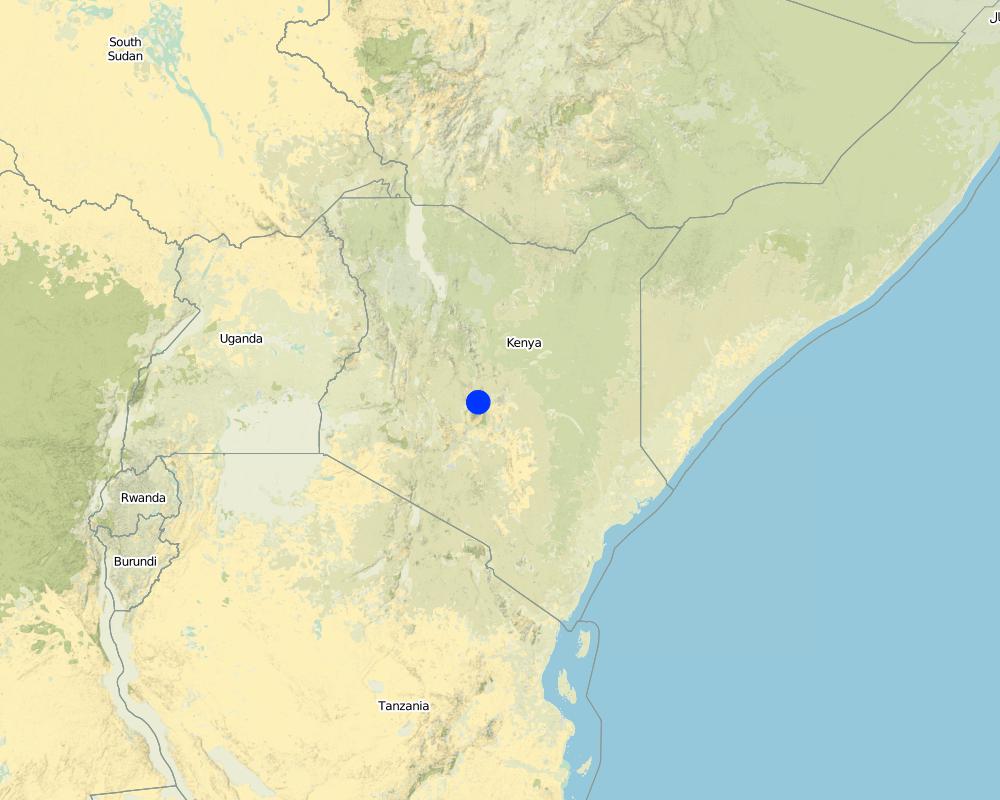
Country:
Kenya
Region/ State/ Province:
Meru Central
Further specification of location:
Ferme de Kisima
Comments:
Total area covered by the SLM Technology is 14 km2.
One large scale wheat and barley farmer at Kisima farm.
Map
×2.6 Date of implementation
If precise year is not known, indicate approximate date:
- 10-50 years ago
2.7 Introduction of the Technology
Specify how the Technology was introduced:
- through land users' innovation
Comments (type of project, etc.):
USA, Australia and personal initiative. Started in 1980 when Glyphosphate (Round up) was introduced in the market.
3. Classification of the SLM Technology
3.1 Main purpose(s) of the Technology
- reduce, prevent, restore land degradation
3.2 Current land use type(s) where the Technology is applied
Land use mixed within the same land unit:
Yes
Specify mixed land use (crops/ grazing/ trees):
- Agro-silvopastoralism

Cropland
- Annual cropping
- Tree and shrub cropping
Annual cropping - Specify crops:
- cereals - barley
- legumes and pulses - peas
- oilseed crops - sunflower, rapeseed, other
- root/tuber crops - potatoes
- wheat
Number of growing seasons per year:
- 2
Specify:
Longest growing period in days: 120 Longest growing period from month to month: Mar - May Second longest growing period in days: 100 Second longest growing period from month to month: Oct - Dec
Is crop rotation practiced?
Yes
If yes, specify:
Crops rotation is 3-4 years of wheat or barley followed by a season of legumes (for example peas) or canola (oilseed rape)

Grazing land
Intensive grazing/ fodder production:
- Improved pastures
Animal type:
- sheep
- cattles

Forest/ woodlands
- Tree plantation, afforestation
Type of tree:
- Acacia species
- Eucalyptus species
- Grevillea robusta
- Pinus species (pine)
Products and services:
- Timber
- Fuelwood
Comments:
Trees/ shrubs species: Eucalyptus, Grevillea robusta, wattle tree (acacia pycnantha), pinus
Major land use problems (compiler’s opinion): Soil erosion due to water. Formation of hard-pans below the plough layer reducing iwater infiltration. Reduced animal fodder.
Major land use problems (land users’ perception): Soil erosion and decreased yields.
Improved pasture: cattle, sheep
Plantation forestry: Harvested when mature, about 20 years after planting.
Forest products and services: timber, fuelwood
Type of cropping system and major crops comments: 3-4 years of wheat or barley followed by 3-4 years of grass (Rhodes grass). Duration is partly dependent on the prevalence of grass weeds especially brome (Broums spp).
Livestock density: > 100 LU /km2
3.3 Has land use changed due to the implementation of the Technology?
Has land use changed due to the implementation of the Technology?
- Yes (Please fill out the questions below with regard to the land use before implementation of the Technology)
Grazing land
- Extensive grazing
3.4 Water supply
Water supply for the land on which the Technology is applied:
- rainfed
3.5 SLM group to which the Technology belongs
- improved ground/ vegetation cover
- minimal soil disturbance
3.6 SLM measures comprising the Technology

agronomic measures
- A1: Vegetation/ soil cover

vegetative measures
- V1: Tree and shrub cover
structural measures
- S5: Dams, pans, ponds
Comments:
Main measures: agronomic measures
Secondary measures: vegetative measures
Type of agronomic measures: better crop cover, early planting, contour planting / strip cropping, mulching, manure / compost / residues, rotations / fallows, zero tillage / no-till, minimum tillage, contour tillage, breaking compacted subsoil
Type of vegetative measures: aligned: -against wind, aligned: -along boundary
3.7 Main types of land degradation addressed by the Technology

soil erosion by water
- Wt: loss of topsoil/ surface erosion

chemical soil deterioration
- Cn: fertility decline and reduced organic matter content (not caused by erosion)

physical soil deterioration
- Pc: compaction
Comments:
Main type of degradation addressed: Wt: loss of topsoil / surface erosion
Secondary types of degradation addressed: Cn: fertility decline and reduced organic matter content, Pc: compaction
Main causes of degradation: change of seasonal rainfall (low rainfall)
Secondary causes of degradation: other human induced causes (specify) (agricultural causes - cultivation)
3.8 Prevention, reduction, or restoration of land degradation
Specify the goal of the Technology with regard to land degradation:
- prevent land degradation
- reduce land degradation
4. Technical specifications, implementation activities, inputs, and costs
4.1 Technical drawing of the Technology
Technical specifications (related to technical drawing):
Technical knowledge required for field staff / advisors: high
Technical knowledge required for land users: high
Main technical functions: control of concentrated runoff: impede / retard, improvement of surface structure (crusting, sealing), increase in organic matter, water harvesting / increase water supply
Secondary technical functions: control of raindrop splash, improvement of ground cover, improvement of topsoil structure (compaction), improvement of subsoil structure (hardpan), increase in nutrient availability (supply, recycling,…), increase of infiltration, increase / maintain water stored in soil, reduction in wind speed
Better crop cover
Material/ species: wheat, barley
Early planting
Material/ species: wheat, barley
Contour planting / strip cropping
Material/ species: wheat, barley
Quantity/ density: 0.08-0.09
Remarks: contour planting, 10inch row spacing for wheat
Mulching
Material/ species: wheat, barley
Quantity/ density: 1 t/ha
Remarks: crop residues give ~70% cover
Manure / compost / residues
Remarks: Residues from mulching
Rotations / fallows
Material/ species: peas
Zero tillage / no-till
Remarks: Herbicide (Roundup at 2l/ha) applied for weed control
Contour tillage
Remarks: For planting potatoes
Aligned: -against wind
Vegetative material: T : trees / shrubs
Number of plants per (ha): 3000
Vertical interval between rows / strips / blocks (m): 3
Spacing between rows / strips / blocks (m): 3
Vertical interval within rows / strips / blocks (m): 3
Width within rows / strips / blocks (m): 3
Aligned: -along boundary
Vegetative material: T : trees / shrubs
Number of plants per (ha): 3000
Vertical interval between rows / strips / blocks (m): 3
Spacing between rows / strips / blocks (m): 3
Vertical interval within rows / strips / blocks (m): 3
Width within rows / strips / blocks (m): 3
Vegetative measure: Places that can not be cultivated
Vegetative material: T : trees / shrubs
Number of plants per (ha): 3000
Vertical interval between rows / strips / blocks (m): 3
Spacing between rows / strips / blocks (m): 3
Vertical interval within rows / strips / blocks (m): 3
Width within rows / strips / blocks (m): 3
Vegetative measure: Vegetative material: T : trees / shrubs
Vegetative measure: Vegetative material: T : trees / shrubs
Vegetative measure: Vegetative material: T : trees / shrubs
Trees/ shrubs species: Eucalyptus, Grevillea robusta, wattle tree, pinus. All planted
Specification of dams/ pans/ ponds: Capacity 4 x 20000m3
Vegetation is used for stabilisation of structures.
Author:
Ceris Jones, London, UK
4.2 General information regarding the calculation of inputs and costs
Specify currency used for cost calculations:
- USD
other/ national currency (specify):
Kenya shilling
Indicate average wage cost of hired labour per day:
2.34
4.3 Establishment activities
| Activity | Timing (season) | |
|---|---|---|
| 1. | planting | twice a year |
| 2. | Digging | |
| 3. | Tractors | |
| 4. | Combined Harvester | |
| 5. | Sprayers | |
| 6. | Direct Seeders | |
| 7. | Cultivators |
4.4 Costs and inputs needed for establishment
| Specify input | Unit | Quantity | Costs per Unit | Total costs per input | % of costs borne by land users | |
|---|---|---|---|---|---|---|
| Labour | Planting | Persons/day | 600.0 | 2.33333 | 1400.0 | 100.0 |
| Labour | Digging4 ponds | Persons/day | 1000.0 | 2.34 | 2340.0 | |
| Equipment | Tractors | pieces | 5.0 | 22200.0 | 111000.0 | 10.0 |
| Equipment | Combined Harvester | pieces | 3.0 | 52666.666666 | 158000.0 | 100.0 |
| Equipment | Sprayers | pieces | 2.0 | 87500.0 | 175000.0 | 100.0 |
| Equipment | Direct Seeders | pieces | 2.0 | 55500.0 | 111000.0 | 100.0 |
| Equipment | Cultivators | pieces | 4.0 | 6000.0 | 24000.0 | 100.0 |
| Plant material | Seedlings | pieces/year | 70000.0 | 0.0781428 | 5470.0 | 100.0 |
| Total costs for establishment of the Technology | 588210.0 | |||||
| Total costs for establishment of the Technology in USD | 588210.0 | |||||
Comments:
Duration of establishment phase: 36 month(s)
4.5 Maintenance/ recurrent activities
| Activity | Timing/ frequency | |
|---|---|---|
| 1. | Harvesting and chopping of crop residues | end of growing season / annual |
| 2. | Roundup (glyphosate) application | 2 months after harvesting / annual |
| 3. | Planting | juste avant les pluies |
| 4. | Weeding | twice a year |
| 5. | desilting | one per year |
| 6. | Traitement en cours de croissance | |
| 7. | Désherbage | 2 fois par année |
| 8. | Récolte | 20 années |
| 9. | Emondage | |
| 10. | Désédimentation | une fois par année |
4.6 Costs and inputs needed for maintenance/ recurrent activities (per year)
| Specify input | Unit | Quantity | Costs per Unit | Total costs per input | % of costs borne by land users | |
|---|---|---|---|---|---|---|
| Labour | Harvesting and chopping of crop residues | Persons/day | 1000.0 | 2.34 | 2340.0 | 100.0 |
| Labour | In-crop spraying | Persons/day | 1500.0 | 2.333333 | 3500.0 | |
| Labour | Weeding | Persons/day | 100.0 | 2.4 | 240.0 | 100.0 |
| Labour | Pruning | Persons/day | 600.0 | 2.33333 | 1400.0 | 100.0 |
| Fertilizers and biocides | Roundup (glyphosate) application | l/ha | 4.0 | 6.25 | 25.0 | 100.0 |
| Other | Labour: Desilting | Persons/day | 10.0 | 2.34 | 23.4 | |
| Total costs for maintenance of the Technology | 7528.4 | |||||
| Total costs for maintenance of the Technology in USD | 7528.4 | |||||
Comments:
total costs for the whole farm. December 2007
4.7 Most important factors affecting the costs
Describe the most determinate factors affecting the costs:
Machinery, spraying and labour (management time not included in figures above). 4000 Machine hrs are establishment costs and 5510 machine hrs Maintainance costs. The costs for machinery differ from task to task and the values are only partly known. Thus it was not possible to figure out a mean.
5. Natural and human environment
5.1 Climate
Annual rainfall
- < 250 mm
- 251-500 mm
- 501-750 mm
- 751-1,000 mm
- 1,001-1,500 mm
- 1,501-2,000 mm
- 2,001-3,000 mm
- 3,001-4,000 mm
- > 4,000 mm
Specify average annual rainfall (if known), in mm:
745.00
Agro-climatic zone
- sub-humid
Thermal climate class: subtropics
Lower Highland Zone II-8
5.2 Topography
Slopes on average:
- flat (0-2%)
- gentle (3-5%)
- moderate (6-10%)
- rolling (11-15%)
- hilly (16-30%)
- steep (31-60%)
- very steep (>60%)
Landforms:
- plateau/plains
- ridges
- mountain slopes
- hill slopes
- footslopes
- valley floors
Altitudinal zone:
- 0-100 m a.s.l.
- 101-500 m a.s.l.
- 501-1,000 m a.s.l.
- 1,001-1,500 m a.s.l.
- 1,501-2,000 m a.s.l.
- 2,001-2,500 m a.s.l.
- 2,501-3,000 m a.s.l.
- 3,001-4,000 m a.s.l.
- > 4,000 m a.s.l.
Comments and further specifications on topography:
Altitudinal zone: Also 1000-1500 m a.s.l., 1500-2000 m a.s.l., 2000-2500 m a.s.l., 2500-3000 m a.s.l.
Landforms. Also mountain slopes
5.3 Soils
Soil depth on average:
- very shallow (0-20 cm)
- shallow (21-50 cm)
- moderately deep (51-80 cm)
- deep (81-120 cm)
- very deep (> 120 cm)
Soil texture (topsoil):
- medium (loamy, silty)
- fine/ heavy (clay)
Topsoil organic matter:
- medium (1-3%)
- low (<1%)
If available, attach full soil description or specify the available information, e.g. soil type, soil PH/ acidity, Cation Exchange Capacity, nitrogen, salinity etc.
Soil fertility is medium - low
Soil drainage / infiltration is good
Soil water storage capacity is high
5.4 Water availability and quality
Availability of surface water:
poor/ none
Water quality (untreated):
good drinking water
Comments and further specifications on water quality and quantity:
Availability of surface water: Also medium
5.5 Biodiversity
Species diversity:
- low
5.6 Characteristics of land users applying the Technology
Market orientation of production system:
- commercial/ market
Off-farm income:
- less than 10% of all income
Relative level of wealth:
- very rich
Individuals or groups:
- employee (company, government)
Level of mechanization:
- mechanized/ motorized
Indicate other relevant characteristics of the land users:
Land users applying the Technology are mainly Leaders / privileged
Population density: < 10 persons/km2
Annual population growth: 2% - 3%
100% of the land users are very rich and own 100% of the land (Sole land owner).
Off-farm income specification: Full-time commercial farmers
Market orientation of production system: Grows wheat and barley on large scale for markets. Meat and wool also produced for markets.
Level of mechanization: All operations are mechanized.
5.7 Average area of land used by land users applying the Technology
- < 0.5 ha
- 0.5-1 ha
- 1-2 ha
- 2-5 ha
- 5-15 ha
- 15-50 ha
- 50-100 ha
- 100-500 ha
- 500-1,000 ha
- 1,000-10,000 ha
- > 10,000 ha
Is this considered small-, medium- or large-scale (referring to local context)?
- large-scale
Comments:
Plantation de 70'000 arbres par année
5.8 Land ownership, land use rights, and water use rights
Land ownership:
- company
Land use rights:
- leased
Water use rights:
- leased
5.9 Access to services and infrastructure
health:
- poor
- moderate
- good
education:
- poor
- moderate
- good
technical assistance:
- poor
- moderate
- good
markets:
- poor
- moderate
- good
energy:
- poor
- moderate
- good
roads and transport:
- poor
- moderate
- good
drinking water and sanitation:
- poor
- moderate
- good
financial services:
- poor
- moderate
- good
6. Impacts and concluding statements
6.1 On-site impacts the Technology has shown
Socio-economic impacts
Production
crop production
Quantity before SLM:
1t/ha
Quantity after SLM:
4t/ha
Comments/ specify:
Started CA 20 years ago!
wood production
Comments/ specify:
Not commercial before
product diversity
Comments/ specify:
Today: Livestock, wheat, barley, Roses and Potatoes
Water availability and quality
drinking water availability
water availability for livestock
irrigation water availability
Quantity before SLM:
17000m3
Quantity after SLM:
80000m3
Comments/ specify:
Four dams were built.
Income and costs
farm income
Comments/ specify:
Increased above Inflation rate
Other socio-economic impacts
IPM Integrated product management
Comments/ specify:
The company avoids high usage of pesticides
Ecological impacts
Water cycle/ runoff
water quantity
water quality
harvesting/ collection of water
Comments/ specify:
New dams
surface runoff
Quantity before SLM:
20
Quantity after SLM:
5
Soil
soil moisture
soil loss
Quantity before SLM:
15
Quantity after SLM:
10
soil organic matter/ below ground C
Biodiversity: vegetation, animals
biomass/ above ground C
beneficial species
Comments/ specify:
Prédateurs, vers de terre, pollinisateurs
Climate and disaster risk reduction
flood impacts
drought impacts
Other ecological impacts
Hazards towards adverse events
6.2 Off-site impacts the Technology has shown
downstream siltation
Comments/ specify:
Les fortes pluies de 2003 n'ont pas provoqué d'érosion.
groundwater/ river pollution
Recharge des nappes préatiques lors de pluies exceptionnelles
6.3 Exposure and sensitivity of the Technology to gradual climate change and climate-related extremes/ disasters (as perceived by land users)
Gradual climate change
Gradual climate change
| Season | increase or decrease | How does the Technology cope with it? | |
|---|---|---|---|
| annual temperature | increase | not known |
Climate-related extremes (disasters)
Meteorological disasters
| How does the Technology cope with it? | |
|---|---|
| local rainstorm | not known |
| local windstorm | not known |
Climatological disasters
| How does the Technology cope with it? | |
|---|---|
| drought | well |
Hydrological disasters
| How does the Technology cope with it? | |
|---|---|
| general (river) flood | not known |
Other climate-related consequences
Other climate-related consequences
| How does the Technology cope with it? | |
|---|---|
| reduced growing period | not known |
6.4 Cost-benefit analysis
How do the benefits compare with the establishment costs (from land users’ perspective)?
Short-term returns:
slightly positive
Long-term returns:
positive
How do the benefits compare with the maintenance/ recurrent costs (from land users' perspective)?
Short-term returns:
positive
Long-term returns:
very positive
6.5 Adoption of the Technology
- single cases/ experimental
Comments:
There is a strong trend towards spontaneous adoption of the Technology
Comments on adoption trend: Large scale farmers run no-till demonstration days for other interested farmers and a number are trialing the technology. Neighbouring farmers are picking up the technology.
6.7 Strengths/ advantages/ opportunities of the Technology
| Strengths/ advantages/ opportunities in the land user’s view |
|---|
| Time saving (less machine houres are needed to cultivate the farm) |
| Moisture conservation minimises crop failures |
| Much cheaper than conventional farming |
|
Carbon fixation How can they be sustained / enhanced? More trees and less cultivation |
| Strengths/ advantages/ opportunities in the compiler’s or other key resource person’s view |
|---|
| Wheat and barley is produced without irrigation. |
| Improved organic matter |
| Improved water infiltration |
|
Weed suppression How can they be sustained / enhanced? Ensuring permanent ground cover |
| Gain de temps (moins d heures pour les machines nécessaire) |
6.8 Weaknesses/ disadvantages/ risks of the Technology and ways of overcoming them
| Weaknesses/ disadvantages/ risks in the land user’s view | How can they be overcome? |
|---|---|
| Poor market for equipment | Establish a market association. |
| Difficulties in purchasing equipment | Create a shopping center |
| More herbicides are required in rainy years, especially before sowing (several sprays) | Reduced to a minimum but more than for conventional plowing. If it does not rain after harvest, it is not necessary to treat with a herbicide and seeding can be done directly. |
| It takes three years to fully complete the system | Continued adaptation |
| Weaknesses/ disadvantages/ risks in the compiler’s or other key resource person’s view | How can they be overcome? |
|---|---|
| High costs if new equipment is needed (particularly established brands) but less than half of the costs for conventional tillage. equipment | Encourage local production and regulation of prices or subsidising input purchase. |
| During wet years more herbicides are needed, especially before planting (several sprayings) | Spray use is minimal more than conventional tillage. If after the harvest there are no more rains during the dry season, there is no application of herbicides needed and direct planting can be done. |
| Takes more than three years to fully establish | Needs continuous adaptation. |
7. References and links
7.2 References to available publications
Title, author, year, ISBN:
Farm Management Handbook, Jaetzold and Schmidt. 1983.
Available from where? Costs?
Ministry of Agriculture
Title, author, year, ISBN:
Erosion Hazard assessment in the Ewaso Ng'iro basin of Kenya: application of GIS, USLE and EUROSEM/ Mati. 1999.
Available from where? Costs?
NRM3
Links and modules
Expand all Collapse allLinks
No links
Modules
No modules