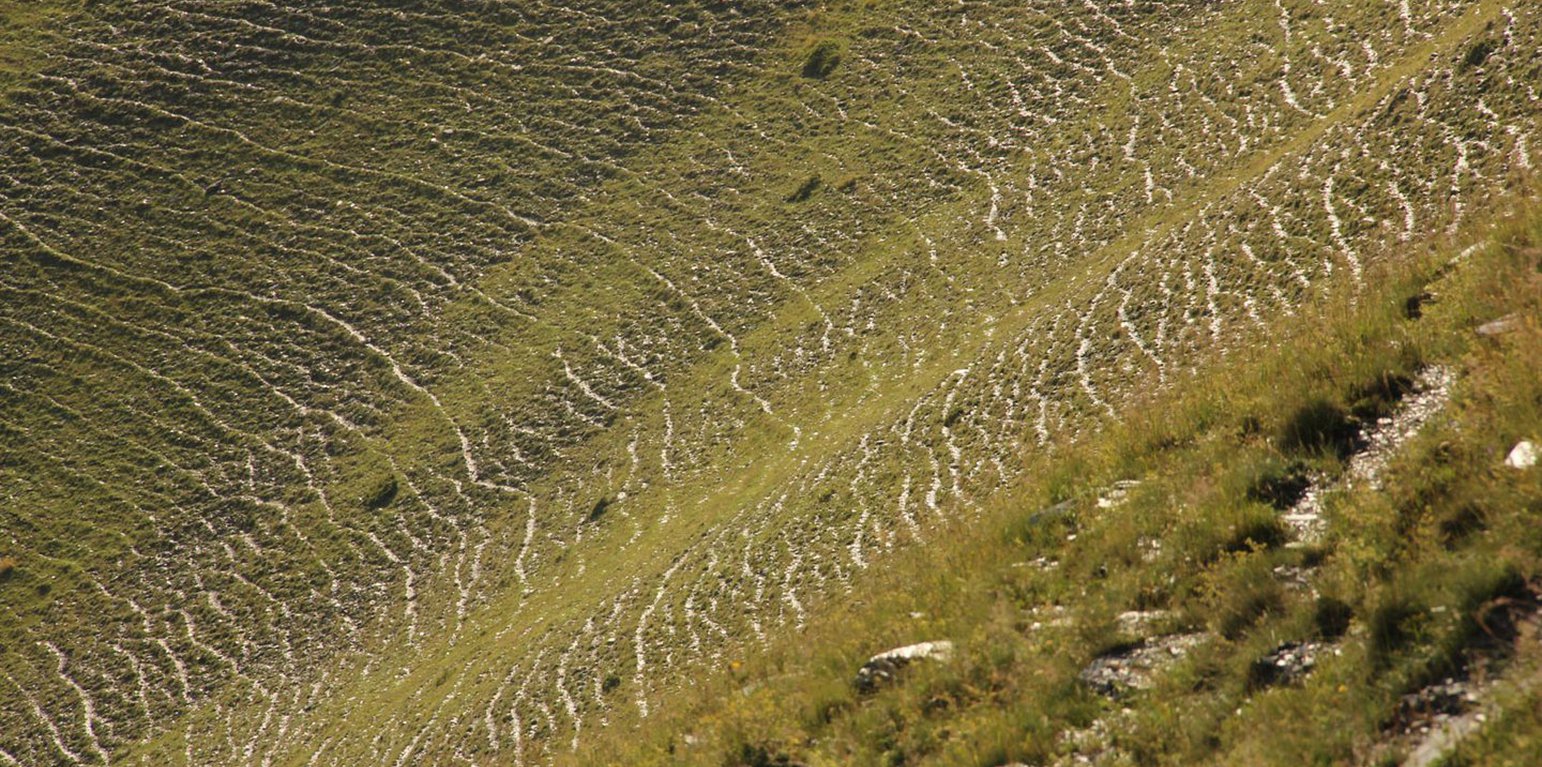
Heavy grazing and trampling can lead to heavy degradation of pastureland. Shenako, Akhmeta Municipality. (Hanns Kirchmeir)

Remote Sensing as a Tool for Land Degradation Neutrality Monitoring (乔治亚)

描述

Land degradation contributes to biodiversity loss and the impoverishment of rural livelihoods in Tusheti. Above all, however, land degradation are triggered by climate change as traditional land use practise might not be adapted to new climate conditions which can cause or speed up degradation processes significantly. On the other hand, degraded land often leads to low biomass volumes and this reduces the ecosystem capability to stabilise local climate conditions. The concept of Land Degradation Neutrality (LDN) and the method of using remote sensing for monitoring land degradation are tools to identify the need for local planning processes. This showcase describes the LDN monitoring concept, national targets and the technology to assess indicators, mechanism and incentives for LDN.

Purpose
The continuing global degradation of land resources threatens food security and the functioning of ecosystem services by reducing or losing their biological or economic productivity. Unsustainable land-use practices such as deforestation, overgrazing and inappropriate agricultural management systems trigger the loss and degradation of valuable land resources in Georgia. These effects are visible in all countries of the South Caucasus. About 35% of the agricultural land in Georgia is severely degraded, 60% is of low to middle production quality.

Land Degradation Neutrality (LDN)
LDN is a new international concept to combat the ongoing degradation of valuable soil resources. The LDN concept was developed by the UNCCD to encourage countries to take measures to avoid, reduce or reverse land degradation, with the vision of achieving a zero-net loss of productive land. To combat land degradation in Georgia, in 2017, the national LDN Working Group set voluntary national targets to address specific aspects of LDN, and submitted them to the UNCCD Secretariat.

To effectively set up counter measures to combat land degradation it is important to have detailed spatial information on land cover and land cover changes as well as on trends in degradation (like size of areas effected by erosion). Therefore a remote sensing toolset was developed and tested in the pilot are of Tusheti protected landscapes in the High Caucasus in Georgia. This region shows increasing soil erosion problems by uneven distribution of grazing activities and was selected for developing erosion control measures within the Integrated Biodiversity Management in the South Caucasus Program (IBiS) funded by the Deutsche Gesellschaft für internationale Zusammenarbeit (GIZ).

Sensitivity Model
The Integrated Biodiversity Management in the South Caucasus (IBiS) project in cooperation with national experts in Georgia, developed and applied a remote sensing toolset called "Erosion Sensitivity Model". This remote sensing toolset helps to assess the current state and the general erosion risk. The sensitivity model is based on the RUSLE – Revised Universal Soil Loss Equation. The tool allows the calculation of erosion caused by rainfall and surface run-off. The RUSLE equation incorporates a combination of different input factors such as precipitation (R), soil type (K), slope (LS), vegetation cover (C) and protection measures (P). In this way, the estimated average soil loss in tonnes per acre per year (A) can be calculated as follows: A = R * K * LS * C * P.

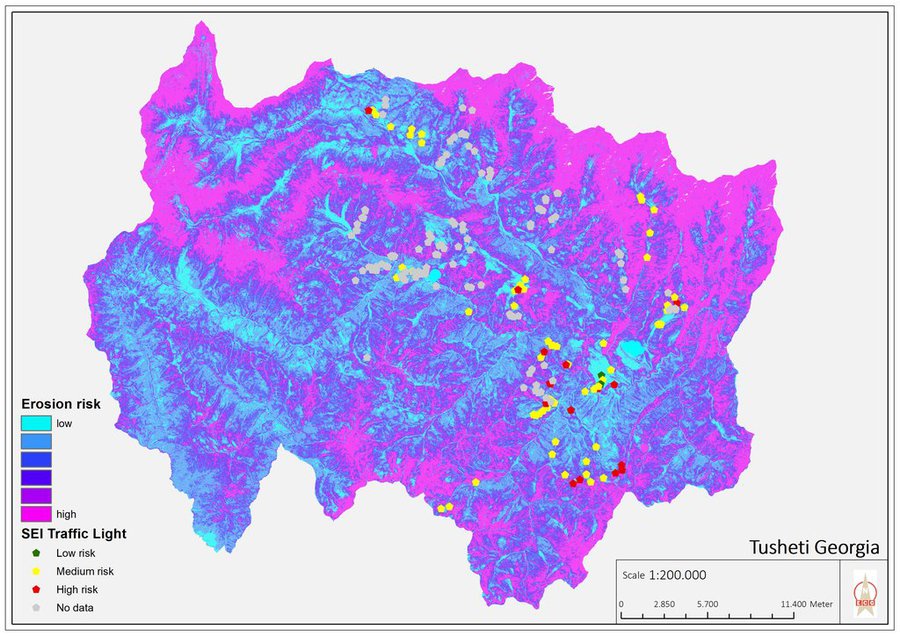
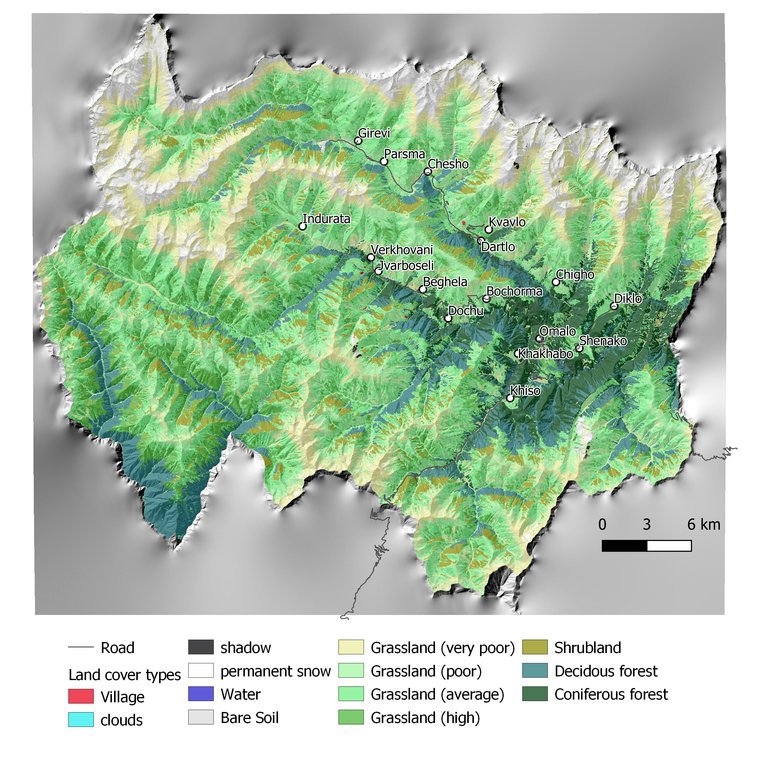
The rainfall factor (R) results from a quotient from the monthly and annual mean value of precipitation. The data come from the data platform “CHELSA – Climatologies at high resolution for the earth’s land surface areas”. For the soil type factor (K), a soil map of 1:200,000 was taken. Then, depending on the soil type, different contents of sand, silt, loam and clay were used to calculate the K factor. The slope length and steepness factor (LS) is calculated from a digital elevation model (DEM) with a raster resolution of 10x10m. The DEM is derived from the topographic map 1:25,000. The global elevation model derived from SRTM data (Shuttle Radar Topography Mission) has a resolution of 30x30 m and is available worldwide free of charge. The land cover factor (C) describes the vegetation cover that protects the soil from erosion. The vegetation cover slows down the speed of the raindrops and reduces the erosive effect of the rain. It slows down surface water runoff and stabilises the soil through root systems. The main indicators, land cover and productivity, can be assessed by remote sensing. The data from satellites need to be classified and calibrated by field data (ground truthing). The technology for the assessment of these indicators with Sentinel 2 satellite images was developed and applied in 2016 to 2018 in the Tusheti region (Akhmeta municipality) in the framework of the GIZ-IBiS project. Based on spectral information from airborne or satellite images, the density of the vegetation was calculated and mapped. There are well developed vegetation indices and classification systems to derive different land cover types and vegetation densities (mainly described by the Leaf Area Index LAI or biomass indices). The LAI is the area of the leaf surface (in square meters) per square meter ground surface. Since the real surface area of the leaves is hardly measurable, the amount of biomass is a proxy for the LAI. The P-factor is rarely considered in large-scale modelling of soil erosion risk as it is difficult to estimate it with very high accuracy. Therefore, to refine the model, a more detailed DEM (digital elevation model) is required (e.g., from satellite images). Based on the input factors, a soil erosion risk map was calculated for the whole territory of the Tusheti Protected Areas (113,660 ha). Based on the different spectral bands of the Sentinel 2 satellite image, a land cover map was calculated using the Support Vector Machine (SVM) technology and spectral image information.
The results have been integrated in the development of pasture management plans ("pasture passports"). This maps and documents are indicating areas of high erosion risk that need to be excluded from grazing and the maximum number of livestock has been calculated based on the biomass maps and will be integrated into the lease contracts.
The repetition of the remote sensing after some years (e.g. 5 years) will help to evaluate, if the measures in the pasture management have been successful to stop the degradation processes.

地点

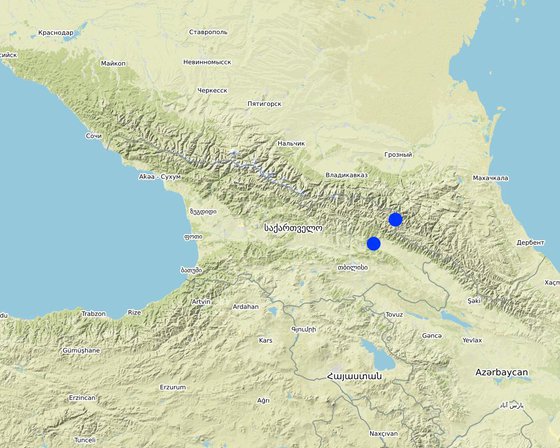
地点: Tusheti region, Akhmeta municipality, 乔治亚

分析的技术场所数量: 2-10个场所

选定地点的地理参考
  • 45.2009, 42.03922
  • 45.63695, 42.3823

技术传播: 均匀地分布在一个区域 (1000.0 km²)

在永久保护区?:

实施日期: 2016

介绍类型
Figure 1: Loss of arable land due to riverbed erosion, Alazani River (Hanns Kirchmeir)
Figure 2: Pasture and soil erosion, Garabani municipality. Heavy grazing is reducing the vegetation cover and the top soil is exposed to wind and water erosion. (Hanns Kirchmeir)

技术分类

主要目的
  • 改良生产
  • 减少、预防、恢复土地退化
  • 保护生态系统
  • 结合其他技术保护流域/下游区域
  • 保持/提高生物多样性
  • 降低灾害风险
  • 适应气候变化/极端天气及其影响
  • 减缓气候变化及其影响
  • 创造有益的经济影响
  • 创造有益的社会影响
  • provide information to make a spatial-territorial planning
土地利用
同一土地单元内混合使用的土地: 是 - 农牧业(包括农牧结合)

  • 农田
    • 一年一作: 谷类 - 大麦, 根/块茎作物 - 土豆
    每年的生长季节数: 1
    采用间作制度了吗?: 否
    采用轮作制度了吗?: 否
  • 牧场
    • 季节性迁移的放牧主义
    动物类型: cattle - dairy and beef (e.g. zebu), 绵羊
    是否实行作物与牲畜的综合管理?: 否
供水
  • 雨养
  • 混合雨水灌溉
  • 充分灌溉
  • rainfed and mixed rained-irrigation

土地退化相关的目的
  • 防止土地退化
  • 减少土地退化
  • 修复/恢复严重退化的土地
  • 适应土地退化
  • 不适用
解决的退化问题
  • 土壤水蚀 - Wt:表土流失/地表侵蚀 , Wg:冲沟侵蚀/沟蚀
  • 物理性土壤退化 - Pc:压实
  • 生物性退化 - Bc:植被覆盖的减少, Bq:数量/生物量减少
SLM组
  • 畜牧业和牧场管理
  • 改良的地面/植被覆盖
SLM措施
  • 管理措施 - M2:改变管理/强度级别
  • 其它措施 - It is a monitoring technology to evaluate land management activities.

技术图纸

技术规范
Map of erosion hot spots (pink colour) and the location of field sample plots for evaluation and ground truthing.
Author: Hanns Kirchmeir
Map of land cover classification derived from satellite images. The different grassland types are classified by their biomass as an indicator of productivity and current state. Repeating the satellite image classification with the same parameters after 5 or 10 years can give a clear picture of changes in the land cover.
Author: Hanns Kirchmeir

技术建立与维护:活动、投入和费用

投入和成本的计算
  • 计算的成本为:每个技术区域 (尺寸和面积单位:1000 km2
  • 成本计算使用的货币:美元
  • 汇率(换算为美元):1 美元 = 不适用
  • 雇用劳工的每日平均工资成本:100
影响成本的最重要因素
Field sample collection; Remote sensing experts.
技术建立活动
  1. National level. Baseline: Field assessment for remote sensing calibration (1x/20 years) (时间/频率: 2017)
  2. Sentinel satellite image classification (multi temporal data from 2017) (时间/频率: 2017)
  3. Statistical data from GEOSTAT Agricultural census (时间/频率: 2014-2016)
  4. Analysis of soil carbon content from existing profiles (时间/频率: 2003 - 2006)
  5. Conduct ongoing monitoring (时间/频率: 5 years intervals)
  6. Update sentinel satellite image classification (时间/频率: 1x year)
  7. Update statistical data from GEOSTAT Agricultural census (时间/频率: 4x/year)
  8. Resampling of soil carbon content near existing profiles (时间/频率: 1x/5 years)
  9. Municipal level. Spatial planning: Assessment of current stage of land degradation, anticipated gains and losses (时间/频率: 1x/10 years)
  10. Revision of spatial planning on Municipal level. (时间/频率: 1x / 5 years)
技术建立的投入和成本 (per 1000 km2)
对投入进行具体说明 单位 数量 单位成本 (美元) 每项投入的总成本 (美元) 土地使用者承担的成本%
劳动力
Remote Sensing analysis by Sentinel Satellite data person days 50.0 200.0 10000.0
Collecting field data for satellite image callibration person days 40.0 200.0 8000.0
Soil sampling (for carbon content) person days 20.0 200.0 4000.0
Including results in spatial planning person days 10.0 200.0 2000.0
技术建立所需总成本 24'000.0
技术建立总成本,美元 24'000.0
技术维护活动
  1. Repeating the application of the calibrated remote sensing model for monitoring repitition (时间/频率: with 5 years interval)
  2. Repetition of soil samples for assessing soil carbon content (时间/频率: with 5 years interval)
  3. Analysing the results and integrate them in spatial planning and policy making (时间/频率: with 5 years interval)
技术维护的投入和成本 (per 1000 km2)
对投入进行具体说明 单位 数量 单位成本 (美元) 每项投入的总成本 (美元) 土地使用者承担的成本%
劳动力
Applying the calibrated remote sensing model for monitoring repetition person days 20.0 200.0 4000.0
Repetition of soil samples for assessing soil carbon content person days 10.0 200.0 2000.0
Analysing results and integrating in spatial planning person days 10.0 200.0 2000.0
技术维护所需总成本 8'000.0
技术维护总成本,美元 8'000.0

自然环境

年平均降雨量
  • < 250毫米
  • 251-500毫米
  • 501-750毫米
  • 751-1,000毫米
  • 1,001-1,500毫米
  • 1,501-2,000毫米
  • 2,001-3,000毫米
  • 3,001-4,000毫米
  • > 4,000毫米
农业气候带
  • 潮湿的
  • 半湿润
  • 半干旱
  • 干旱
关于气候的规范
以毫米为单位计算的年平均降雨量:800.0
The climate is generally suitable for agriculture with an annual precipitation of up to 800 mm, with hot and humid springs, rainfall peaks in May and June with hot and dry summers.
斜坡
  • 水平(0-2%)
  • 缓降(3-5%)
  • 平缓(6-10%)
  • 滚坡(11-15%)
  • 崎岖(16-30%)
  • 陡峭(31-60%)
  • 非常陡峭(>60%)
地形
  • 高原/平原
  • 山脊
  • 山坡
  • 山地斜坡
  • 麓坡
  • 谷底
海拔
  • 0-100 m a.s.l.
  • 101-500 m a.s.l.
  • 501-1,000 m a.s.l.
  • 1,001-1,500 m a.s.l.
  • 1,501-2,000 m a.s.l.
  • 2,001-2,500 m a.s.l.
  • 2,501-3,000 m a.s.l.
  • 3,001-4,000 m a.s.l.
  • > 4,000 m a.s.l.
......应用的技术
  • 凸形情况
  • 凹陷情况
  • 不相关
土壤深度
  • 非常浅(0-20厘米)
  • 浅(21-50厘米)
  • 中等深度(51-80厘米)
  • 深(81-120厘米)
  • 非常深(> 120厘米)
土壤质地(表土)
  • 粗粒/轻(砂质)
  • 中粒(壤土、粉土)
  • 细粒/重质(粘土)
土壤质地(地表以下>20厘米)
  • 粗粒/轻(砂质)
  • 中粒(壤土、粉土)
  • 细粒/重质(粘土)
表土有机质含量
  • 高(>3%)
  • 中(1-3%)
  • 低(<1%)
地下水位
  • 表面上
  • < 5米
  • 5-50米
  • > 50米
地表水的可用性
  • 过量
  • 中等
  • 匮乏/没有
水质(未处理)
  • 良好饮用水
  • 不良饮用水(需要处理)
  • 仅供农业使用(灌溉)
  • 不可用
水质请参考: 地下水和地表水
盐度是个问题吗?

洪水发生
物种多样性
  • 中等
栖息地多样性
  • 中等

应用该技术的土地使用者的特征

市场定位
  • 生计(自给)
  • 混合(生计/商业)
  • 商业/市场
非农收入
  • 低于全部收入的10%
  • 收入的10-50%
  • > 收入的50%
相对财富水平
  • 非常贫瘠
  • 贫瘠
  • 平均水平
  • 丰富
  • 非常丰富
机械化水平
  • 手工作业
  • 畜力牵引
  • 机械化/电动
定栖或游牧
  • 定栖的
  • 半游牧的
  • 游牧的
个人或集体
  • 个人/家庭
  • 团体/社区
  • 合作社
  • 员工(公司、政府)
性别
  • 女人
  • 男人
年龄
  • 儿童
  • 青年人
  • 中年人
  • 老年人
每户使用面积
  • < 0.5 公顷
  • 0.5-1 公顷
  • 1-2 公顷
  • 2-5公顷
  • 5-15公顷
  • 15-50公顷
  • 50-100公顷
  • 100-500公顷
  • 500-1,000公顷
  • 1,000-10,000公顷
  • > 10,000公顷
规模
  • 小规模的
  • 中等规模的
  • 大规模的
土地所有权
  • 公司
  • 社区/村庄
  • 团体
  • 个人,未命名
  • 个人,有命名
土地使用权
  • 自由进入(无组织)
  • 社区(有组织)
  • 租赁
  • 个人
用水权
  • 自由进入(无组织)
  • 社区(有组织)
  • 租赁
  • 个人
进入服务和基础设施的通道
健康

贫瘠
x
教育

贫瘠
x
技术援助

贫瘠
x
就业(例如非农)

贫瘠
x
市场

贫瘠
x
能源

贫瘠
x
道路和交通

贫瘠
x
饮用水和卫生设施

贫瘠
x
金融服务

贫瘠
x

影响

社会经济影响
社会文化影响
生态影响
场外影响

成本效益分析

与技术建立成本相比的效益
短期回报
非常消极
x
非常积极

长期回报
非常消极
x
非常积极

与技术维护成本相比的效益
短期回报
非常消极
x
非常积极

长期回报
非常消极
x
非常积极

The monitoring technology was applied for the first time to draw a baseline. Based on the results, activities have been planned and pilot measures have been implemented (exclusion from grazing, reforestation, regulation of grazing intensity). Future replications of the monitoring will show changes and evaluate success of measures. The technologies to control erosion are described separately in the WOCAT database (Community-based Erosion Control [Azerbaijan]; Pasture-weed control by thistle cutting [Georgia]; High-altitude afforestation for erosion control [Armenia]; Slope erosion control using wooden pile walls [Armenia]). The costs of the remote sensing approach have not been invested by the land owners but by GIZ and the Ministry. Therefore there are no direct negative impact caused by the investment. The maintenance will be covered by public authorities as well. The positive impact for the land users are the clearly delineated pasture unit giving the exact area of grassland and the accessible amount of fodder biomass. By this, the lease-rate can be found according to the productivity and the number of livestock can be adapted to the carrying capacity of the land within the lease contract.

气候变化

渐变气候
季雨量 减少

非常不好
x
非常好
季节: 夏季

采用和适应

采用该技术的地区内土地使用者的百分比
  • 单例/实验
  • 1-10%
  • 11-50%
  • > 50%
在所有采用这种技术的人当中,有多少人在没有获得物质奖励的情况下采用了这种技术?
  • 0-10%
  • 11-50%
  • 51-90%
  • 91-100%
户数和/或覆盖面积
The technology is desigend to be applied by national or regional addministrations and not by land owners themselves.
最近是否对该技术进行了修改以适应不断变化的条件?
什么样的变化条件?
  • 气候变化/极端气候
  • 不断变化的市场
  • 劳动力可用性(例如,由于迁移)

结论和吸取的教训

长处: 土地使用者的观点
  • The monitoring technology can help to find erosion and degradation hot spots and based on this spatial information counter measures can be applied to save the productivity of land. As the income from agricultural activities and livestock breeding is of high priority in this pilot region, the protection of the productivity of land is of high importance to the local land users.
长处: 编制者或其他关键资源人员的观点
  • The presented remote sensing technologies are a cost efficient and objective way to monitor land degradation and land use changes on large areas on long time periods. Based on this spatial data, land use regulations can be integrated in spatial planning and other legal and practical frameworks (e.g. pasture lease contracts) to counter act the degradation processes. The success of the measures and the development of degradation and rehabilitation can be monitored by the same toolset.
弱点/缺点/风险: 土地使用者的观点如何克服
  • The technology is complex and cannot be applied by the land user her-/himself and is sometimes hard to understand. Therefore they might mistrust in the results and are not eager to accept regulations and measures to stop degradation. Transparent documentation of the technology and regular field visits to evaluate together with the land owners and users the remote sensing results in the field.
弱点/缺点/风险: 编制者或其他关键资源人员的观点如何克服
  • The institutional setup on the national level for the regular application of the remote sensing technology and the storage and management of the monitoring data is not established yet. GIS, remote sensing and soil experts are of limited availability. Institutional capacity building and academic training courses provided at the Georgian universities can help to overcome these limitations.
  • Field data for calibration of satellite images (biomass volumes, classified land cover types, soil types, land management types) with exact information on the spatial location are rare and costly to be created. Such data and information should be organised and gathered on national level across different sectors (agriculture, forestry, spatial planing, nature conservation ...). This would help to reduce significantly the costs and remote sensing could be applied on much larger areas.

参考文献

编制者
  • Hanns Kirchmeir
Editors
  • Natia Kobakhidze
  • Christian Goenner
审查者
  • Rima Mekdaschi Studer
实施日期: Aug. 23, 2019
上次更新: Aug. 31, 2020
资源人
WOCAT数据库中的完整描述
链接的SLM数据
文件编制者
机构 项目
主要参考文献
  • Land Degradation Neutrality 25.10.2017: https://e-c-o.at/files/publications/downloads/D00813_ECO_policy_brief_LDN_Georgia_171025.pdf
链接到网络上可用的相关信息
This work is licensed under Creative Commons Attribution-NonCommercial-ShareaAlike 4.0 International