Remote Sensing as a Tool for Land Degradation Neutrality Monitoring [乔治亚]
- 创建:
- 更新:
- 编制者: Hanns Kirchmeir
- 编辑者: Natia Kobakhidze, Christian Goenner
- 审查者: Rima Mekdaschi Studer
technologies_5488 - 乔治亚
查看章节
全部展开 全部收起1. 一般信息
1.2 参与该技术评估和文件编制的资源人员和机构的联系方式
co-compiler:
co-compiler:
有助于对技术进行记录/评估的项目名称(如相关)
Integrated Biodiversity Management, South Caucasus (IBiS)有助于对技术进行记录/评估的机构名称(如相关)
Deutsche Gesellschaft für Internationale Zusammenarbeit (GIZ)1.3 关于使用通过WOCAT记录的数据的条件
编制者和关键资源人员接受有关使用通过WOCAT记录数据的条件。:
是
1.4 所述技术的可持续性声明
这里所描述的技术在土地退化方面是否存在问题,导致无法被认为是一种可持续的土地管理技术?:
否
1.5 参考关于SLM方法(使用WOCAT记录的SLM方法)的调查问卷
Land Degradation Neutrality Transformative Projects and Programmes (LDN-TPP) … [乔治亚]
In the framework of the project ‘Generating Economic and Environmental Benefits from Sustainable Land Management for Vulnerable Rural Communities of Georgia’, Land Degradation Neutrality Transformative Projects and Programmes (LDN-TPP) were developed to implement the LDN targets at municipal level. The approach defines the process to break down global and international …
- 编制者: Daniel Zollner
Integrated Pasture Management Planning in Mountainous Regions [乔治亚]
The unsustainable use of pastures and forest areas has led to soil erosion, degradation, desertification and loss of biodiversity in the high mountain areas of the South Caucasus. The development of pasture passports is part of a broader approach to a strategic pasture management plan for Tusheti. This showcase includes …
- 编制者: Hanns Kirchmeir
2. SLM技术的说明
2.1 技术简介
技术定义:
Land degradation contributes to biodiversity loss and the impoverishment of rural livelihoods in Tusheti. Above all, however, land degradation are triggered by climate change as traditional land use practise might not be adapted to new climate conditions which can cause or speed up degradation processes significantly. On the other hand, degraded land often leads to low biomass volumes and this reduces the ecosystem capability to stabilise local climate conditions. The concept of Land Degradation Neutrality (LDN) and the method of using remote sensing for monitoring land degradation are tools to identify the need for local planning processes. This showcase describes the LDN monitoring concept, national targets and the technology to assess indicators, mechanism and incentives for LDN.
2.2 技术的详细说明
说明:
Purpose
The continuing global degradation of land resources threatens food security and the functioning of ecosystem services by reducing or losing their biological or economic productivity. Unsustainable land-use practices such as deforestation, overgrazing and inappropriate agricultural management systems trigger the loss and degradation of valuable land resources in Georgia. These effects are visible in all countries of the South Caucasus. About 35% of the agricultural land in Georgia is severely degraded, 60% is of low to middle production quality.
Land Degradation Neutrality (LDN)
LDN is a new international concept to combat the ongoing degradation of valuable soil resources. The LDN concept was developed by the UNCCD to encourage countries to take measures to avoid, reduce or reverse land degradation, with the vision of achieving a zero-net loss of productive land. To combat land degradation in Georgia, in 2017, the national LDN Working Group set voluntary national targets to address specific aspects of LDN, and submitted them to the UNCCD Secretariat.
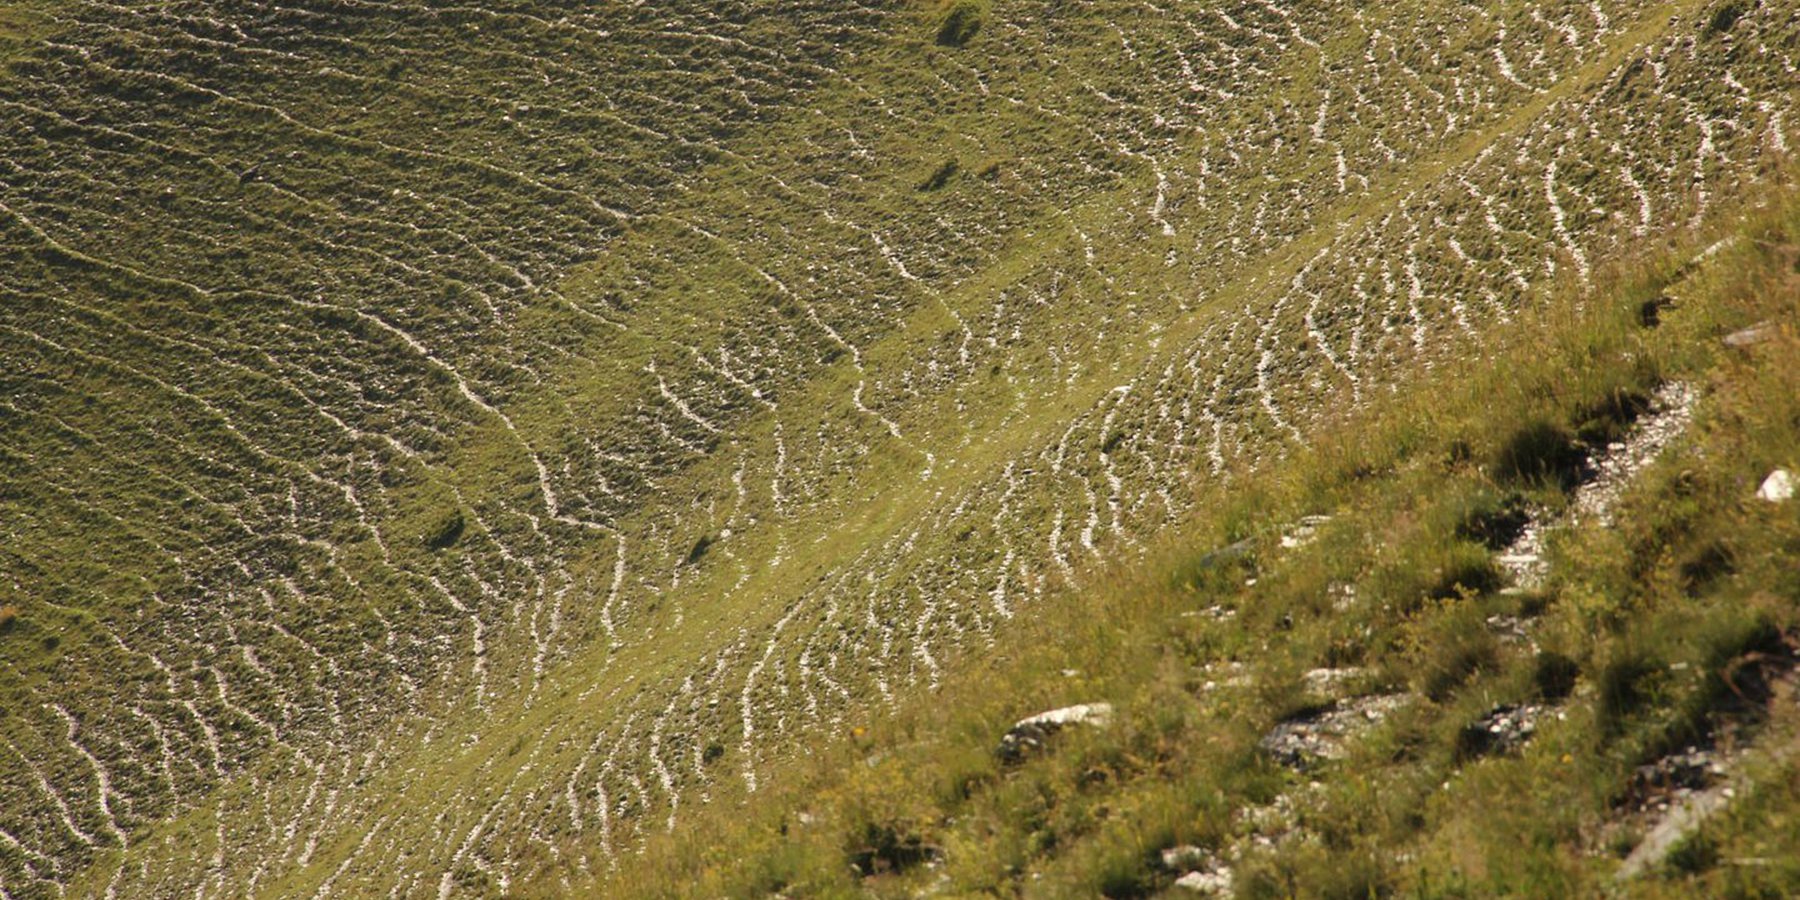
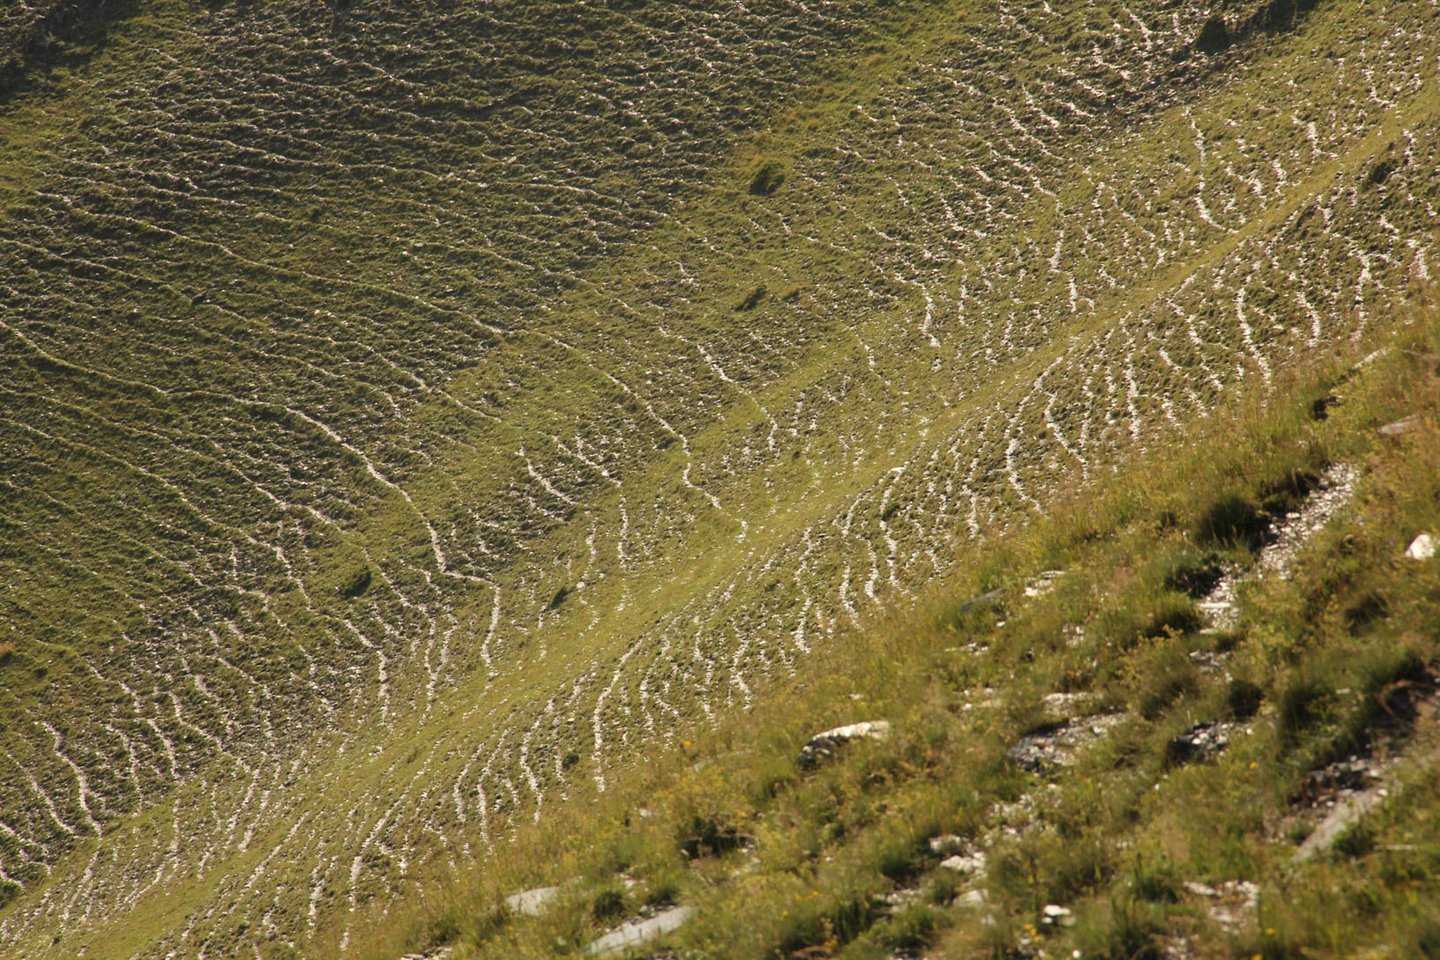
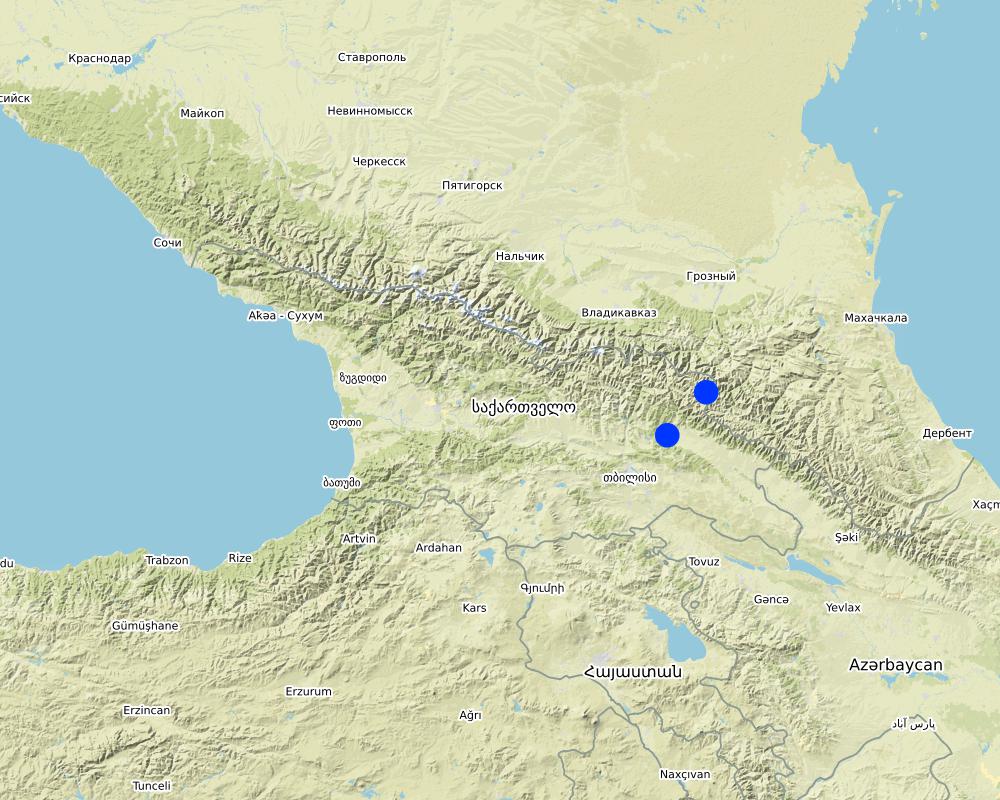
To effectively set up counter measures to combat land degradation it is important to have detailed spatial information on land cover and land cover changes as well as on trends in degradation (like size of areas effected by erosion). Therefore a remote sensing toolset was developed and tested in the pilot are of Tusheti protected landscapes in the High Caucasus in Georgia. This region shows increasing soil erosion problems by uneven distribution of grazing activities and was selected for developing erosion control measures within the Integrated Biodiversity Management in the South Caucasus Program (IBiS) funded by the Deutsche Gesellschaft für internationale Zusammenarbeit (GIZ).
Sensitivity Model
The Integrated Biodiversity Management in the South Caucasus (IBiS) project in cooperation with national experts in Georgia, developed and applied a remote sensing toolset called "Erosion Sensitivity Model". This remote sensing toolset helps to assess the current state and the general erosion risk. The sensitivity model is based on the RUSLE – Revised Universal Soil Loss Equation. The tool allows the calculation of erosion caused by rainfall and surface run-off. The RUSLE equation incorporates a combination of different input factors such as precipitation (R), soil type (K), slope (LS), vegetation cover (C) and protection measures (P). In this way, the estimated average soil loss in tonnes per acre per year (A) can be calculated as follows: A = R * K * LS * C * P.
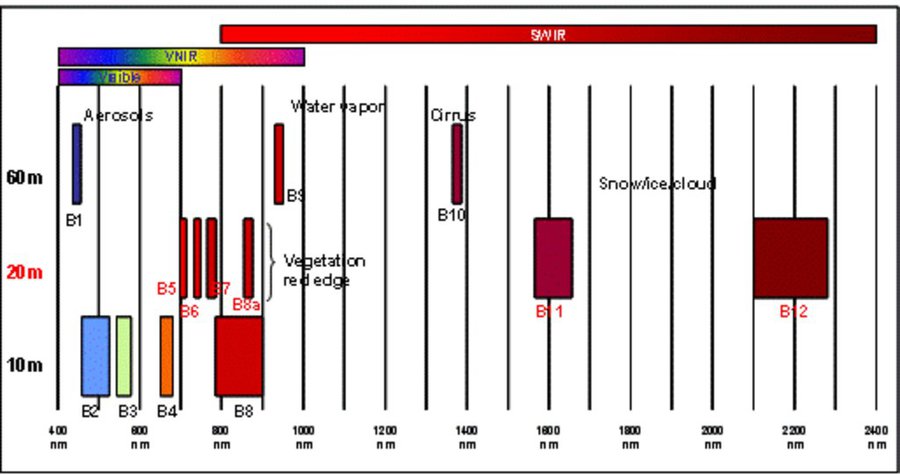
The rainfall factor (R) results from a quotient from the monthly and annual mean value of precipitation. The data come from the data platform “CHELSA – Climatologies at high resolution for the earth’s land surface areas”. For the soil type factor (K), a soil map of 1:200,000 was taken. Then, depending on the soil type, different contents of sand, silt, loam and clay were used to calculate the K factor. The slope length and steepness factor (LS) is calculated from a digital elevation model (DEM) with a raster resolution of 10x10m. The DEM is derived from the topographic map 1:25,000. The global elevation model derived from SRTM data (Shuttle Radar Topography Mission) has a resolution of 30x30 m and is available worldwide free of charge. The land cover factor (C) describes the vegetation cover that protects the soil from erosion. The vegetation cover slows down the speed of the raindrops and reduces the erosive effect of the rain. It slows down surface water runoff and stabilises the soil through root systems. The main indicators, land cover and productivity, can be assessed by remote sensing. The data from satellites need to be classified and calibrated by field data (ground truthing). The technology for the assessment of these indicators with Sentinel 2 satellite images was developed and applied in 2016 to 2018 in the Tusheti region (Akhmeta municipality) in the framework of the GIZ-IBiS project. Based on spectral information from airborne or satellite images, the density of the vegetation was calculated and mapped. There are well developed vegetation indices and classification systems to derive different land cover types and vegetation densities (mainly described by the Leaf Area Index LAI or biomass indices). The LAI is the area of the leaf surface (in square meters) per square meter ground surface. Since the real surface area of the leaves is hardly measurable, the amount of biomass is a proxy for the LAI. The P-factor is rarely considered in large-scale modelling of soil erosion risk as it is difficult to estimate it with very high accuracy. Therefore, to refine the model, a more detailed DEM (digital elevation model) is required (e.g., from satellite images). Based on the input factors, a soil erosion risk map was calculated for the whole territory of the Tusheti Protected Areas (113,660 ha). Based on the different spectral bands of the Sentinel 2 satellite image, a land cover map was calculated using the Support Vector Machine (SVM) technology and spectral image information.
The results have been integrated in the development of pasture management plans ("pasture passports"). This maps and documents are indicating areas of high erosion risk that need to be excluded from grazing and the maximum number of livestock has been calculated based on the biomass maps and will be integrated into the lease contracts.
The repetition of the remote sensing after some years (e.g. 5 years) will help to evaluate, if the measures in the pasture management have been successful to stop the degradation processes.
2.3 技术照片
媒体库
2.5 已应用该技术的、本评估所涵盖的国家/地区/地点
国家:
乔治亚
区域/州/省:
Tusheti region, Akhmeta municipality
具体说明该技术的分布:
- 均匀地分布在一个区域
如果技术均匀分布在一个区域,则指定覆盖的区域(单位为平方千米):
1000.0
技术现场是否位于永久保护区?:
是
如果是,请具体说明:
The area is in the Tusheti Protected Areas (Tusheti Strict Nature Reserve, Tusheti National Park, Tusheti Protected Landscape).
注释:
The whole territory was analysed by remote sensing and field records for calibration were collected on sample plots from different places in Tusheti.
Map
×2.6 实施日期
注明实施年份:
2016
2.7 技术介绍
详细说明该技术是如何引入的:
- 通过项目/外部干预
3. SLM技术的分类
3.1 该技术的主要目的
- 改良生产
- 减少、预防、恢复土地退化
- 保持/提高生物多样性
- provide information to make a spatial-territorial planning
3.2 应用该技术的当前土地利用类型
同一土地单元内混合使用的土地::
是
具体说明混合土地使用(作物/放牧/树木):
- 农牧业(包括农牧结合)

农田
- 一年一作
年作 - 具体指明作物:
- 谷类 - 大麦
- 根/块茎作物 - 土豆
每年的生长季节数:
- 1
采用间作制度了吗?:
否
采用轮作制度了吗?:
否

牧场
粗放式放牧:
- 季节性迁移的放牧主义
动物类型:
- cattle - dairy and beef (e.g. zebu)
- 绵羊
是否实行作物与牲畜的综合管理?:
否
3.3 由于技术的实施,土地使用是否发生了变化?
由于技术的实施,土地使用是否发生了变化?:
- 否(继续问题3.4)
3.4 供水
其它(比如洪水后):
- rainfed and mixed rained-irrigation
3.5 该技术所属的SLM组
- 畜牧业和牧场管理
- 改良的地面/植被覆盖
3.6 包含该技术的可持续土地管理措施

管理措施
- M2:改变管理/强度级别
其它措施
具体说明:
It is a monitoring technology to evaluate land management activities.
注释:
On some pilot plots technologies to control erosion and stop land degradation have been tested. This includes fencing, rotational pasture management, mulching and installing check dams to stop gully erosion.
3.7 该技术强调的主要土地退化类型

土壤水蚀
- Wt:表土流失/地表侵蚀
- Wg:冲沟侵蚀/沟蚀

物理性土壤退化
- Pc:压实

生物性退化
- Bc:植被覆盖的减少
- Bq:数量/生物量减少
注释:
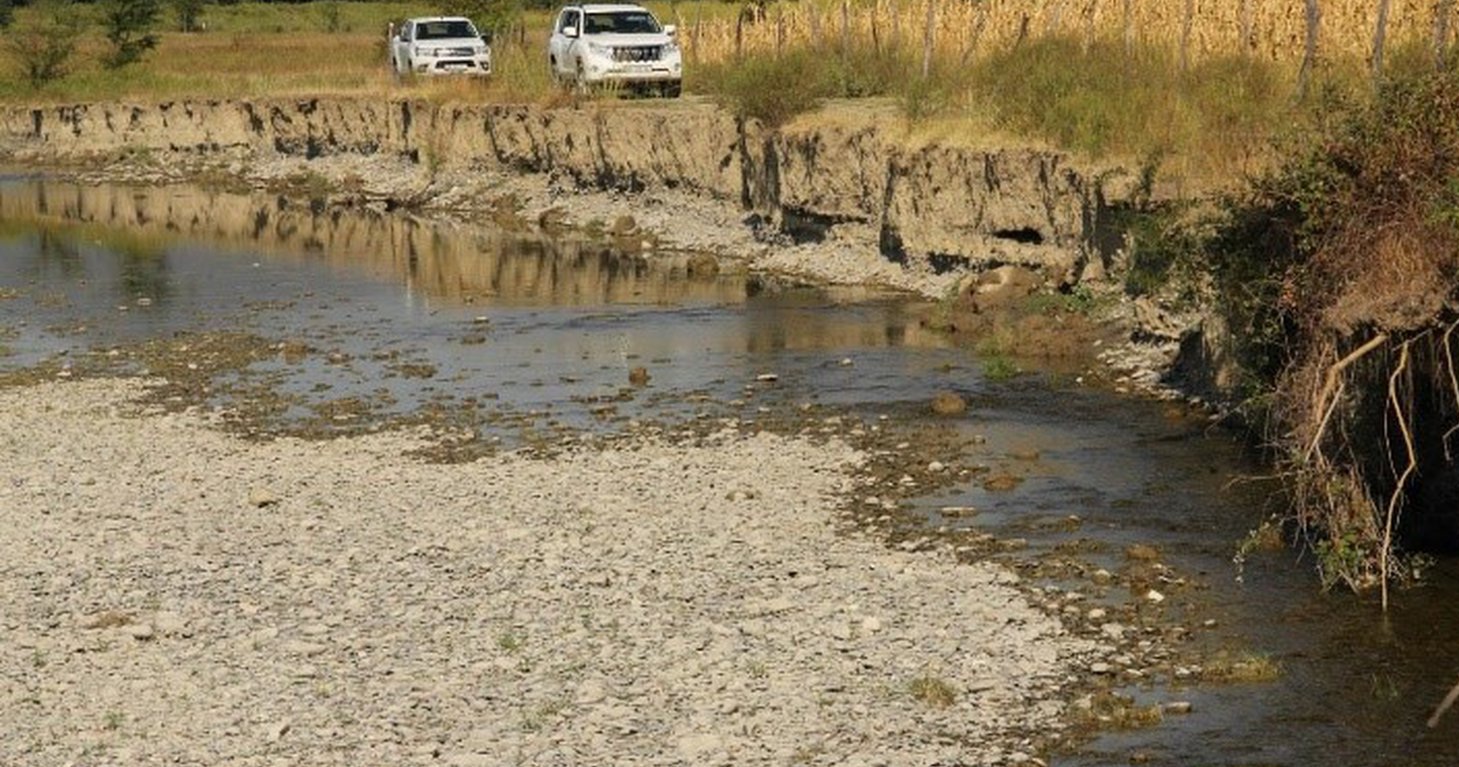
The main drivers of land degradation in the pilot area are overgrazing and trampling, off-road driving as well as infrastructure development (especially inappropriate road construction in steep slopes).
3.8 防止、减少或恢复土地退化
具体数量名该技术与土地退化有关的目标:
- 防止土地退化
- 减少土地退化
注释:
The monitoring tools presented here help to monitor the development of land degradation and to evaluate measures and development trends.
4. 技术规范、实施活动、投入和成本
4.1 该技术的技术图纸
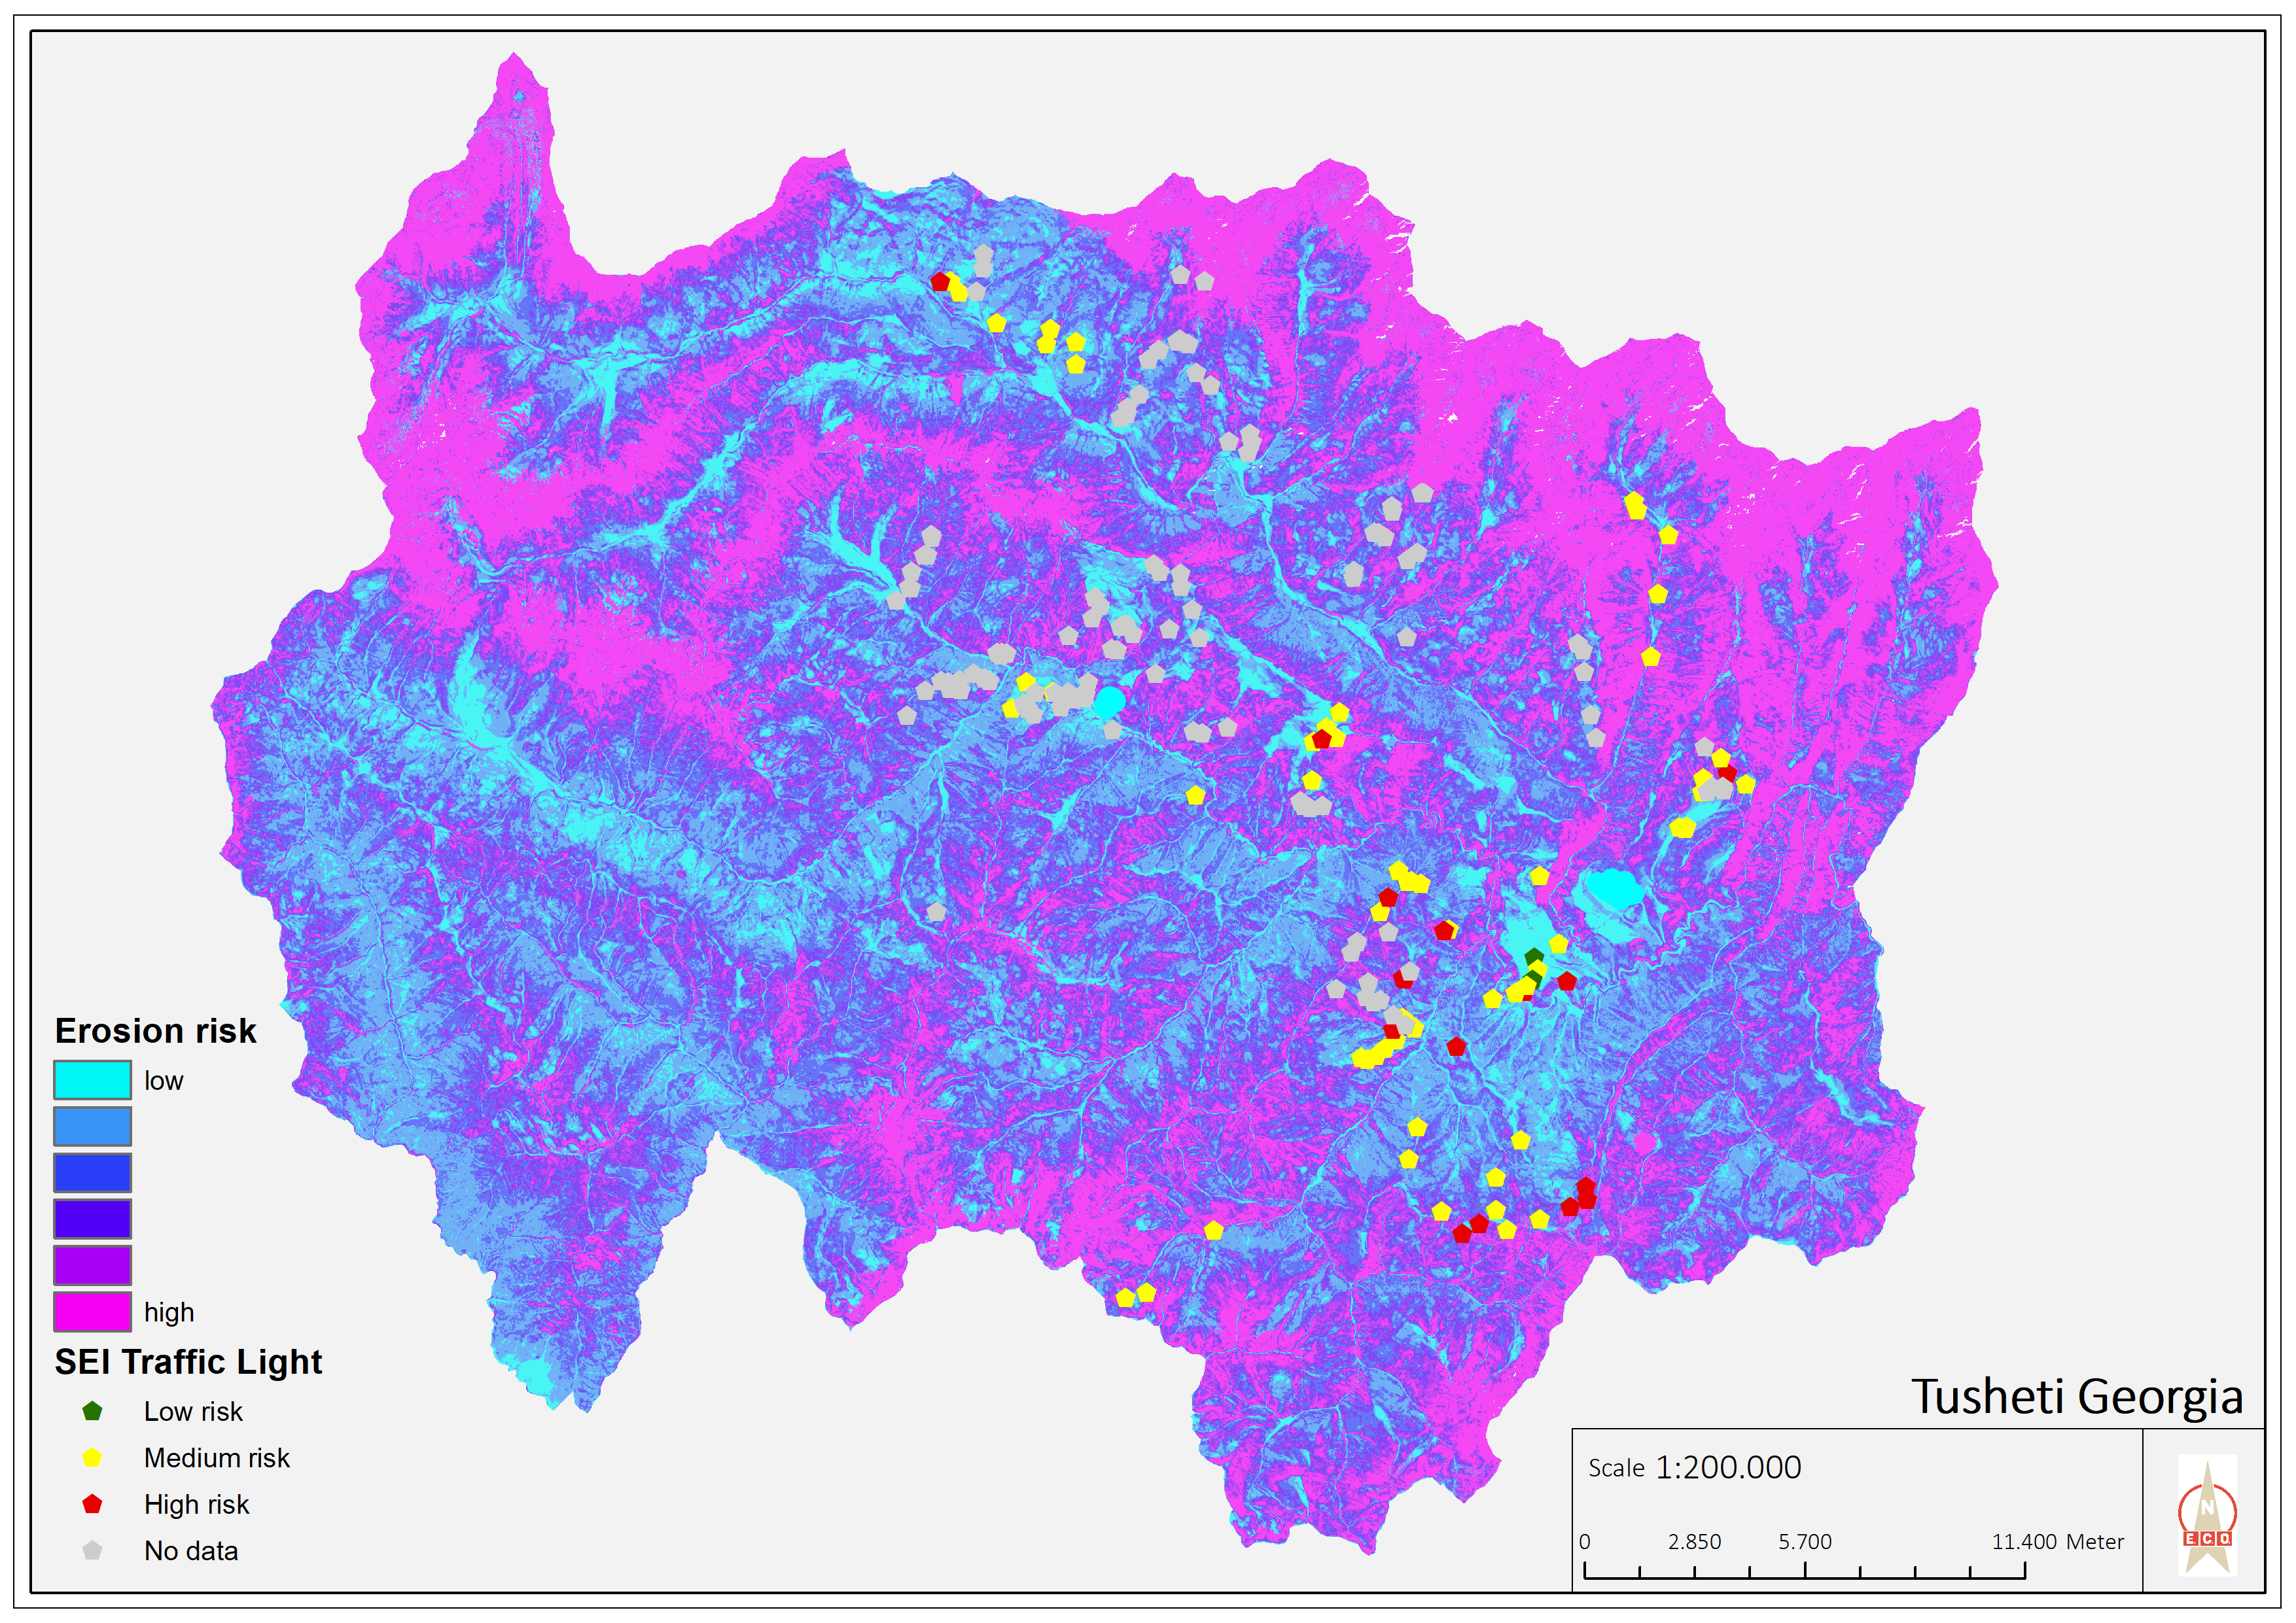
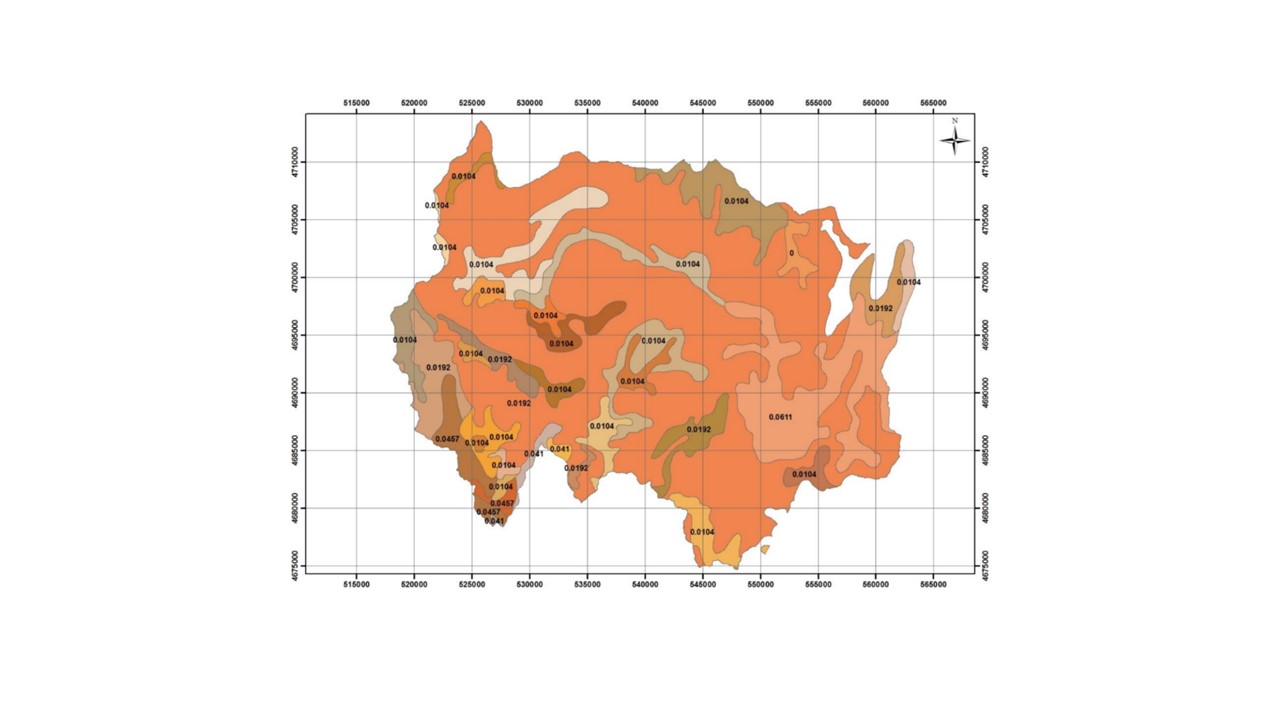
技术规范(与技术图纸相关):
Map of erosion hot spots (pink colour) and the location of field sample plots for evaluation and ground truthing.
作者:
Hanns Kirchmeir
日期:
11/09/2019
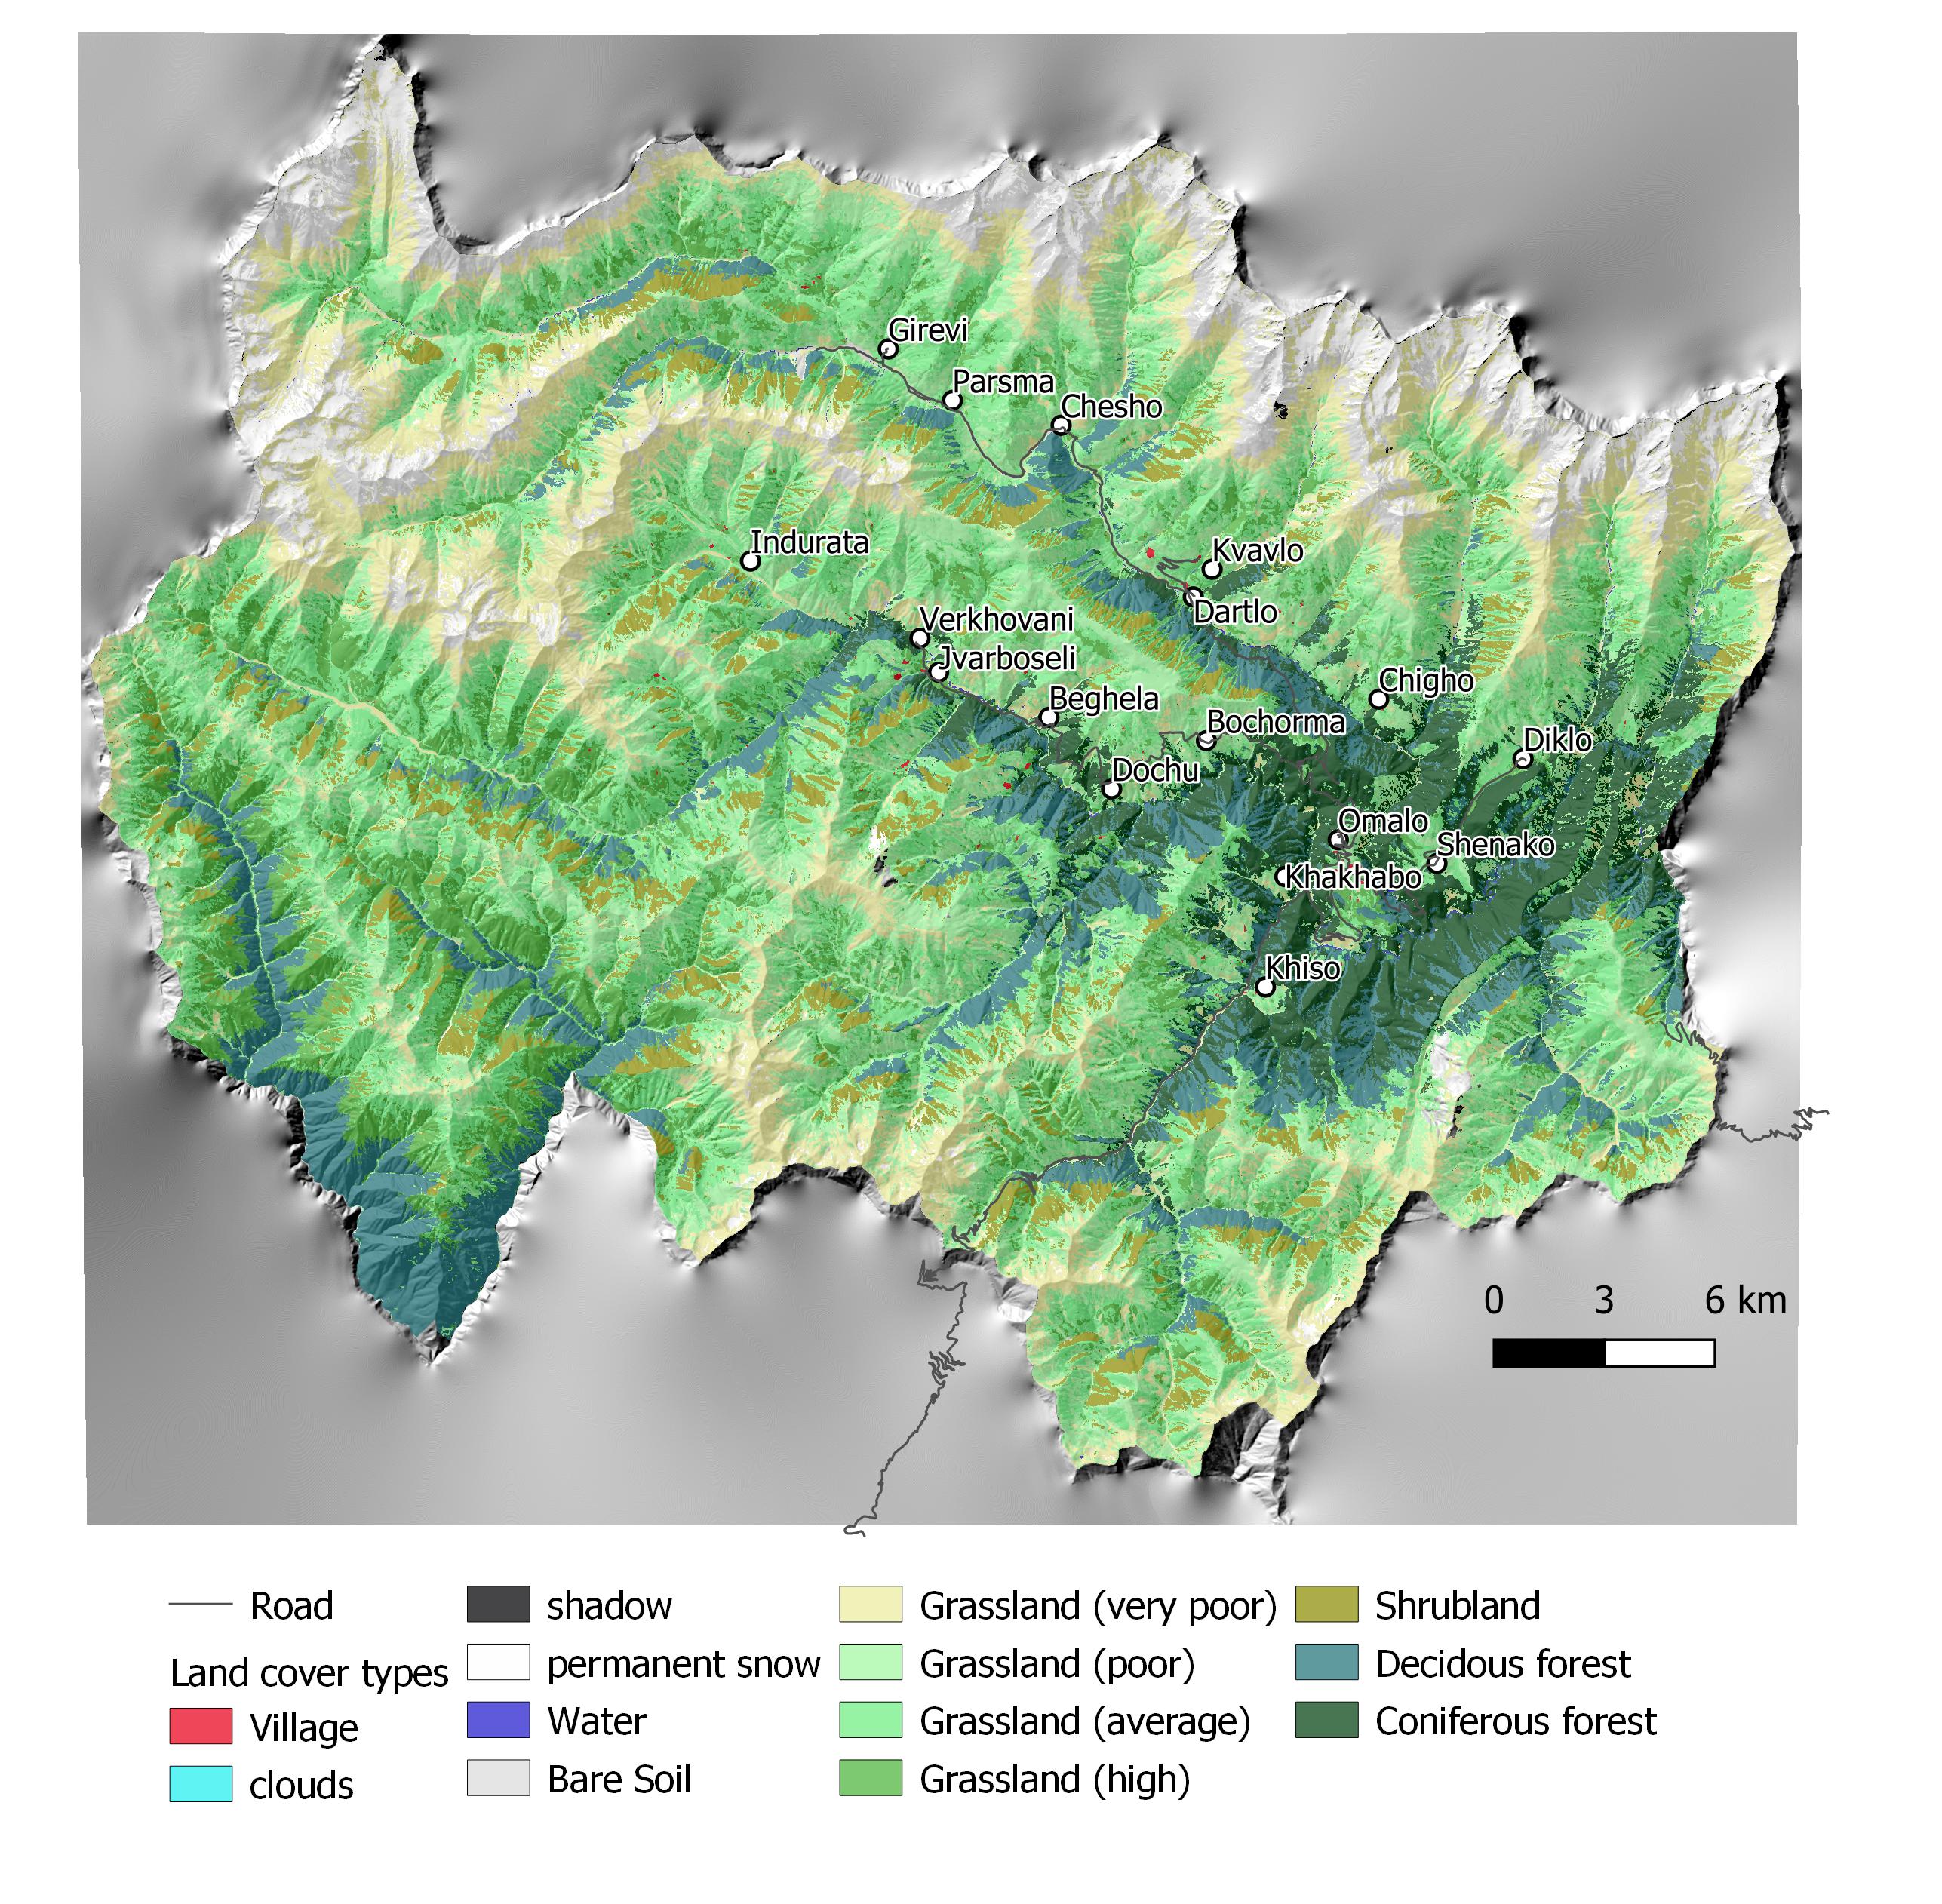
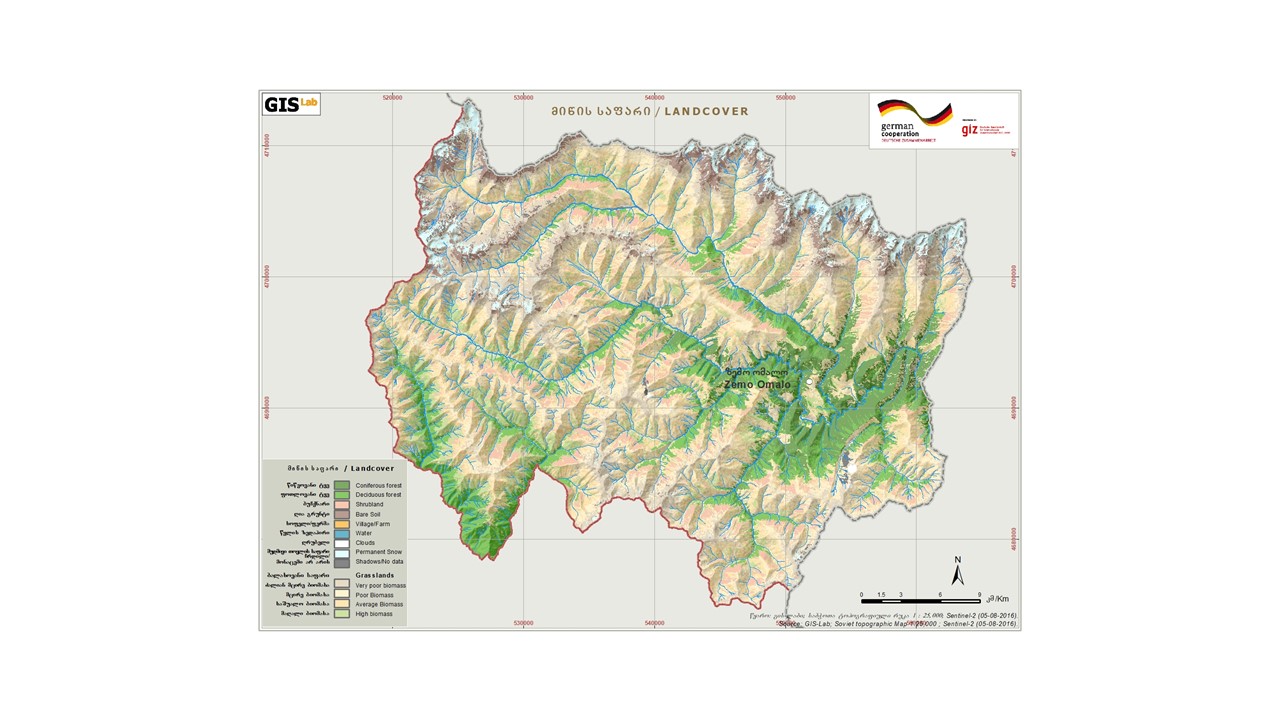
技术规范(与技术图纸相关):
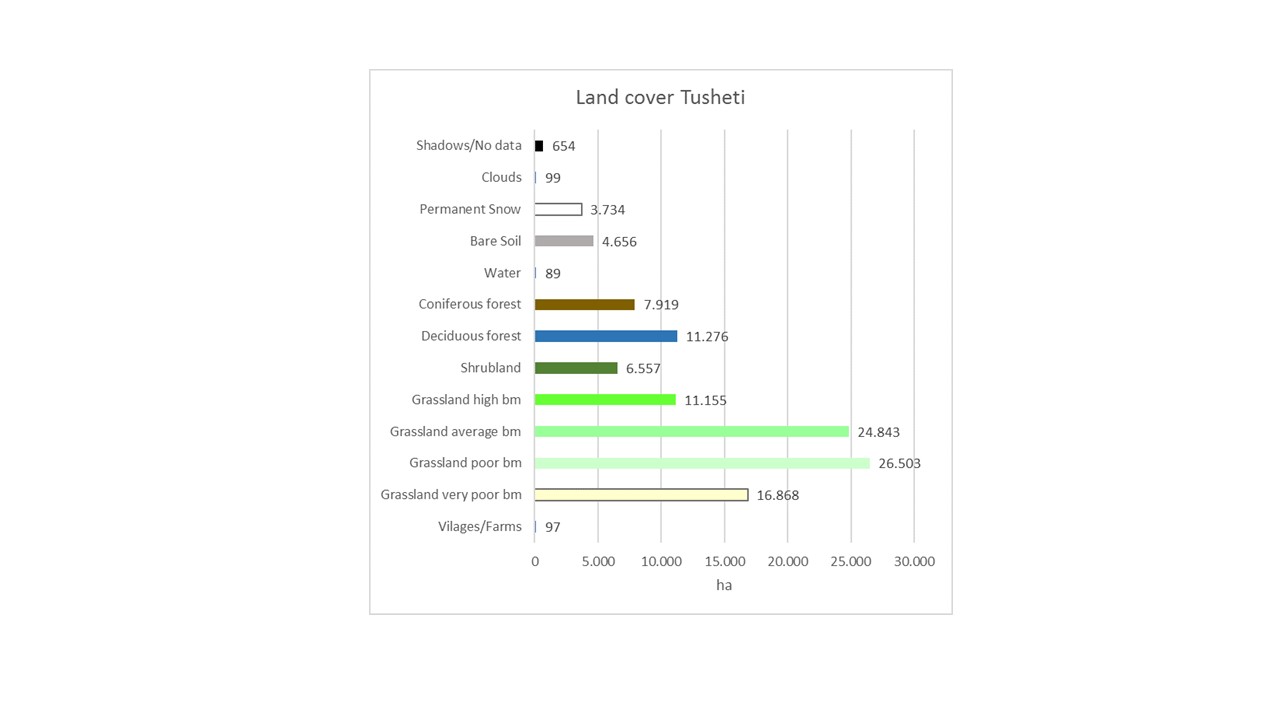
Map of land cover classification derived from satellite images. The different grassland types are classified by their biomass as an indicator of productivity and current state. Repeating the satellite image classification with the same parameters after 5 or 10 years can give a clear picture of changes in the land cover.
作者:
Hanns Kirchmeir
日期:
11/09/2019
4.2 有关投入和成本计算的一般信息
具体说明成本和投入是如何计算的:
- 每个技术区域
注明尺寸和面积单位:
1000 km2
具体说明成本计算所用货币:
- 美元
注明雇用劳工的每日平均工资成本:
100
4.3 技术建立活动
| 活动 | 时间(季度) | |
|---|---|---|
| 1. | National level. Baseline: Field assessment for remote sensing calibration (1x/20 years) | 2017 |
| 2. | Sentinel satellite image classification (multi temporal data from 2017) | 2017 |
| 3. | Statistical data from GEOSTAT Agricultural census | 2014-2016 |
| 4. | Analysis of soil carbon content from existing profiles | 2003 - 2006 |
| 5. | Conduct ongoing monitoring | 5 years intervals |
| 6. | Update sentinel satellite image classification | 1x year |
| 7. | Update statistical data from GEOSTAT Agricultural census | 4x/year |
| 8. | Resampling of soil carbon content near existing profiles | 1x/5 years |
| 9. | Municipal level. Spatial planning: Assessment of current stage of land degradation, anticipated gains and losses | 1x/10 years |
| 10. | Revision of spatial planning on Municipal level. | 1x / 5 years |
4.4 技术建立所需要的费用和投入
| 对投入进行具体说明 | 单位 | 数量 | 单位成本 | 每项投入的总成本 | 土地使用者承担的成本% | |
|---|---|---|---|---|---|---|
| 劳动力 | Remote Sensing analysis by Sentinel Satellite data | person days | 50.0 | 200.0 | 10000.0 | |
| 劳动力 | Collecting field data for satellite image callibration | person days | 40.0 | 200.0 | 8000.0 | |
| 劳动力 | Soil sampling (for carbon content) | person days | 20.0 | 200.0 | 4000.0 | |
| 劳动力 | Including results in spatial planning | person days | 10.0 | 200.0 | 2000.0 | |
| 技术建立所需总成本 | 24000.0 | |||||
| 技术建立总成本,美元 | 24000.0 | |||||
注释:
This covers the implementation of the baseline. Calibrating the model for erosion risk and land cover classification is an big investment but can be extended to larger areas than 1000 km² with similar resources.
4.5 维护/经常性活动
| 活动 | 时间/频率 | |
|---|---|---|
| 1. | Repeating the application of the calibrated remote sensing model for monitoring repitition | with 5 years interval |
| 2. | Repetition of soil samples for assessing soil carbon content | with 5 years interval |
| 3. | Analysing the results and integrate them in spatial planning and policy making | with 5 years interval |
4.6 维护/经常性活动所需要的费用和投入(每年)
| 对投入进行具体说明 | 单位 | 数量 | 单位成本 | 每项投入的总成本 | 土地使用者承担的成本% | |
|---|---|---|---|---|---|---|
| 劳动力 | Applying the calibrated remote sensing model for monitoring repetition | person days | 20.0 | 200.0 | 4000.0 | |
| 劳动力 | Repetition of soil samples for assessing soil carbon content | person days | 10.0 | 200.0 | 2000.0 | |
| 劳动力 | Analysing results and integrating in spatial planning | person days | 10.0 | 200.0 | 2000.0 | |
| 技术维护所需总成本 | 8000.0 | |||||
| 技术维护总成本,美元 | 8000.0 | |||||
注释:
For the repetition of the remote sensing no new calibration of the GIS-model is needed. Only the field samples for soil carbon need to be repeated.
4.7 影响成本的最重要因素
描述影响成本的最决定性因素:
Field sample collection;
Remote sensing experts.
5. 自然和人文环境
5.1 气候
年降雨量
- < 250毫米
- 251-500毫米
- 501-750毫米
- 751-1,000毫米
- 1,001-1,500毫米
- 1,501-2,000毫米
- 2,001-3,000毫米
- 3,001-4,000毫米
- > 4,000毫米
指定年平均降雨量(若已知),单位为mm:
800.00
有关降雨的规范/注释:
The climate is generally suitable for agriculture with an annual precipitation of up to 800 mm, with hot and humid springs, rainfall peaks in May and June with hot and dry summers.
农业气候带
- 半湿润
- 半干旱
5.2 地形
平均坡度:
- 水平(0-2%)
- 缓降(3-5%)
- 平缓(6-10%)
- 滚坡(11-15%)
- 崎岖(16-30%)
- 陡峭(31-60%)
- 非常陡峭(>60%)
地形:
- 高原/平原
- 山脊
- 山坡
- 山地斜坡
- 麓坡
- 谷底
垂直分布带:
- 0-100 m a.s.l.
- 101-500 m a.s.l.
- 501-1,000 m a.s.l.
- 1,001-1,500 m a.s.l.
- 1,501-2,000 m a.s.l.
- 2,001-2,500 m a.s.l.
- 2,501-3,000 m a.s.l.
- 3,001-4,000 m a.s.l.
- > 4,000 m a.s.l.
说明该技术是否专门应用于:
- 不相关
关于地形的注释和进一步规范:
The remote sensing approach was applied for the total landscape of Tusheti, including a great variety of land-forms, altitudes ranging from 1600-4000 m a.s.l.
5.3 土壤
平均土层深度:
- 非常浅(0-20厘米)
- 浅(21-50厘米)
- 中等深度(51-80厘米)
- 深(81-120厘米)
- 非常深(> 120厘米)
土壤质地(表土):
- 中粒(壤土、粉土)
土壤质地(地表以下> 20厘米):
- 中粒(壤土、粉土)
表土有机质:
- 中(1-3%)
5.4 水资源可用性和质量
地下水位表:
表面上
地表水的可用性:
中等
水质(未处理):
不良饮用水(需要处理)
水质请参考::
地下水和地表水
水的盐度有问题吗?:
否
该区域正在发生洪水吗?:
否
5.5 生物多样性
物种多样性:
- 中等
栖息地多样性:
- 高
5.6 应用该技术的土地使用者的特征
定栖或游牧:
- 半游牧的
生产系统的市场定位:
- 混合(生计/商业)
非农收入:
- 低于全部收入的10%
相对财富水平:
- 贫瘠
个人或集体:
- 个人/家庭
机械化水平:
- 手工作业
- 畜力牵引
性别:
- 女人
- 男人
土地使用者的年龄:
- 中年人
说明土地使用者的其他有关特征:
The technology is applied by the Government.
5.7 应用该技术的土地使用者使用的平均土地面积
- < 0.5 公顷
- 0.5-1 公顷
- 1-2 公顷
- 2-5公顷
- 5-15公顷
- 15-50公顷
- 50-100公顷
- 100-500公顷
- 500-1,000公顷
- 1,000-10,000公顷
- > 10,000公顷
这被认为是小规模、中规模还是大规模的(参照当地实际情况)?:
- 中等规模的
注释:
The pasture units are fom 200 to 600 hectares and are based on the old Soviet grazing scheme.
5.8 土地所有权、土地使用权和水使用权
土地所有权:
- 州
土地使用权:
- 社区(有组织)
- 租赁
用水权:
- 自由进入(无组织)
土地使用权是否基于传统的法律制度?:
否
5.9 进入服务和基础设施的通道
健康:
- 贫瘠
- 适度的
- 好
教育:
- 贫瘠
- 适度的
- 好
技术援助:
- 贫瘠
- 适度的
- 好
就业(例如非农):
- 贫瘠
- 适度的
- 好
市场:
- 贫瘠
- 适度的
- 好
能源:
- 贫瘠
- 适度的
- 好
道路和交通:
- 贫瘠
- 适度的
- 好
饮用水和卫生设施:
- 贫瘠
- 适度的
- 好
金融服务:
- 贫瘠
- 适度的
- 好
6. 影响和结论性说明
6.1 该技术的现场影响
生态影响
土壤
土壤覆盖层
注释/具体说明:
Within the timeframe until 2030, specific process indicators to assess the progress will be done.
其它生态影响
Changes in the quality of forests
注释/具体说明:
tree height, stand density
Changes of the quality of pastures
注释/具体说明:
biomass production
Changes in the quality of arable land
注释/具体说明:
yield
对现场影响的评估(测量)进行具体说明:
The monitoring technology was applied for the first time to draw a baseline. Based on the results, activities have been planned and pilot measures have been implemented (exclusion from grazing, reforestation, regulation of grazing intensity). Future replications of the monitoring will show changes and evaluate success of measures. The technologies to control erosion are described separately in the WOCAT database (Community-based Erosion Control [Azerbaijan]; Pasture-weed control by thistle cutting [Georgia]; High-altitude afforestation for erosion control [Armenia]; Slope erosion control using wooden pile walls [Armenia])
6.2 该技术的场外影响已经显现
对场外影响(测量)的评估进行具体说明:
The technology is only about the monitoring (see above).
6.3 技术对渐变气候以及与气候相关的极端情况/灾害的暴露和敏感性(土地使用者认为的极端情况/灾害)
渐变气候
渐变气候
| 季节 | 增加或减少 | 该技术是如何应对的? | |
|---|---|---|---|
| 季雨量 | 夏季 | 减少 | 非常好 |
注释:
Technology is sensitive, it shows the climate change, the impact of the global change locally. The technology itself is not affected by climatic changes.
6.4 成本效益分析
技术收益与技术建立成本相比如何(从土地使用者的角度看)?
短期回报:
中性/平衡
长期回报:
积极
技术收益与技术维护成本/经常性成本相比如何(从土地使用者的角度看)?
短期回报:
中性/平衡
长期回报:
稍微积极
注释:
The monitoring technology was applied for the first time to draw a baseline. Based on the results, activities have been planned and pilot measures have been implemented (exclusion from grazing, reforestation, regulation of grazing intensity). Future replications of the monitoring will show changes and evaluate success of measures. The technologies to control erosion are described separately in the WOCAT database (Community-based Erosion Control [Azerbaijan]; Pasture-weed control by thistle cutting [Georgia]; High-altitude afforestation for erosion control [Armenia]; Slope erosion control using wooden pile walls [Armenia]).
The costs of the remote sensing approach have not been invested by the land owners but by GIZ and the Ministry. Therefore there are no direct negative impact caused by the investment. The maintenance will be covered by public authorities as well. The positive impact for the land users are the clearly delineated pasture unit giving the exact area of grassland and the accessible amount of fodder biomass. By this, the lease-rate can be found according to the productivity and the number of livestock can be adapted to the carrying capacity of the land within the lease contract.
6.5 技术采用
- 单例/实验
如若可行,进行量化(住户数量和/或覆盖面积):
The technology is desigend to be applied by national or regional addministrations and not by land owners themselves.
6.6 适应
最近是否对该技术进行了修改以适应不断变化的条件?:
否
6.7 该技术的优点/长处/机会
| 土地使用者眼中的长处/优势/机会 |
|---|
| The monitoring technology can help to find erosion and degradation hot spots and based on this spatial information counter measures can be applied to save the productivity of land. As the income from agricultural activities and livestock breeding is of high priority in this pilot region, the protection of the productivity of land is of high importance to the local land users. |
| 编制者或其他关键资源人员认为的长处/优势/机会 |
|---|
| The presented remote sensing technologies are a cost efficient and objective way to monitor land degradation and land use changes on large areas on long time periods. Based on this spatial data, land use regulations can be integrated in spatial planning and other legal and practical frameworks (e.g. pasture lease contracts) to counter act the degradation processes. The success of the measures and the development of degradation and rehabilitation can be monitored by the same toolset. |
6.8 技术的弱点/缺点/风险及其克服方法
| 土地使用者认为的弱点/缺点/风险 | 如何克服它们? |
|---|---|
| The technology is complex and cannot be applied by the land user her-/himself and is sometimes hard to understand. Therefore they might mistrust in the results and are not eager to accept regulations and measures to stop degradation. | Transparent documentation of the technology and regular field visits to evaluate together with the land owners and users the remote sensing results in the field. |
| 编制者或其他关键资源人员认为的弱点/缺点/风险 | 如何克服它们? |
|---|---|
| The institutional setup on the national level for the regular application of the remote sensing technology and the storage and management of the monitoring data is not established yet. GIS, remote sensing and soil experts are of limited availability. | Institutional capacity building and academic training courses provided at the Georgian universities can help to overcome these limitations. |
| Field data for calibration of satellite images (biomass volumes, classified land cover types, soil types, land management types) with exact information on the spatial location are rare and costly to be created. | Such data and information should be organised and gathered on national level across different sectors (agriculture, forestry, spatial planing, nature conservation ...). This would help to reduce significantly the costs and remote sensing could be applied on much larger areas. |
7. 参考和链接
7.1 信息的方法/来源
- 实地考察、实地调查
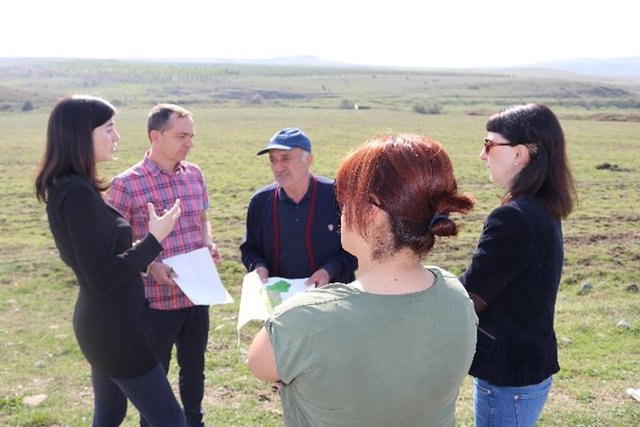
Three field visits with national and international experts as well as representatives of administrations and local stakeholders.
- 与土地使用者的访谈
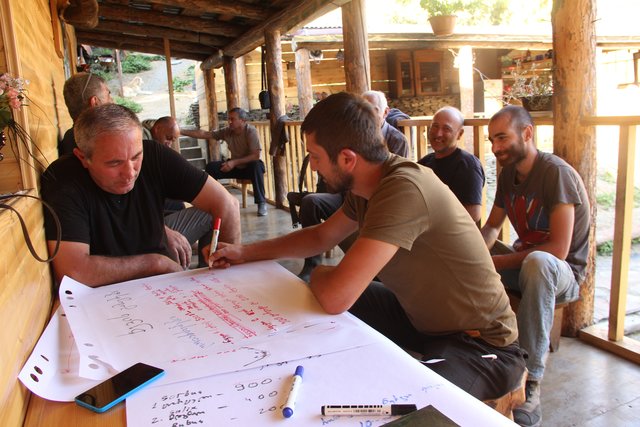
Meeting with cooperation partners, key village stakeholders from three pilot municipalities.
- 与SLM专业人员/专家的访谈
Three mission meetings with 35 experts.
- 根据报告和其他现有文档进行编译
Pilot project on land degradation neutrality in Georgia Final Report. 20.10.2017.
GISLab 2016: Development of Land Cover and Erosion Risk Map based on remote sensing for Tusheti Protected Areas. Study within the frame of GIZ-IBIS.
7.2 参考可用出版物
标题、作者、年份、ISBN:
Land Degradation Neutrality 25.10.2017
可以从哪里获得?成本如何?
https://e-c-o.at/files/publications/downloads/D00813_ECO_policy_brief_LDN_Georgia_171025.pdf
7.3 链接到网络上的相关信息
标题/说明:
Tools for satellite image analysis
URL:
http://step.esa.int/main/snap-2-0-out-now/
标题/说明:
UNCCD Good Practice Guidance on SDG Indicator 15.31. (Sims et al. 2017)
URL:
https://www.unccd.int/sites/default/files/relevant-links/2017-10/Good%20Practice%20Guidance_SDG%20Indicator%2015.3.1_Version%201.0.pdf
7.4 一般注释
UNCCD Good Practice Guidance on SDG Indicator 15.31. (Sims et al. 2017) gives a detailed technical overview on methods and approaches to calculate LDN indicators by means of remote sensing data.
链接和模块
全部展开 全部收起链接
Land Degradation Neutrality Transformative Projects and Programmes (LDN-TPP) … [乔治亚]
In the framework of the project ‘Generating Economic and Environmental Benefits from Sustainable Land Management for Vulnerable Rural Communities of Georgia’, Land Degradation Neutrality Transformative Projects and Programmes (LDN-TPP) were developed to implement the LDN targets at municipal level. The approach defines the process to break down global and international …
- 编制者: Daniel Zollner
Integrated Pasture Management Planning in Mountainous Regions [乔治亚]
The unsustainable use of pastures and forest areas has led to soil erosion, degradation, desertification and loss of biodiversity in the high mountain areas of the South Caucasus. The development of pasture passports is part of a broader approach to a strategic pasture management plan for Tusheti. This showcase includes …
- 编制者: Hanns Kirchmeir
模块
无模块